
Introduction
Intended audience
This document is intended for database administrators who would like to be prepared or who experience performance issues with one or more Linked Server(s) to an Oracle Database instance using the OraOLEDb Linked Server provider.
Context
Performance issues are part of the life of any DBA. He has to analyze server activity to deduct which queries do not perform well and eventually provide solutions. These solutions could be the creation of one or more indexes, code rewrite, database design review…
In general, the performance analysis task is done for an isolated server, where batches only run against “local” objects i.e. objects that are inside one or more databases, on the same SQL Server instance.
However, it’s possible to run so-called “distributed queries” using Linked Server server-level objects. Linked Servers are objects allowing SQL Server principals to access data on a remote server. It uses data providers like ODBC or OLEDB.
These linked server objects can be referred to as “homogeneous” when they are used to connect a SQL Server instance to another SQL Server instance. They can also be referred to as “heterogeneous” when they are used to connect a SQL Server instance to another kind of data providers like Excel or the Active Directory or even another kind of RDBMS like Oracle Database.
Obviously, end users can experience performance issues with distributed queries or batches. In this case, particular actions could be taken in order to be able in order to determine if the problem comes from local queries or from remote queries.
This article will focus on problems with distributed queries to an Oracle Database instance and we will review some actions that could be made to investigate.
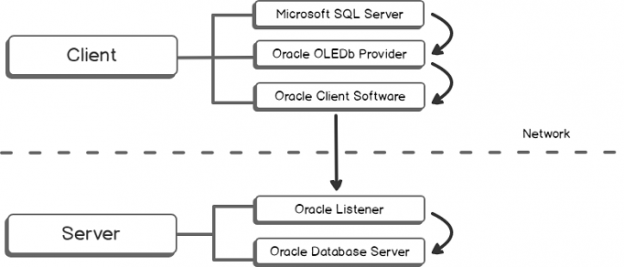
SQL Server to Oracle Database communication architecture
You will find below the path followed by a query run from a SQL Server instance to an Oracle Database instance.

There is a way to enable trace at each level or this architecture. We will only review client-side tracing in this article.
How to capture OLEDB activity
When running a query
The first way to get back OLEDB errors is by turning on trace flags 7300 and 3604. The way to use it though is:
|
1 2 3 4 5 6 |
DBCC TRACEON(7300,3604); GO <Run problematic query>; GO DBCC TRACEOFF(7300,3604); GO |
Using SQL Server Profiler (2017)
The SQL Server Profiler can track some events related to OLEDB activity. These are:
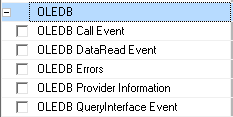
To get a complete overview of these events, please refer to Microsoft’s documentation page.
Here are the steps to follow:
- Open SQL Server Profiler
- Create a new trace
- Connect to the server instance of your choice
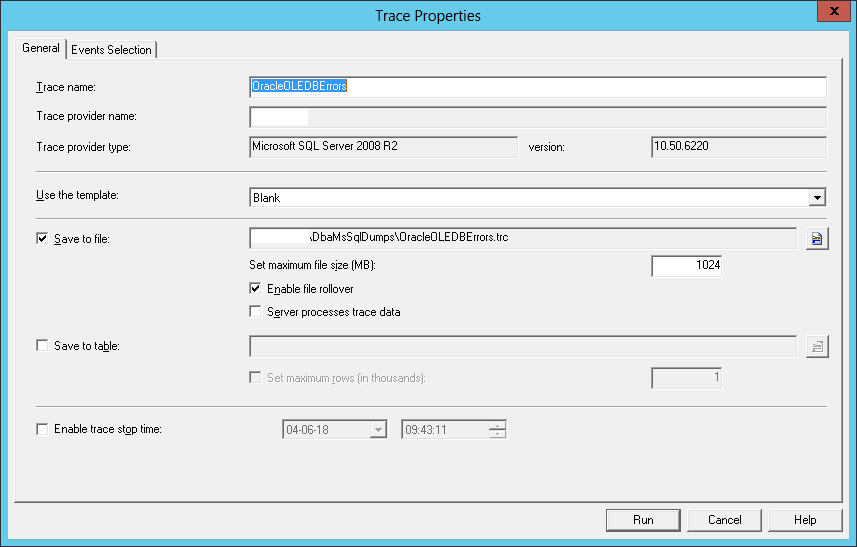
-
Fill in the General tab information as follows:
(Set a name, use Blank template and set save to file option. Eventually set a trace stop time)

- Go to the Event Selection tab
-
Select following events to get a complete overview of user activity:
Event Category Event Name Errors and Warnings Error Log
EventLog
Exception
Execution Warnings
User Error MessagesOLEDB All available events Security Audit Audit Login
Audit LogoutStored Procedures RPC:Completed TSQL SQL:BatchCompleted
SQL:BatchStarting - Eventually and preferably, filter out results so that it traces only what you want. It will help in the results analysis task.
- Click on the “Run” button on the bottom right of the dialog
- Let the profiler run and stop it once you get what you wanted.
If you see any error or return status different from “0” or “0 – OK”, take the time to check them and try to understand what happened.
Here is an example output of the trace:
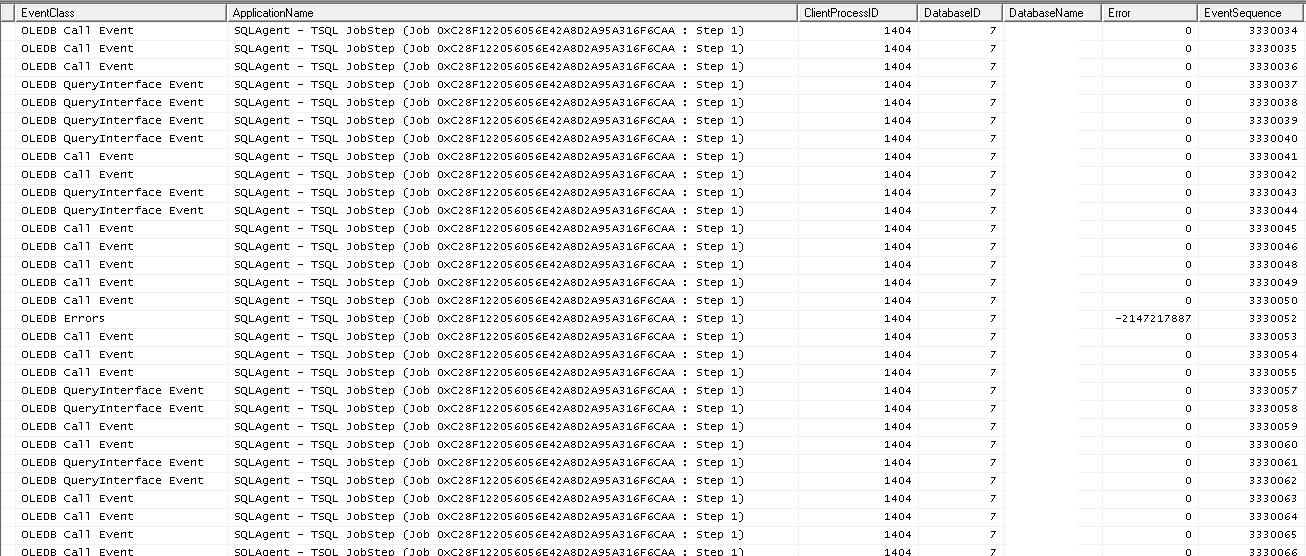
Here, we can see that there is a value in error column different from 0. This error should be investigated.
Using Oracle Database Client tracing capabilities
Oracle Database Client comes with some tracing capabilities. We will review the way to enable and disable them.
First of all, we need to get back following information about the Oracle Database Client installation:
- The version of the installed client
- Installation path so that we can deduct the location of the %ORACLE_HOME% environment variable.
For instance: C:\app\oracle\product\12.2.0
In Windows Explorer, we will go to %ORACLE_HOME%\network folder and create following folders if they don’t exist:
- Log
- Trace
Once it’s done, we can go to the %ORACLE_HOME%\network\admin folder. That’s where the Oracle Client takes its configuration files for network communication.
Take a backup of the file called sqlnet.ora if it actually exists. The backed up file name should be sqlnet.traceON.ora . We will work on this file so that we don’t influence production except when we are really willing to run a trace.
If sqlnet.ora does not exist, create it and add at least following line then copy it to sqlnet.traceON.ora:
|
1 |
SQLNET.AUTHENTICATION_SERVICES = (NTS) |
Now, we are ready to add tracing parameters. Append following content to the sqlnet.traceoON.ora file:
|
1 2 3 4 5 6 7 8 9 10 11 12 13 14 15 16 17 18 |
# /*********************** # * Client-side Tracing: # */ TRACE_LEVEL_CLIENT = 16 TRACE_FILE_CLIENT = sqlnet_client.trc TRACE_DIRECTORY_CLIENT = C:\app\oracle\product\12.2.0\client_1\network\trace TRACE_UNIQUE_CLIENT = ON TRACE_TIMESTAMP_CLIENT = ON LOG_DIRECTORY_CLIENT = C:\app\oracle\product\12.2.0\client_1\network\log LOG_FILE_CLIENT = sqlnet_client.log TNSPING.TRACE_DIRECTORY = C:\app\oracle\product\12.2.0\client_1\network\trace TNSPING.TRACE_LEVEL = ADMIN DIAG_ADR_ENABLED = OFF ADR_BASE = c:\app\oracle |
Save and exit sqlnet.traceON.ora file.
Now, we need a mechanism to set tracing on and off. Let’s write a Powershell script called “Set-OracleClientTrace” that will take 2 parameters:
- $OracleHome: the path in which we will find the “network” folder.
- $TraceStatus: can be ON or OFF.
Here is the code of this script:
|
1 2 3 4 5 6 7 8 9 10 11 12 13 14 15 16 17 18 19 20 21 22 23 24 25 26 27 28 29 30 31 32 33 34 35 36 37 38 39 40 41 42 43 44 45 46 47 48 49 50 51 52 53 54 55 56 57 58 59 60 61 62 63 64 65 66 67 68 69 70 71 72 73 74 75 76 77 78 79 80 |
param ( [cmdletbinding()] [parameter(ValueFromPipeline = $false, ValueFromPipelineByPropertyName = $true, Mandatory = $True)] [ValidateScript({Test-Path $_ -PathType Container})] [string]$OracleHome, [parameter(ValueFromPipeline = $false, ValueFromPipelineByPropertyName = $true, Mandatory = $True)] [ValidateSet("on","off")] [string]$TraceStatus ) #ensure UTF-8 encoding is used for all I/O interfaces $PSDefaultParameterValues = @{ '*:Encoding' = 'utf8' } Write-Output "Setting Oracle Client Tracing features to $TraceStatus" $NetworkBasePath = Join-Path $OracleHome "network" $TnsAdminPath = Join-Path $NetworkBasePath "admin" $SqlNetOraTracing = Join-Path $TnsAdminPath "sqlnet.traceON.ora" if(-Not (Test-Path $NetworkBasePath -PathType Container)) { throw "no network folder found in $OracleHome" } if(-Not (Test-Path $TnsAdminPath -PathType Container)) { throw "No TNS ADMIN folder" } if(-Not (Test-Path $SqlNetOraTracing -PathType Leaf)) { throw "No 'sqlnet.traceON.ora' file with tracing information" } $SqlNetOraFile = Join-Path $TnsAdminPath "sqlnet.ora" $SqlNetOraBkp = "$SqlNetOraFile.bkp" # Create SqlNet.ora if not exists if(-Not (Test-Path $SqlNetOraFile -PathType Leaf)) { Write-Output "Creating sqlnet.ora file" "SQLNET.AUTHENTICATION_SERVICES = (NTS)" | Out-File $SqlNetOraFile } if($TraceStatus -eq "ON") { $TraceLogPath = Join-Path $NetworkBasePath "log" $TraceFilesFolderPath = Join-Path $NetworkBasePath "trace" Write-Output "Creating log and trace folders if needed" New-Item $TraceLogPath -ItemType Directory -Force | Out-Null New-Item $TraceFilesFolderPath -ItemType Directory -Force | Out-Null if(Test-Path $SqlNetOraBkp -PathType Leaf) { # ensure we are not running twice the script with status ON $md5 = New-Object -TypeName System.Security.Cryptography.MD5CryptoServiceProvider $BackedUpFileHash = [System.BitConverter]::ToString($md5.ComputeHash([System.IO.File]::ReadAllBytes($SqlNetOraBkp))) $TraceONFileHash = [System.BitConverter]::ToString($md5.ComputeHash([System.IO.File]::ReadAllBytes($SqlNetOraTracing))) if($BackedUpFileHash -ne $TraceONFileHash) { Write-Output "Removing previous backup file" Remove-Item $SqlNetOraBkp | Out-Null } else { throw "Tracing is already enabled" } } Move-Item $SqlNetOraFile -Destination $SqlNetOraBkp Copy-Item $SqlNetOraTracing -Destination $SqlNetOraFile Write-Output "Tracing is now enabled" } else { if(Test-Path $SqlNetOraBkp -PathType Leaf) { Move-Item $SqlNetOraBkp -Destination $SqlNetOraFile -Force Write-Output "Backed up configuration restored" } else { throw "No configuration file backup found" } } |
In order to get this trace work as expected, we have a few sets of operations to perform:
- Copy both the Powershell script and the sqlnet.traceON.ora files to the appropriate folder on server we want to trace
- Edit the second one according to server installation (basically, changelog and trace destinations)
- Open Powershell and run the Set-OracleClientTrace with TraceStatus to ON
- Restart SQL Server instance
- Perform the test
-
Run Set-OracleClientTrace Powershell script with TraceStatus parameter set to OFF Note:
You might need to run following command:
1Set-ExecutionPolicy ByPass –Scope Process - Restart SQL Server instance
- Analyze trace files contents. To do so, this resource should help.
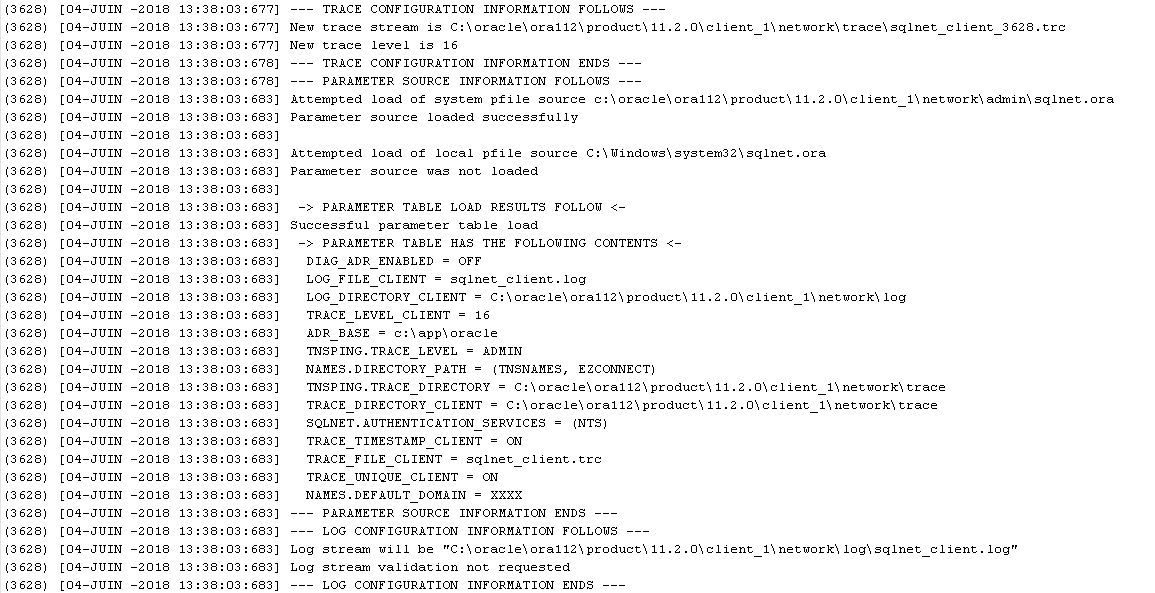
As an example, please, you will find below a sample of a real trace file.
It starts with a summary of trace configuration.
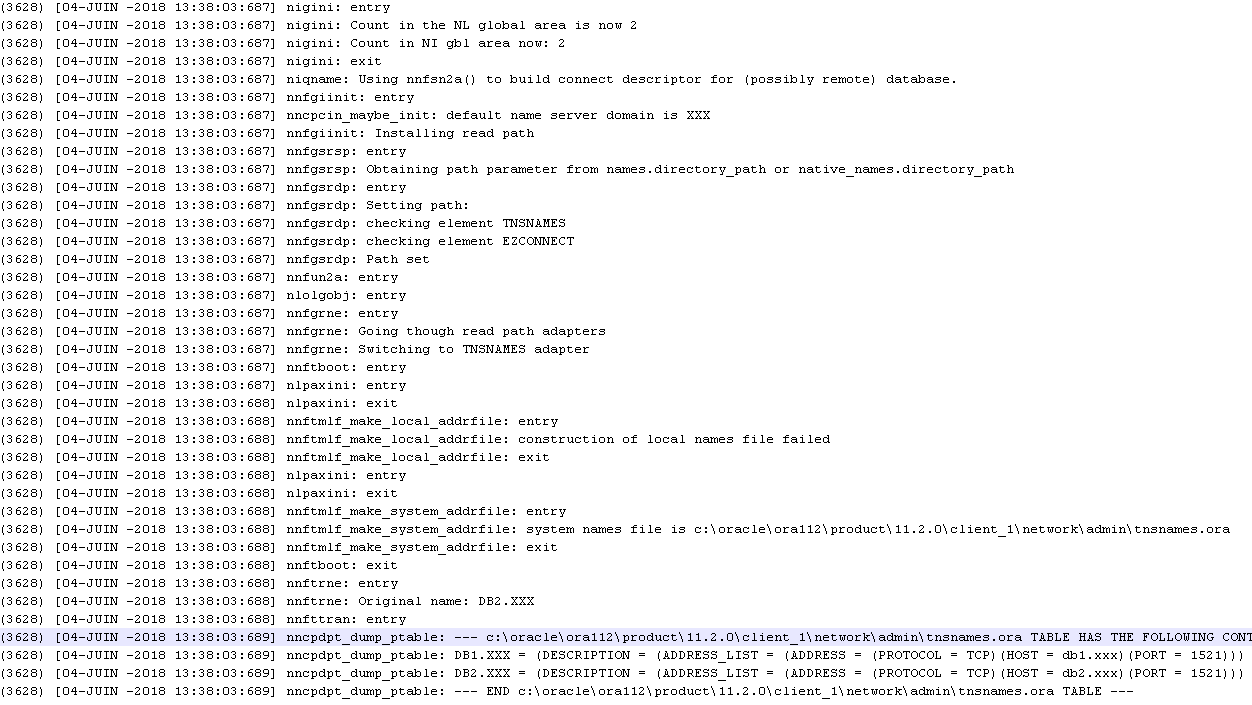
It’s followed by the name resolution for providing for a TNS entry “DB2.XXX”:
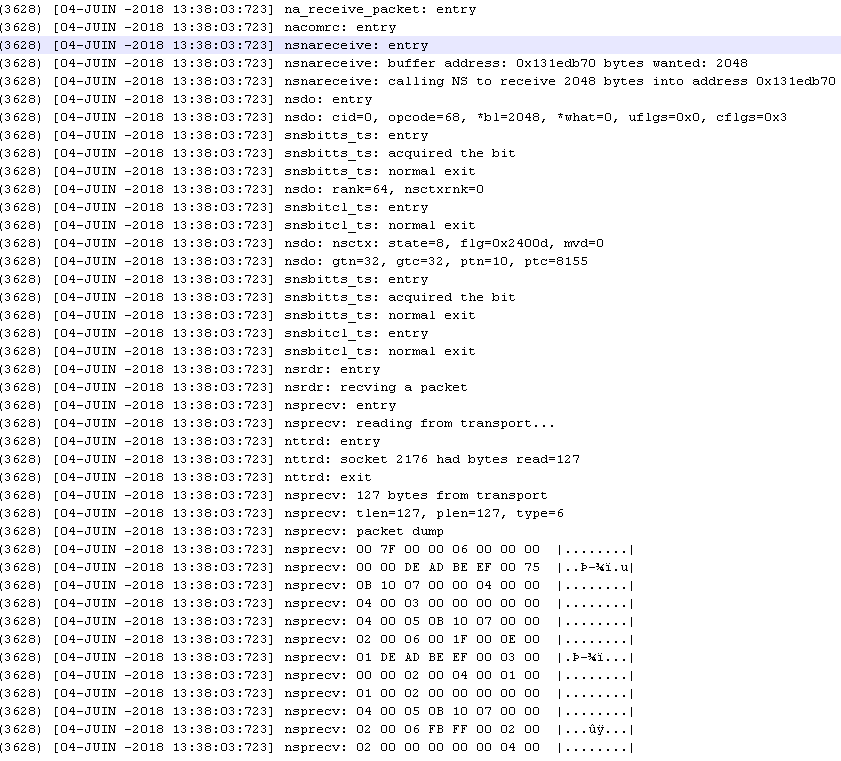
And here is an example of normal communication:
Using OLEDB provider’s tracing capabilities
According to Oracle’s documentation page on OLEDB, there is a way to keep track of all calls to OLEDB interface.
To do so, we need to open regedit.exe and find following registry key:
|
1 |
HKLM\SOFTWARE\ORACLE\KEY_<ORACLE_HOME>\OLEDB |
Here are the attributes that could be modified in order to generate a trace:
| Key Name | Description |
| TraceFileName |
Name of the file that will be used for logging trace information.
NB: if TraceOption parameter is set 1, then the thread identifier will be appended to the value for TraceFileName parameter |
| TraceCategory |
Specifies the information that is to be traced.
Valid Values: 0 = None 1 = OLEDB Interface method entry 2 = OLEDB Interface method exit 4 = Distributed Transaction Enlistment and Delistment We can add the above values between them to combine tracing categories. For instance, a value of 3 means that all the OLEDB interface method entries and exits will be traced. |
| TraceLevel |
Specifies the OLE DB objects to be traced.
This option will provide limits to tracing capabilities by limiting to a single or multiple OLEDB objects, so that the trace will contain only the data necessary to achieve the tracing goal. Valid Values: 0 = None 1 = Data Source object 2 = Session object 4 = Command object 8 = Rowset object 16 = Error object 64 = Multiple Results Object |
| TraceOption |
If this option is set to 0, all traced activity will be stored in a single trace file.
If this option is set to 1 then one file per Thread will be created. |
To get a full trace, we can set registry values as follows:
Note:
- To be sure this will work as expected, create all the directories implied in the value set for TraceFileName. In this case, we should create the OraOLEDBTraces folder under C:\.
As soon as the test is completed, don’t forget to turn off tracing by setting following registry values to 0:
- TraceCategory
- TraceLevel
Unfortunately, I haven’t been able to generate a trace file with this method.
Summary
We’ve seen that there are multiple ways to track communication activity generated by distributed queries. Some of them can be made without server restart, some other can’t.
Nevertheless, I would like to pinpoint that this article did not have the pretention to be exhaustive and list all the existing methods. Feel free to comment this article with your feedback or any other method.
References
- Sqlnet tracing during nightly hours…
- Oracle client trace
- Provider-Specific Information
- Social MSDN: OraOLEDB.Oracle Linked Server
- Error message when you execute a linked server query in SQL Server: “Timeout Expired”
- Emigar Wiki – Oracle client trace

I'm one of the rare guys out there who started to work as a DBA immediately after his graduation. So, I work at the university hospital of Liege since 2011. Initially involved in Oracle Database administration (which are still under my charge), I had the opportunity to learn and manage SQL Server instances in 2013. Since 2013, I've learned a lot about SQL Server in administration and development.
I like the job of DBA because you need to have a general knowledge in every field of IT. That's the reason why I won't stop learning (and share) the products of my learnings.
View all posts by Jefferson Elias
- How to perform a performance test against a SQL Server instance - September 14, 2018
- Concurrency problems – theory and experimentation in SQL Server - July 24, 2018
- How to link two SQL Server instances with Kerberos - July 5, 2018