
An Extended events target is the destination for all of the information that is captured by Extended Events sessions. You can rely on couple of different targets such as event counter, event file, event tracing for Windows (ETW), ring buffer, event pairing, and histogram.
A Histogram target is used to count the number of times a specific event occurs, based on a specified column or action. It provides grouping of a specific event within the event session. We can group data based on data within the event itself or to an action that has been additionally added to the event. Being relatively lightweight it can be used for a gathering information over a large time period, the same cannot be said for most of the other extended event targets.
The histogram is an asynchronous target which means that the collected data is stored within the memory buffer first and then transferred to the target. It is possible that events are not transferred immediately and there is a delay caused from the buffer flushes. The captured information is lost upon SQL Server restart.
We will cover the creation of an extended event session, the configuration possibilities of a histogram target, and extracting the collected data with TSQL.
Let us start by creating an extended events session that will capture information for SQLOS waits. This event occurs when there is a wait on a SQLOS controlled resource. The configured action is capturing the database_id in addition.
|
1 2 3 4 5 6 |
CREATE EVENT SESSION [XE_collect_wait_stats_db] ON SERVER ADD EVENT sqlos.wait_info( ACTION(sqlserver.database_id)) GO |
So far, the collected data is stored only within the memory buffer. We can access it using the ‘Watch live data’ option from the SQL Server management studio. The collected data consists of events each representing a single SQLOS wait.

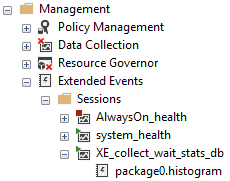
Next, we will create a histogram target for the session:
|
1 2 3 4 5 |
ALTER EVENT SESSION [XE_collect_wait_stats_db] ON SERVER ADD TARGET package0.histogram(SET slots = 64, filtering_event_name=N'sqlos.wait_info',source=N'sqlserver.database_id',source_type=(1)) GO |
The histogram target has four configuration options. Although none of them are mandatory, without them we have almost no control over the collected data.
slots – a user defined value indicating the maximum number of groupings. When the limit is reached, new events that do not belong to any of the already existing groupings will be ignored. The default value is 256 and for performance reasons the slot number is rounded up to the next power of 2;
filtering_event_name – a user-specified value that is used to identify a class of events for the histogram, all other events are ignored;
source – the name of the event column or action name used as data source;
source_type – indicates the type of object that the bucker is based on, 0 when source is event, 1 when source is action. The default value is 1.
The data that we have collected so far within the histogram target is as follows:
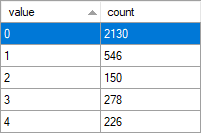
The histogram target has five buckets created at the moment (or slots). More buckets will be created if they are required until the limit of 64 is reached (slots = 64). After the limit is reached, if new information is captured and it does not belong to any of the existing buckets, it will be discarded.
The column value is showing data grouped by the database_id (we are running only with the four system databases, the value 0 indicates a wait_info event that is not related to a specific database).
The column count is representing the number of wait_info events that were generated and captured by our session for each of the specified database_id buckets.
Let us go the other way around and create a histogram target with source type based on an event.
This way we can choose to show the information collected by the wait_info events not grouped by the database_id but based on the wait type information.
First, we need to drop the existing histogram target, we are limited to only one histogram target for an extended event session. The same is applicable for the other extended events targets as well.
|
1 2 3 4 |
ALTER EVENT SESSION [XE_collect_wait_stats_db] ON SERVER DROP TARGET package0.histogram |
Then, we can add a new histogram target. Note that the source_type is now set to 0, this is because we using event as a source, and the event is wait_info.
|
1 2 3 4 |
ALTER EVENT SESSION [XE_collect_wait_stats_db] ON SERVER ADD TARGET package0.histogram(SET slots = 64, filtering_event_name=N'sqlos.wait_info', source=N'wait_type',source_type=(0)) |
The data collected within the new histogram target is as follows:
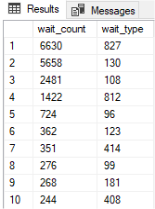
The rows are again our buckets (or slots), the column wait_type, is showing data grouped by the type of the wait we have recorded. The column wait_count is of course counting how much wait_info events were generated with the specific wait_type.
The data that we have captured with the new histogram is quite valuable but it is again hard to read as we need to find the wait type corresponding to each of the gather number codes. The data is also stored only in memory and will not be saved upon SQL Server reboot.
Let us review how we can query the histogram target and present the collected data in a more readable way.
Of course, we can find the histogram outcome from the SQL Server management studio and view it within the GUI, but if we need to store this or access it with TSQL it is not quite usable.
Instead, we will extract the target data from within the SQL Server. The collected data for all extended event on our server can be found within the view sys.dm_xe_session_targets. We can locate our specific histogram target by limiting the results:
|
1 2 3 4 5 6 7 |
SELECT name, target_name, CAST(xet.target_data AS xml) as XML_data FROM sys.dm_xe_session_targets AS xet JOIN sys.dm_xe_sessions AS xe ON (xe.address = xet.event_session_address) WHERE xe.name = 'XE_collect_wait_stats_db' --We have specified the session name |
The specific histogram we needed:

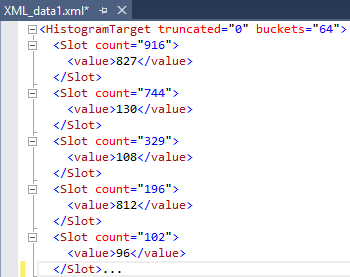
Opening the XML, we can see that schema is relatively simple, although there is not a standard for how the xml schema is build the following illustrates it:
<Slots truncated = “0” buckets=[count]>
<Slot count=[count] truncated=[truncated bytes]>
<value>
</value>
</Slot>
</Slots>
The results from our histogram:
The next step will be to limit to only the XML data in order to parse it to a standard table:
|
1 2 3 4 5 6 7 8 |
SELECT CAST(xet.target_data AS xml) as XML_data FROM sys.dm_xe_session_targets AS xet JOIN sys.dm_xe_sessions AS xe ON (xe.address = xet.event_session_address) WHERE xe.name = 'XE_collect_wait_stats_db' --We have specified the session name AND target_name= 'histogram' --We have specified the target type (in case there are >1) |
Once done, we can now parse the XML to a standard table:
|
1 2 3 4 5 6 7 8 9 10 11 12 13 14 |
SELECT xed.XML_data.value('(value)[1]', 'varchar(256)') AS wait_type, xed.XML_data.value('(@count)[1]', 'varchar(256)') AS wait_count FROM ( SELECT CAST(xet.target_data AS xml) as XML_data FROM sys.dm_xe_session_targets AS xet JOIN sys.dm_xe_sessions AS xe ON (xe.address = xet.event_session_address) WHERE xe.name = 'XE_collect_wait_stats_db' --We have specified the session name AND target_name= 'histogram' --We have specified the target type (in case there are >1) ) as t CROSS APPLY t.XML_data.nodes('//HistogramTarget/Slot') AS xed (XML_data) |
The results are as follows, the same we can see from the SQL Server management studio:
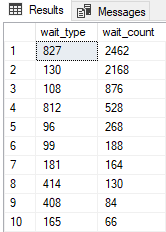
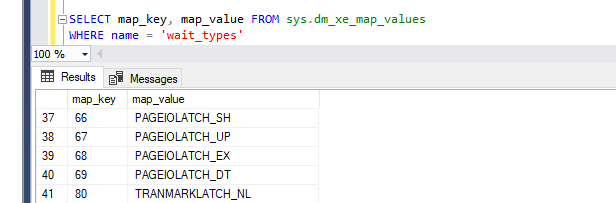
To make the results more readable we will use the data stored in to sys.dm_xe_map_values that is relating the map_key to the specific wait:

Combining dm_xe_map_values and our outcome:
|
1 2 3 4 5 6 7 8 9 10 11 12 13 14 15 16 17 18 19 20 21 22 |
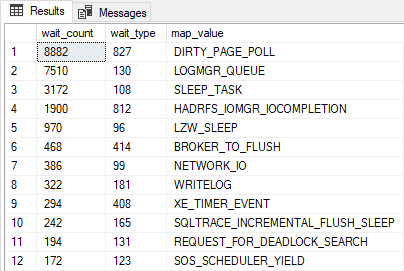
SELECT xm.wait_count ,xm.wait_type ,mv.map_value FROM ( SELECT xed.XML_data.value('(value)[1]', 'varchar(256)') AS wait_type, xed.XML_data.value('(@count)[1]', 'varchar(256)') AS wait_count FROM ( SELECT CAST(xet.target_data AS xml) as XML_data FROM sys.dm_xe_session_targets AS xet JOIN sys.dm_xe_sessions AS xe ON (xe.address = xet.event_session_address) WHERE xe.name = 'XE_collect_wait_stats_db' --We have specified the session name AND target_name= 'histogram' --We have specified the target type (in case there are >1) ) as t CROSS APPLY t.XML_data.nodes('//HistogramTarget/Slot') AS xed (XML_data)) xm JOIN sys.dm_xe_map_values as mv ON xm.wait_type = mv.map_key WHERE mv.name='wait_types' |
And the final result is as follows, now the outcome is both readable and accessible via TSQL from a standard table!
The next article in this series

View all posts by Kaloyan Kosev
- Performance tuning for Azure SQL Databases - July 21, 2017
- Deep dive into SQL Server Extended events – The Event Pairing target - May 30, 2017
- Deep dive into the Extended Events – Histogram target - May 24, 2017