
As developers of business intelligence solutions, we tend to service different types of business users. Whilst a call center supervisor is more likely to consume reports that offer detailed breakdown of day-to-day performance of her call center agents, senior managers on the other hand often prefer big-picture analytical reports that represent data in a form of colorful graphs and charts. Not surprisingly, such reports often make use of heatmap controls to provide visually effective comparative view of business metrics against set targets.
Within the Microsoft reporting ecosystem, Power BI and Excel easily support the implementation of heatmaps yet the same cannot be said of SQL Server Reporting Services (SSRS). I was recently involved in a project that necessitated the conversion of Excel reports into SSRS. Some of these Excel reports made use of heatmaps and we were thus expected to replicate such feature in SSRS. In this article, I will take you through some of the options available for generating heatmaps in an SSRS report.
Generating Heatmaps in Excel
Perhaps before we begin exploring available options for generating heatmaps in SSRS, one should first demonstrate the ease at which heatmaps can be created in Excel. Suppose we are tasked with using dataset from Table 1 to generate a heatmap for visually differentiating between clubs that had the best goal difference against those that had the worst in the 2017/2018 season of the UEFA champions league.
| Club | Goals conceded | Goals scored | Goal Difference |
| Anderlecht | 17 | 2 | -15 |
| AS Monaco FC | 14 | 6 | -8 |
| Bayern München | 12 | 26 | 14 |
| Besiktas JK | 13 | 12 | -1 |
| Borussia Dortmund | 13 | 7 | -6 |
| Celtic FC | 18 | 5 | -13 |
| Club Brugge | 5 | 3 | -2 |
| FC Barcelona | 6 | 17 | 11 |
| FC Basel | 10 | 13 | 3 |
| FC Spartak Moskva | 13 | 9 | -4 |
| Juventus | 12 | 14 | 2 |
| Liverpool FC | 16 | 41 | 25 |
| Manchester City | 12 | 20 | 8 |
| RB Leipzig | 9 | 10 | 1 |
| Real Madrid | 16 | 33 | 17 |
| Sevilla | 15 | 15 | 0 |
| Tottenham Hotspur | 8 | 18 | 10 |
Table 1
Assuming that we have loaded Table 1 into an Excel worksheet, all we would need to do in order to generate our heatmap would be the following:
- Highlight the [Goal Difference] column,
- Navigate to and click Conditional Formatting option,
- Select Color Scales from the drop-down menu and finally,
- Select and apply the color scale template, as illustrated in Figure 1.
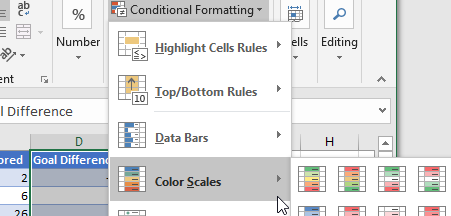
Figure 1
Having applied our color scale template, we will immediately notice that a heatmap has been created against [Goal Difference] column as shown in Figure 2.
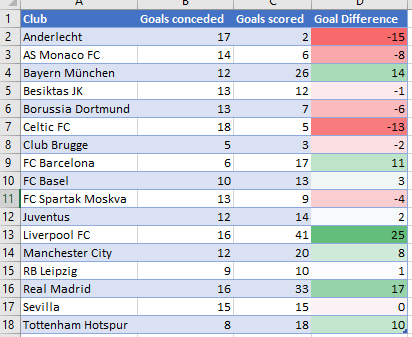
Figure 2
Option #1: Generate SSRS Heatmap using SWITCH Expression
Unlike in Excel, SSRS does not have a color scale object that we can readily select and use in our heatmaps. This means that a lot of what is readily available at a click of a drop-down button in Excel needs to be manually built in SSRS.
- Step 1: Define a color scale
In order to successfully generate heatmaps in SSRS using the SWITCH expression, we must first define a list of colors that our SWITCH expression statement will choose from. There are several websites that can help you build your color scale – I built my color scale using the color picker utility from w3schools.com. At the end of playing with different color combinations, I ended up with a Red to White to Green color scale as shown in Table 2.
#FF0000 #FF5454 #F9DED5 #FFFFFF #D9E1F2 #78FE78 #00B050 Set of Reddish Colours White Set of Greenish Colours Table 2
- Step 2: Define your SWITCH Statement
The number of conditions you are going to define in your SWITCH statement depends on the type of scale you have defined. In my case, I have a 3-part color scale with the following main conditions:
- Whenever a [Goal Difference] Value is Negative then assign one of the Reddish colors
- Whenever a [Goal Difference] Value is Positive then assign one of the Greenish colors
- Whenever a [Goal Difference] Value is Neutral then assign white color
Once we have defined our conditions and we have imported Table 1 into an SSRS dataset, then we are ready to write our SWITCH expression as shown in Script 1.
1=SWITCH(Fields!Goal_Difference.Value = 0, "#FCF9F9",Fields!Goal_Difference.Value < 0 AND ROUND((Fields!Goal_Difference.Value/MIN(Fields!Goal_Difference.Value, "DataSet3"))*100,0) > 69, "#FF0000",Fields!Goal_Difference.Value < 0 AND ROUND((Fields!Goal_Difference.Value/MIN(Fields!Goal_Difference.Value, "DataSet3"))*100,0) > 39, "#FF5454",Fields!Goal_Difference.Value < 0 AND ROUND((Fields!Goal_Difference.Value/MIN(Fields!Goal_Difference.Value, "DataSet3"))*100,0) > 0, "#F9DED5",Fields!Goal_Difference.Value > 0 AND ROUND((Fields!Goal_Difference.Value/MAX(Fields!Goal_Difference.Value, "DataSet2"))*100,0) > 69, "#00B050",Fields!Goal_Difference.Value > 0 AND ROUND((Fields!Goal_Difference.Value/MAX(Fields!Goal_Difference.Value, "DataSet2"))*100,0) > 39, "#78FE78",Fields!Goal_Difference.Value > 0 AND ROUND((Fields!Goal_Difference.Value/MAX(Fields!Goal_Difference.Value, "DataSet2"))*100,0) > 0, "#D9E1F2")Script 1
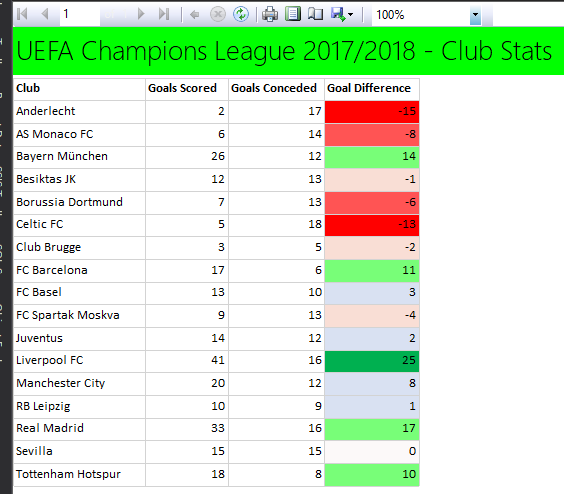
The next time you preview your SSRS report, you will notice that indeed a heatmap has been generated across the [Goal Difference] field as shown in Figure 3.

Figure 3
Option #2: Generate SSRS Heatmap using Custom Code
The biggest drawback with generating heatmaps using the SWITCH expression is that each color condition has its own SWITCH statement and that the color scale must be predefined. In our example above, we assigned three possible range of colors for every negative or positive goal difference values. Ideally, the range of colors in a color scale should not be predefined instead it should be dynamically assigned based on MAX and MIN values in a given dataset. In order to make your color scale dynamic, you need to create some sort of mathematical algorithm that will generate a list of background colors based on input parameters and the SSRS SWITCH expression is incapable of such a functionality.
Luckily, SSRS does support the execution of custom code written in programming languages such as Visual Basic.NET (VB.NET). If you are going to write custom code for SSRS, I would recommend that you do your programming outside of SSDT/BIDS in an IDE that offers IntelliSense-like features.
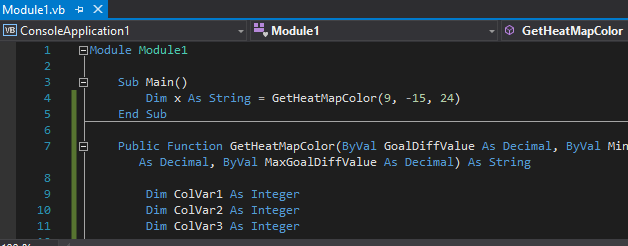
- Step 1: Create VB.NET function
I wrote my VB.NET function using Visual Studio 2015 Community edition. Figure 4 shows a preview of VB.NET function which is really just a variation of the original code written by Jason Thomas in here.
Figure 4
The VB.NET function script for my console application is available under the Downloads section at the bottom of this article but it basically returns a hex color code based on three arguments:
- GoalDiffValue – representing individual goal difference value
- MinGoalDiffValue – representing minimum goal negative difference value
- MaxGoalDiffValue – for maximum positive goal difference value
Similarly, to the SWITCH expression option, my VB.NET function assigns the white background color whenever a goal difference is zero.
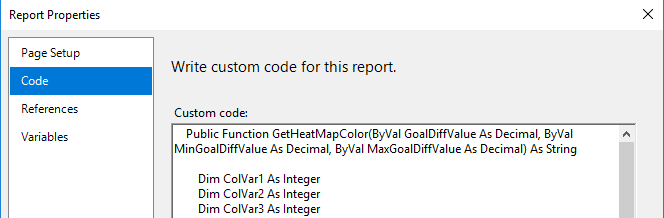
- Step 2: Embed VB.NET function into SSRS Report
After having successfully tested our VB.NET function, we next insert it into SSRS report within the Code window as shown in Figure 5.
Figure 5
Finally, we get to generate our heatmap by writing a background color expression for our [Goal Difference] field that references the VB.NET function in our custom code. The syntax for such an expression is as follows:
1=Code.GetHeatMapColor(Fields!Goal_Difference.Value, MIN(Fields!Goal_Difference.Value, "DataSet3"), MAX(Fields!Goal_Difference.Value, "DataSet2"))
Option #3: Generate SSRS Heatmap using External Assembly File
The custom code option for generating heatmaps in SSRS is certainly an improvement to using the SSRS SWITCH conditional expression. Yet, it still has drawbacks of its own, including the following:
- Custom code in SSRS can only be written in Visual Basic.NET
- The custom code is embedded into the RDL file thus making code-maintenance and reusability inconvenient
Another option for generating heatmaps involves adopting a loosely coupled approach between your RDL file and custom code:
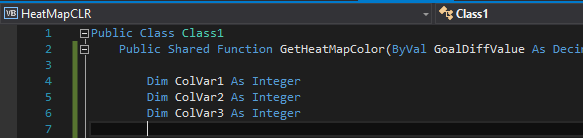
- Step 1: Create Class Library solution
Because we already have a working VB.NET function created in Option #2, all we need to do in this step is simply create a new class library project (in VB.NET or C#) and copy and paste the VB.NET GetHeatMapColor function code inside the main public class as shown in Figure 6.
Figure 6
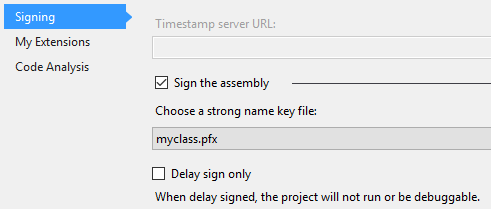
- Step 2: Make Assembly Trusted
External assembly files are generally untrusted by other applications – including SSRS. Thus, we need to ensure that our class library solution generates a trusted DLL file. To get our assembly trusted, we begin by signing the class library solution using a strong name key file as indicated in Figure 7.
Figure 7
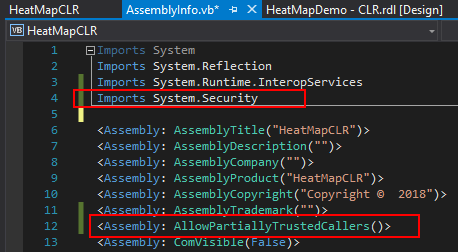
We next edit the AssemblyInfo.vb file by adding the two lines highlighted in Figure 8.
Figure 8
Finally, we generate our assembly DLL file by building our class library solution.
- Step 3: Register assembly into GAC
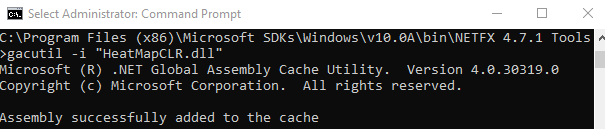
For SSRS to recognize our newly created assembly file, that file would have to be registered into GAC. For the purposes of this demo, I have registered my HeatMapCLR.dll file using the GACUTIL program as shown in Figure 9.
Figure 9
- Step 4: Register assembly into GAC
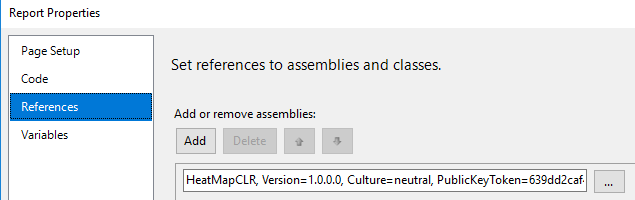
Having successfully created and registered our heatmap assembly file, we next add a reference to it from our SSRS report as shown in Figure 10.
Figure 10
Finally, at this point, we should be ready to generate our heatmap by calling the assembly-based GetHeatMapColor method in our background color expression using the following syntax:
1=HeatMapCLR.Class1.GetHeatMapColor(Fields!Goal_Difference.Value, MIN(Fields!Goal_Difference.Value, "DataSet3"), MAX(Fields!Goal_Difference.Value, "DataSet2"))

Downloads

Sifiso's LinkedIn profile
View all posts by Sifiso W. Ndlovu