
In the SQL Server query execution plans – Basics, we described the query execution plans in SQL Server and why they are important for performance analysis. In this article, we will focus on the methods for opening the plans, both actual and estimated ones
If you look at the Query item in the SQL Server Management Studio menu, you’ll see two options related to query plans – Display Estimated Execution plan and Include Actual Execution plan
An estimated execution plan is a SQL Server query plan that is generated without actually running the query (or stored procedure) the plan is created for. It’s based on estimation of expected behavior. It’s useful for analyzing how a query would behave, without actually running it. This is very useful for testing purposes in environments where performance should not be affected by running actual code (e.g. running a SELECT statement with complex joins against huge tables), or when running code is not possible due to data changes it makes (e.g. executing an UPDATE). Its downside is that it might be inaccurate in some scenarios
An actual execution plan is the SQL Server query plan that is generated after a query was executed. It’s more reliable, as it’s based on the actual execution, not estimates. It also provides more information and statistics, therefore it’s much useful in troubleshooting
There are several methods available for viewing a query plan in SQL Server
View Actual execution plan using ApexSQL Plan
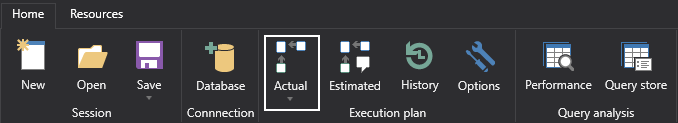
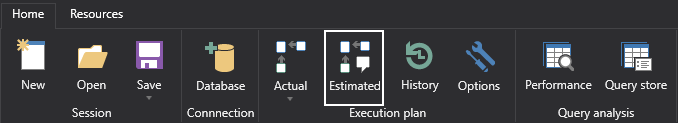
The Actual execution plan option is available in the in the Home tab of ApexSQL Plan
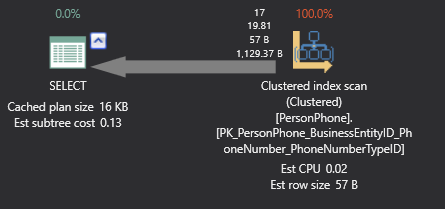
- Open the Query in ApexSQL Plan
- Select the Actual execution plan option
|
1 2 3 |
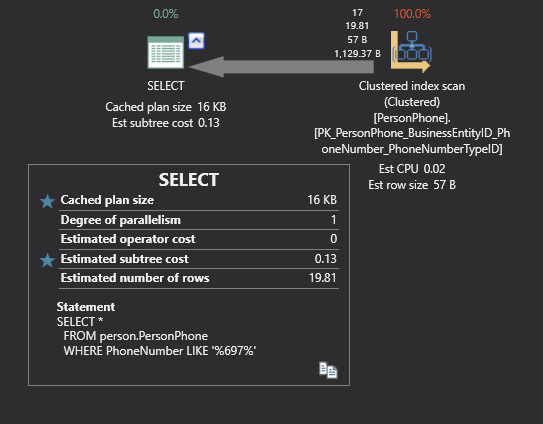
SELECT * FROM person.PersonPhone WHERE PhoneNumber LIKE '%697%' |
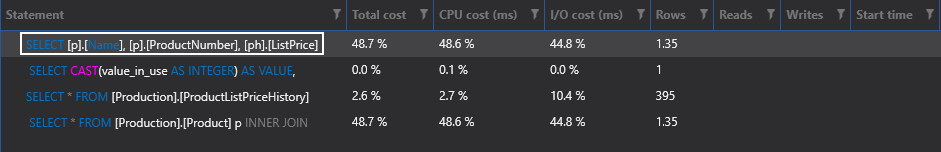
If multiple SQL queries are executed, their plans will be listed in the same tab, one below another separated as statements.
Each item in the query plan shows a tooltip with additional information
SQL Server execution plans can be saved as SQL or sqlplan files for later analysis.
The steps are similar for using the Estimated execution Plan option, except the query doesn’t have to be executed.
SQL Server query plans can also be shown in Query Editor using some of the following options:
View Estimated execution plan using ApexSQL Plan
The Estimated execution plan option is also available in the in the Home ribbon bar of ApexSQL Plan
- Open the Query in ApexSQL Plan
- Select the Estimated execution plan option
SHOWPLAN_XML
The SHOWPLAN option in SQL Server Management Studio has to be set using T-SQL and it shows the estimated execution plan. This is the same plan as shown when the Estimated Execution Plan option is selected, when the query is not actually executed
-
Execute
1SET SHOWPLAN_XML ONNote that this is the only statement in the batch that can be executed
-
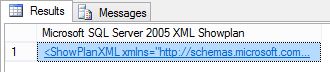
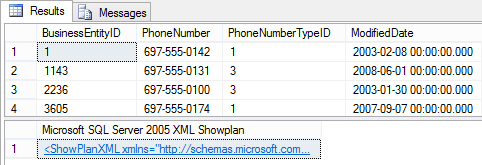
Execute a query. The Results tab will show a link to the query plan. Note that the query results are not shown, as the query is not really executed

-
Click the link is the grid
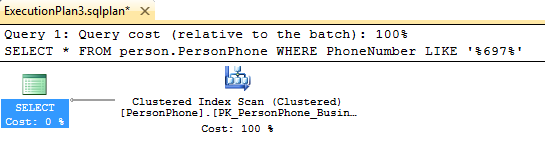
A new query tab will be opened showing the query plan
-
To stop the query plan from showing, run
1SET SHOWPLAN_XML OFF
Use the query cache
As mentioned in the SQL Server query execution plans – Basics article, query plans in SQL Server are saved in the query plan cache, so they can be reused later in order to execute queries faster. One of the options to see query plans is to query the content of the plan cache using Dynamic Management Views (DMVs)
The sys.dm_exec_cached_plans view shows one row for every query plan stored in the plan cache. The view shows query text, memory used, and how many times the plan was reused
The sys.dm_exec_sql_text view shows the SQL batch text, identified by sql_handle
To see the plans for ad hoc queries cached in the plan cache:
|
1 2 3 4 5 6 7 8 9 10 |
SELECT qp.query_plan, CP.usecounts, cp.cacheobjtype, cp.size_in_bytes, cp.usecounts, SQLText.text FROM sys.dm_exec_cached_plans AS CP CROSS APPLY sys.dm_exec_sql_text( plan_handle)AS SQLText CROSS APPLY sys.dm_exec_query_plan( plan_handle)AS QP WHERE objtype = 'Adhoc' and cp.cacheobjtype = 'Compiled Plan' |

To open a plan, click the link in the query_plan results column and the plan will be shown in the new Query window
Use the STATISTICS and SHOWPLAN options
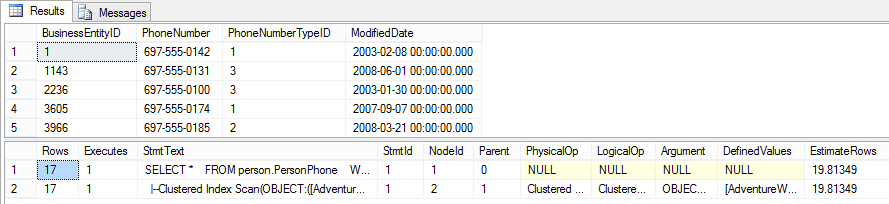
The STATISTICS XML option shows the same query plan as shown when the Include Actual Execution Plan option is selected. Unlike with the SHOWPLAN options that don’t actually execute the queries, the STATISTICS options execute it and show the results
|
1 |
SET STATISTICS XML ON |
Note that besides the link to the query plan, the query results are also shown
To turn the option off, execute:
|
1 |
SET STATISTICS XML OFF |
Other useful options are:
SHOWPLAN_XML – doesn’t execute the query, so no results are shown. Shows the link the same as the STATISTICS XML option
SHOWPLAN_TEXT – doesn’t execute the query, shows the text of the estimated query plan
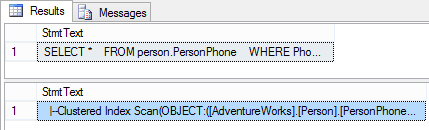
SHOWPLAN_ALL – doesn’t execute the query, shows the text of the estimated query plan along with the cost estimation

STATISTICS PROFILE – executes the query, shows the results and text of the actual query plan
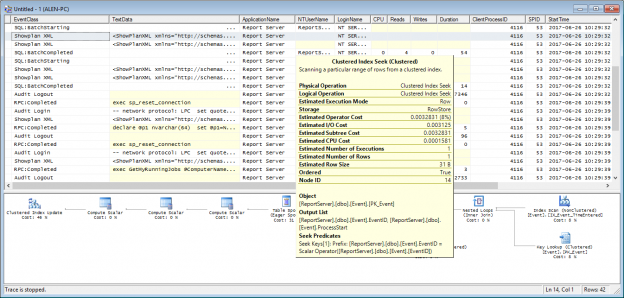
Use SQL Server Profiler
A query execution plan can also be captured in a SQL Server trace and opened in SQL Server Profiler
- Start SQL Server Profiler
- In the File menu, select New Trace
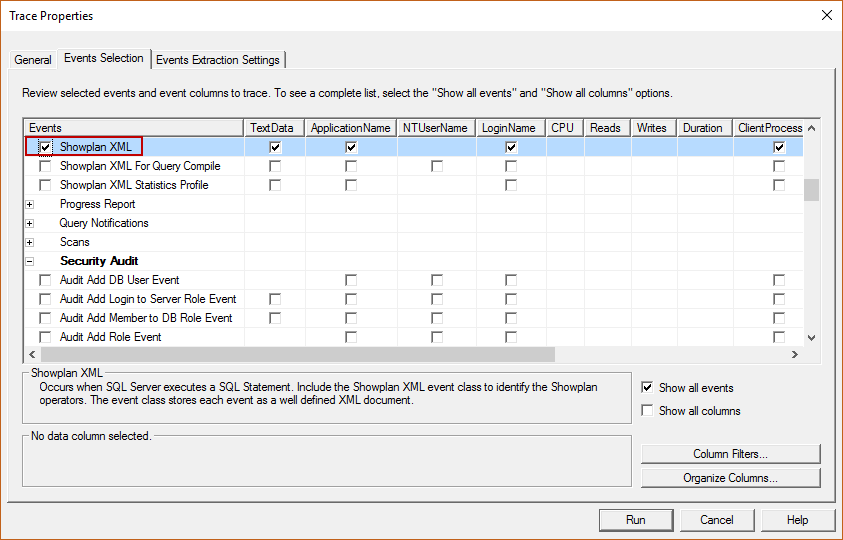
- In the Events Section tab, check Show all events
- Expand the Performance node
-
Select Showplan XML
- Execute the query you want to see the query plan for
- Stop the trace. This is recommended due to practical reasons – in busy databases, it’s difficult to filter by the event you want to trace
-
Select the query plan in the grid
The SQL Server query plan is shown in the lower pane. It’s the same plan as shown when the Include Actual Execution Plan option is selected. You can see its details in the tooltip that appears on mouse over or save the whole trace as an XML file for later analysis
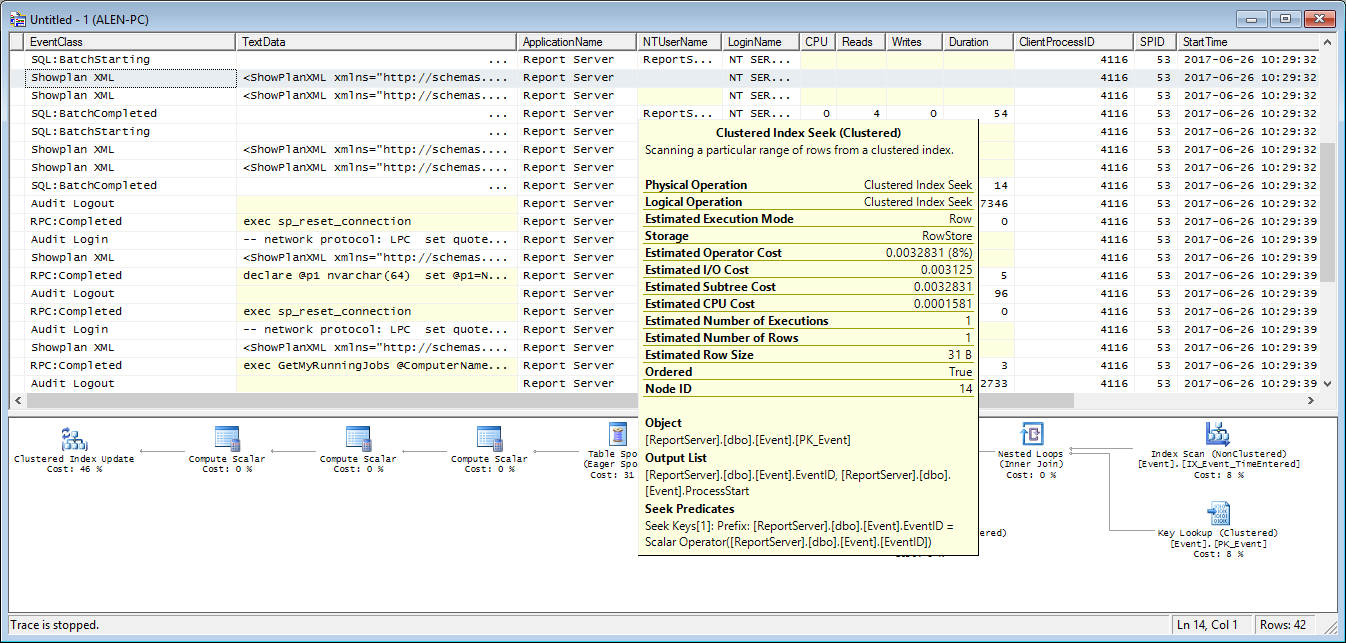
This method is not recommended due to several downsides. SQL Server Profiler adds some overhead that affects query performance. Another reason is that filtering the events and finding the specific one among thousands of records in not easy in SQL Server Profiler
In this article, we showed how to open a SQL Server query execution plan using various methods. In the next article, we will show how to read the plans, what the objects presented with icons represent, and how to use these plans in performance analysis and troubleshooting

She has been working with SQL Server since 2005 and has experience with SQL 2000 through SQL 2014.
Her favorite SQL Server topics are SQL Server disaster recovery, auditing, and performance monitoring.
View all posts by Milena "Millie" Petrovic
- Using custom reports to improve performance reporting in SQL Server 2014 – running and modifying the reports - September 12, 2014
- Using custom reports to improve performance reporting in SQL Server 2014 – the basics - September 8, 2014
- Performance Dashboard Reports in SQL Server 2014 - July 29, 2014