

This article aims to provide the basics of creating Logistic Regression in Azure ML by designing a simple model step-by-step.
Predicting whether or not a customer is eligible for a loan is a very important problem for banks and other financial institutes. Ideally, a loan should only be approved for those customers who are likely to pay the money back, and should not be approved for the customers that are likely to default.
Fortunately, if we have sufficient data, we can use statistical algorithms to develop a model that can successfully predict whether a loan should be approved for the customers or not. One such algorithm is the logistic regression algorithm. In this article, we will see how to create a logistic regression in Azure ML Studio that can predict customer’s loan eligibility.
The Dataset
The dataset for this problem can be downloaded freely from this Kaggle Link. The data will be downloaded in a compressed file. If you extract the compressed file, you will see two files: “train_u6lujuX_CVtuZ9i.csv” and “test_Y3wMUE5_7gLdaTN.csv”. We will be working with the “train_u6lujuX_CVtuZ9i.csv” file. You can simply rename it to “train_loan.csv”.
The next step is to upload the file to the Azure ML Studio. Login to Azure ML Studio account and go to this link: https://studio.azureml.net/Home/.
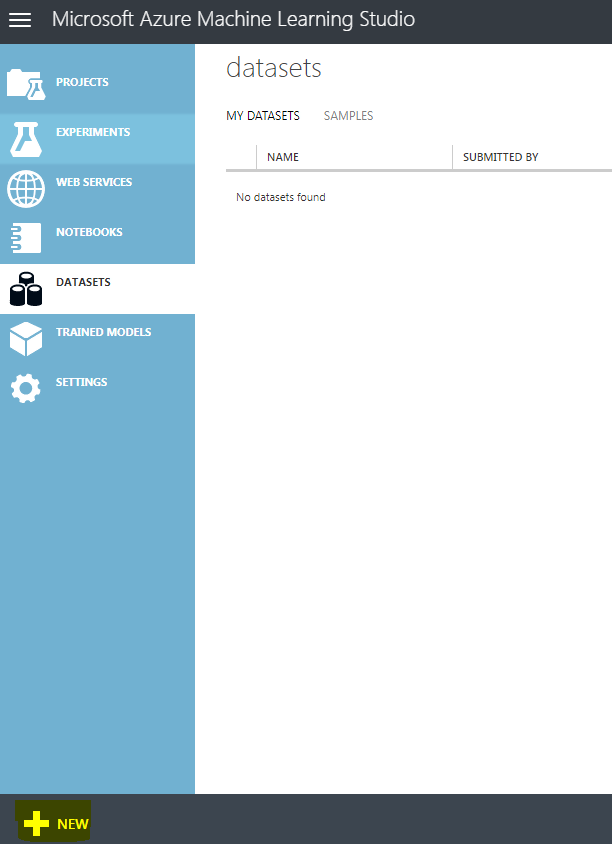
To upload the dataset, click on the “DATASETS” option from the menu on the left and then click the “+NEW” button at the bottom right of the screen as shown below:
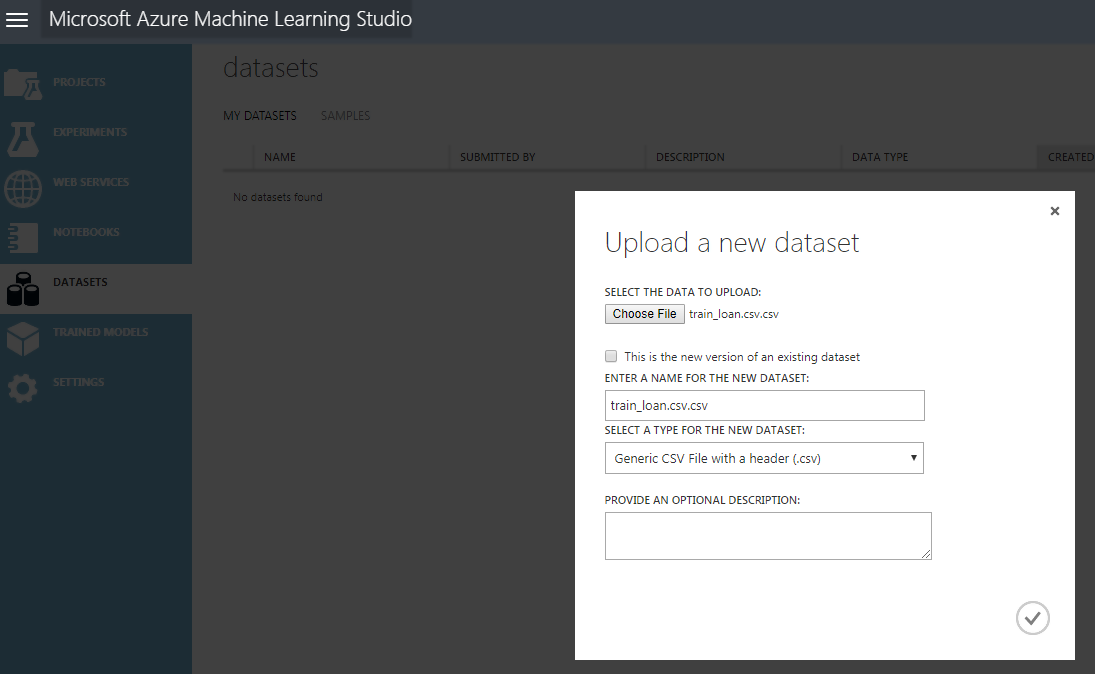
You will see a file upload dialogue box. Click the “FROM LOCAL FILE” and then “Choose File” option to upload a file from your drive. In my case, I renamed the file “train_u6lujuX_CVtuZ9i.csv” to “train_loan.csv” and uploaded it. Look at the following screenshot for reference:
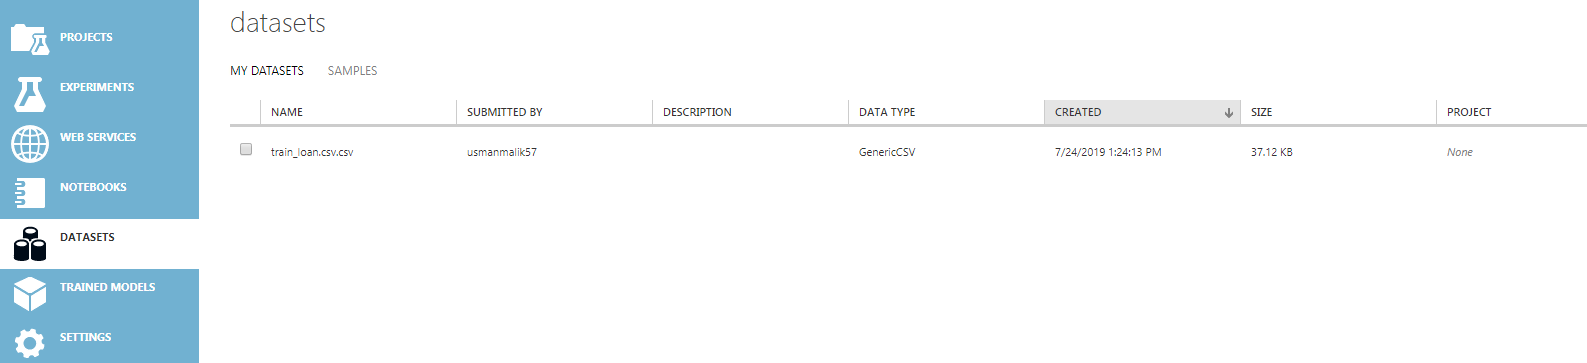
Wait a few seconds for the dataset to upload. Once the dataset is uploaded, you should see the uploaded dataset in the list of datasets as shown below:
Creating a Simple Prediction Model for Loan Eligibility Prediction
In this section, we will create a simple logistic regression in the Azure ML model that will be trained using the dataset that we uploaded in the previous section and will be used to make predictions about whether a bank should award a loan to a customer or not.
Follow these steps:
Creating a New Experiment
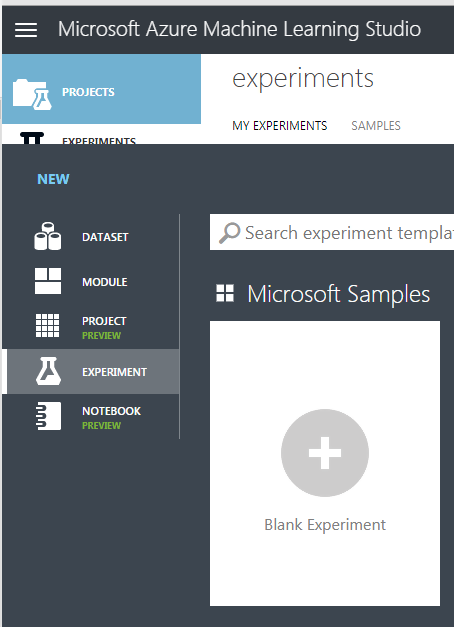
To create a new experiment the “EXPERIMENTS” option from the Azure ML Studio dashboard. You will be presented with different types of options. Select “Blank Experiment” as shown below:
You will be presented with a new experiment dashboard.
Adding a Dataset to the Experiment
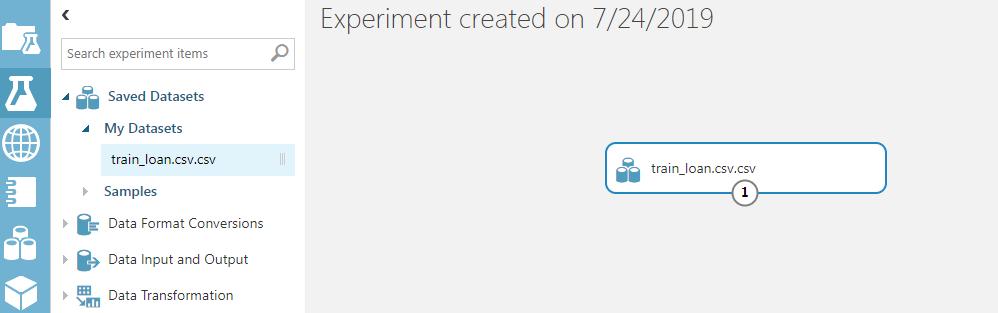
The first step to creating a logistic regression in Azure ML is to add the dataset to the experiment dashboard. We will add the “train_loan.csv” dataset to the experiment. To do so, click on “Saved Datasets -> My Datasets” and then drag the “train_loan.csv” file to the experiment dashboard. Look at the following screenshot for reference.
Visualizing the Data
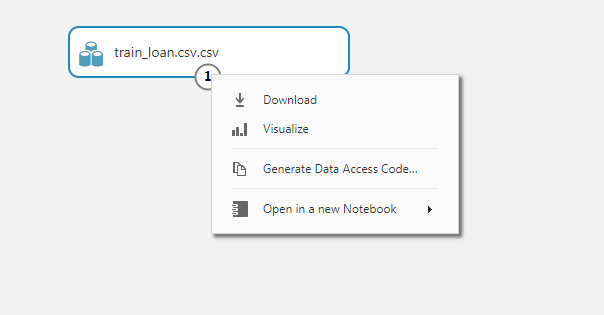
Let’s visualize our dataset. Right-click on the circle node containing digit 1 from the dataset module. From the drop-down list, select “Visualize” as shown below:
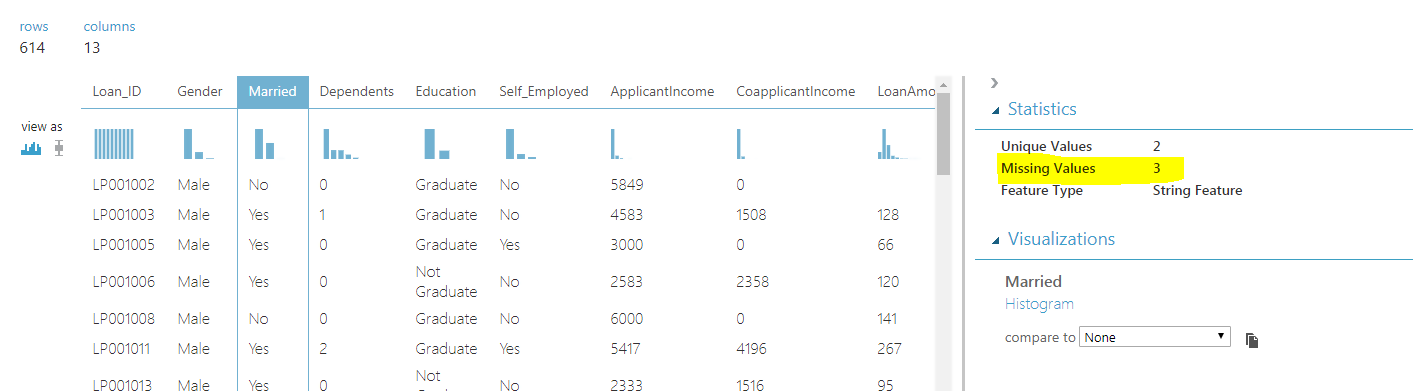
If you visualize the dataset, you will see that the data has 614 rows and 13 columns. The last column is the “Loan_Status” column. As I earlier said, this is a supervised learning problem, therefore in the training data we already have the true or real outputs. Our model will learn how to predict whether a customer is eligible for the loan or not using the data in the first 12 columns.
Handling Missing Values
Before we can learn from the data or in other words, train our model on the data, we have to handle the missing values. To check the missing values in each column, simply click the column header. For instance, if you click the column “Married”, you will see that 3 values are missing as shown below:
If you visualize all the columns for missing values, you will see that among categorical columns, Gender, Married, Dependents, Self_Employed, and Credit_History columns contain missing values. The Credit_History column contains two unique values 1 and 0, therefore we can treat it as a categorical column. The rest of the categorical columns contain data in the form of string.
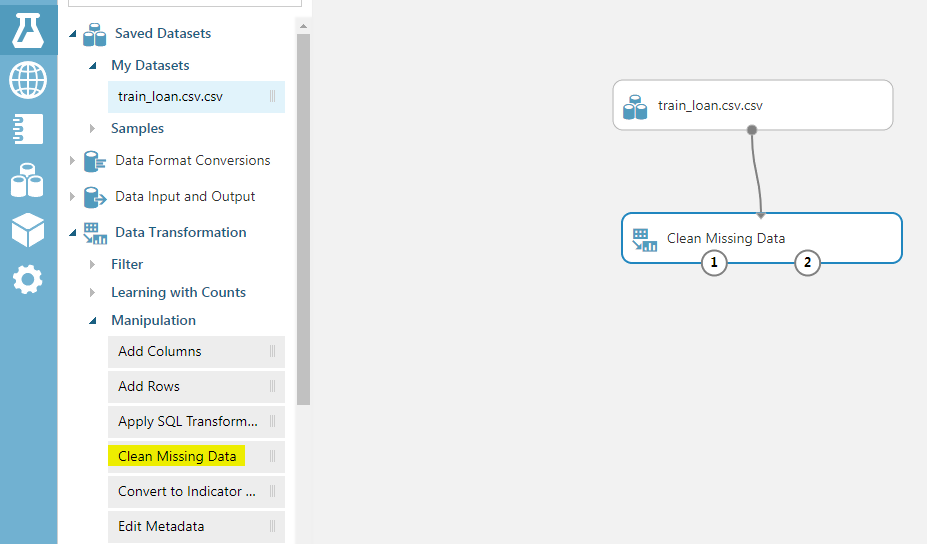
To handle missing data for categorical columns, we will use the “Clean Missing Data” module. To do so, go to “Data Transformations -> Manipulations” and drag the “Clean Missing Data” module to the experiment dashboard. Connect the dataset module with the “Clean Missing Data” module as shown below:
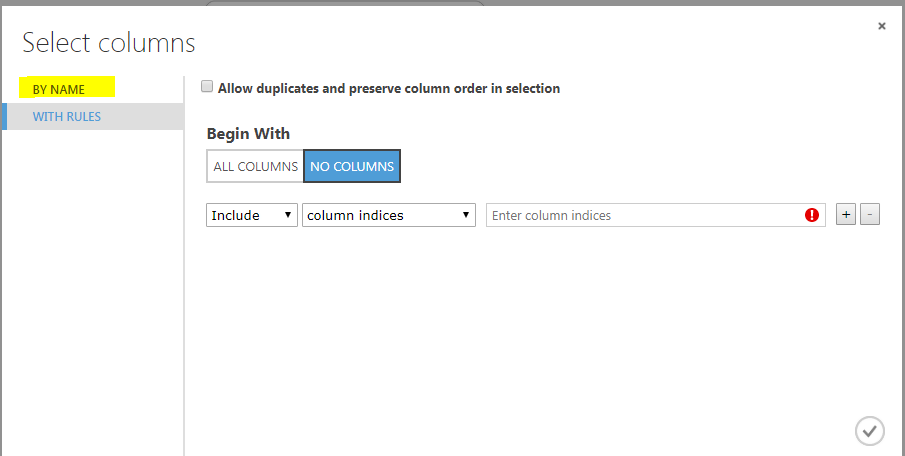
Next, click on the “Clean Missing Data” module. From the options in the right options bar, click “Launch Column Selector”. Select “NO COLUMNS” for the “Begin With” option. And then from the options on the left, select “BY NAME” as shown below:
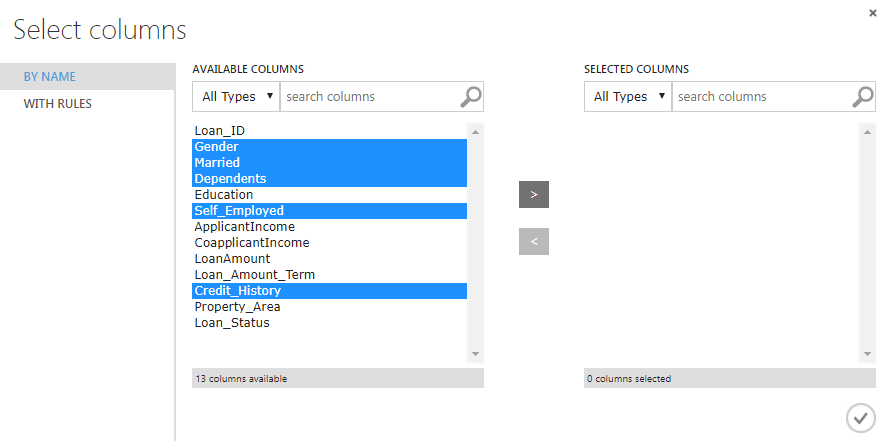
Next, we need to select the Gender, Married, Dependents, Self_Employed and Credit_History columns and add them to the list of SELECTED columns. The following screenshot is for reference:
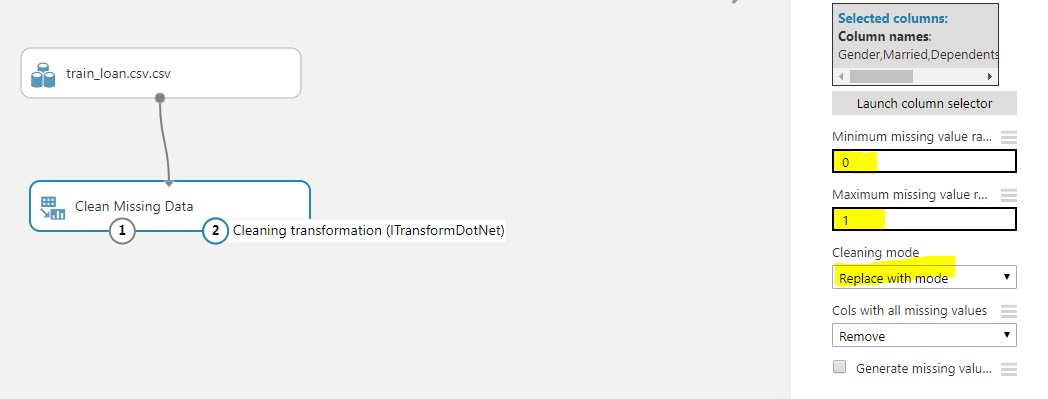
Now, set the “Minimum missing value ratio” to 0 and “Maximum missing value ratio” to 1. This means that we want to replace all the missing values. From the “Cleaning mode” dropdown list. Select “Replace with mode” which means that we want to replace missing values with the most frequently occurring values in the corresponding columns. Look at the highlighted values in the following screenshot, for reference.
Finally, to clean the data, simply right click on the “Clean Missing Data” module and then select “Run Selected”. The missing values in the categorical columns will be replaced with the most frequently occurring values. Now is the time to handle missing values in the numerical columns.
Among numerical columns in our dataset, LoanAmount and Loan_Amount_Term contain missing values. The process to handle these values is the same. Add a new “Clean Missing Data” module, launch the column selector and then select the LoanAmount and Loan_Amount_Term columns. Set the “Minimum missing value ratio” to 0 and “Maximum missing value ratio” to 1. Since, we are now dealing with numeric data, for the “Cleaning mode” we will select the value “Replace with mean” which will replace all the missing numerical values with the mean of the rest of the column values.
Selecting Columns
Selecting columns or features is an area of research in itself. However, our problem will select all the columns in our dataset except the “Loan_ID.” Since the LOAN_ID has no impact on whether or not a customer is eligible for loan or not. To select columns, you can use the “Select Columns in Dataset” module which can be found inside “Data Transformation -> Manipulation”. The “Launch column selector” can be used to select columns as we did on in the last section. Finally, right-click on the “Select Columns in Dataset” module and then select “Run Selected”.
Splitting Data in Training and Testing Set
We are dealing with a supervised learning problem where the algorithm learns from ground truth and is evaluated on new unseen values. We will divide our data into two sets: Training and Testing set. Our logistic regression in Azure ML will be trained on the training data (will learn to predict customer’s loan eligibility from the training data). After we train the algorithm, we will evaluate how well our algorithm performs, using the test data.
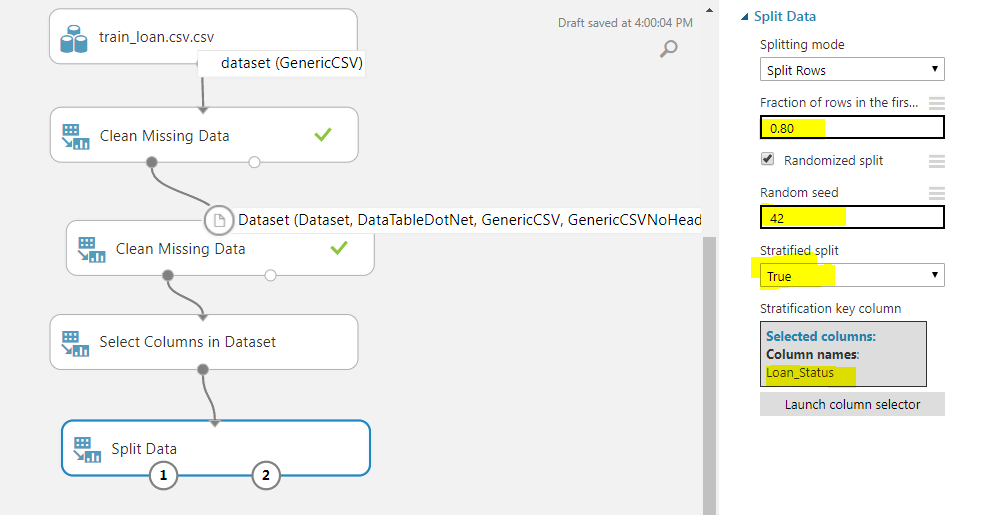
To split the data, we can use the “Split Data” module from “Data Transformations -> Sample and Split”. We need to specify a few parameters for the “Split” data module. From the options on the right of the dashboard, set the value of “Fractions of rows in the first output dataset” to 0.80, which means that 0.80 of the data will be used for training the algorithm. For random seed, you can specify any value. I specified 42. Finally, set “Stratified split” to true. The stratified split equally divides our data with respect to specific columns. We will specify “Loan_Status” as the column for a stratified split using the column selector. Look at the following screenshot for reference:
As the last step, right-click on the “Split Data” module and then select “Run Selected”.
Training the Logistic Regression in Azure ML Algorithm
To train the logistic regression in Azure ML, we can use the “Two-Class Logistic Regression Module” which is available inside the “Machine Learning” module. Next, we need to import the “Train Model” module from the “Machine Learning -> Train”. We need to provide the output of the “Split Data” module and the “Two-Class Logistic Regression Module”, as input to the “Train Model” module. Furthermore, using the column selector for the “Train Model” module, you need to select the column that you want to predict. In our case we need to predict “Loan_Status”, therefore we select this column.
Lastly, we need to add the “Score” module from the “Machine Learning -> Score” module which will find the score of each prediction made by our logistic regression in Azure ML. Look at the following screenshot.
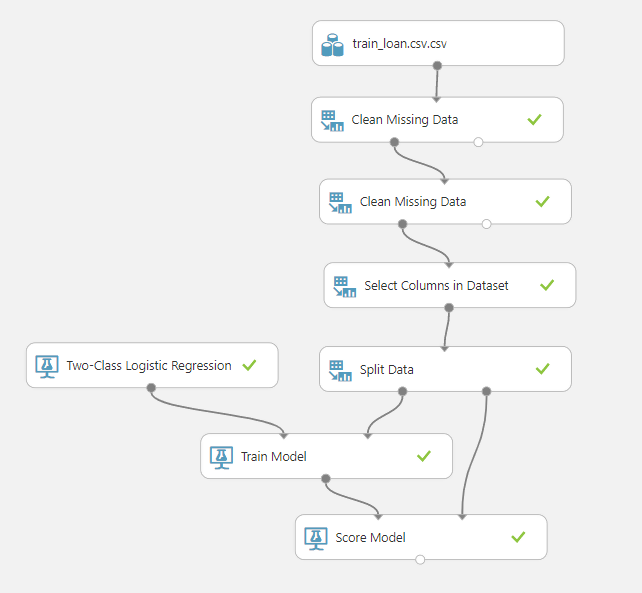
Right-click on the “Score Model” module and then select “Run Selected”.
To visualize the score, right-click on the “Score model” node and select “Visualize”. You will see that to more columns i.e. “Scored Label” and “Scored Probabilities” have been added to the dataset as shown below:
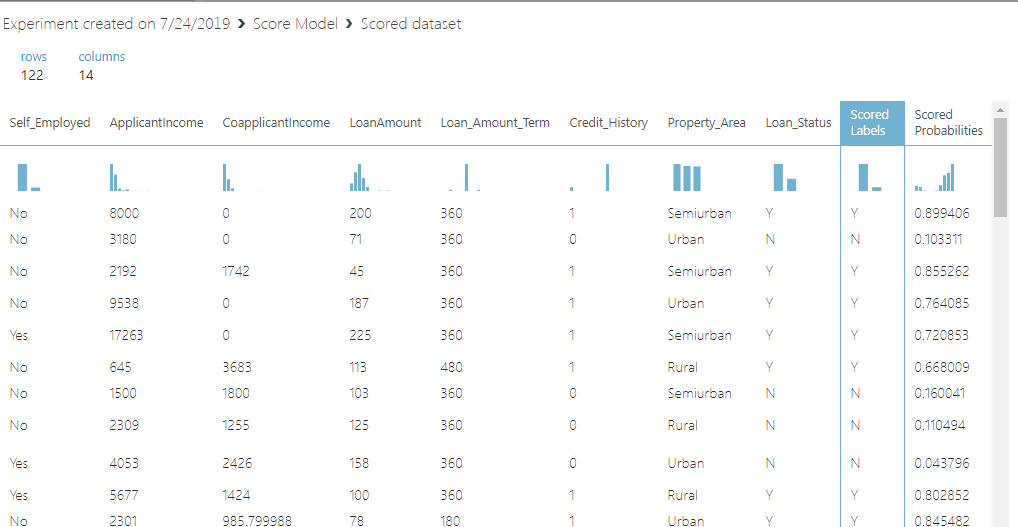
The “Scored Label” contains the prediction and the “Scored Probabilities” contain the probability of prediction. For instance, from the first row, we can evaluate that the customer loan was approved as it is a Y in the “Scored Labels” column. The predicted probability that the loan was approved is 0.899.
Evaluating the Logistic Regression in Azure ML Algorithm
To evaluate the logistic regression in the Azure ML model, we can use the “Evaluate Model” submodule from the “Machine Learning” module. Connect the “Score Model” module with the “Evaluate Model” module. The full model looks like this:
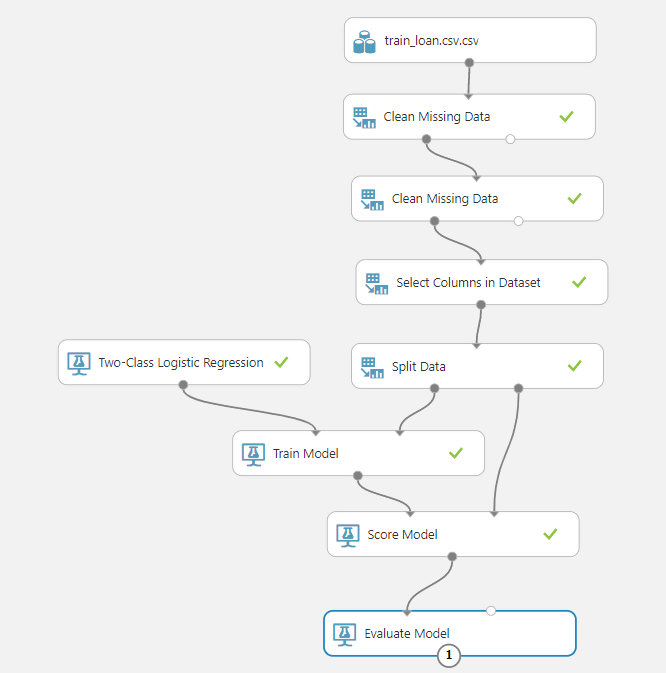
Finally, run the “Evaluate Model” module and then right-click it and click “Visualize” from the drop-down list. You should see the following results:
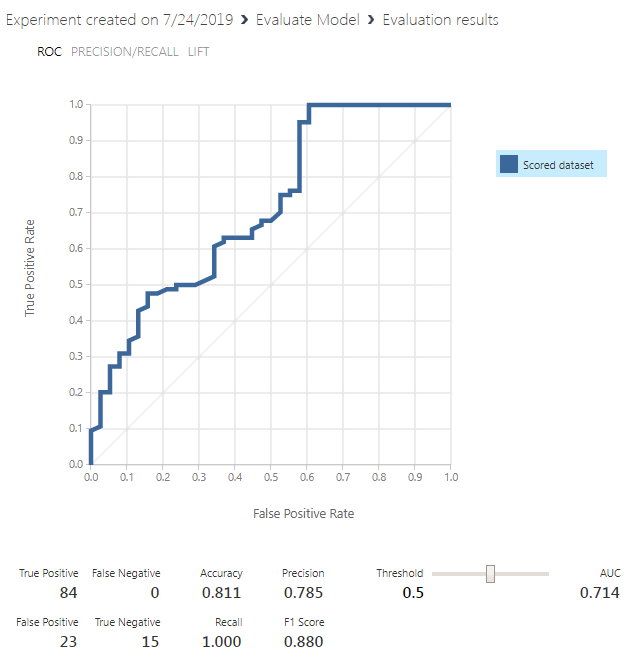
Our model achieves an accuracy of 0.811 percent which means that 81% of the time, our model can correctly predict whether a customer is eligible for loans or not.
Conclusion
In this article, we saw how to create a simple logistic regression in Azure ML model to predict a customer’s eligibility for a bank loan, based on the features such as gender, marital status, employment, credit history etc. We saw how easy it is to create a prediction model in Azure ML Studio without writing a single line of code. Along the way, we discussed various steps to create a two-class logistic regression model for making predictions.
In case, you are interested in understanding integration of SQL Server and Azure ML, go over this article, Integrate SQL Server and Azure Machine Learning.
Other great articles from Ben
| Understanding SQL Server case statement |
| Machine Learning Services – Configuring R Services in SQL Server |
| Importing and Working with CSV Files in SQL Server |

View all posts by Ben Richardson
- Working with the SQL MIN function in SQL Server - May 12, 2022
- SQL percentage calculation examples in SQL Server - January 19, 2022
- Working with Power BI report themes - February 25, 2021