

Since its initial release that was part of SQL Server 2005, Dynamic Management Views (DMV) changed – mostly for the better – the role of database administration (DBA) within SQL Server-based environments. They improved the efficiency of DBAs regarding database server monitoring, issue diagnoses, and subsequent performance optimisation. As a result of this positive reception, it has become customary that some of the highly anticipated items in every release of SQL Server includes discovering what new DMVs will be added. In this article I take you through my favourite top 5 DMVs to come out of SQL Server 2016.
DMV for Monitoring Waiting Statistics
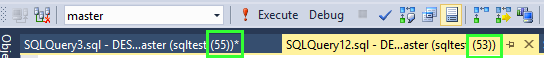
The sys.dm_exec_session_wait_stats DMV returns a list of specific resources that a given session has had to wait for. As a DBA this type of information can provide you with insights on areas of potential bottlenecks in your environment. By default users can only see wait stats information relating to their current active sessions. To illustrate this point, I have setup a SQL Server login sqltest which only has public access. This login currently has two sessions (session ID 53 and 55) as shown in Figure 1.
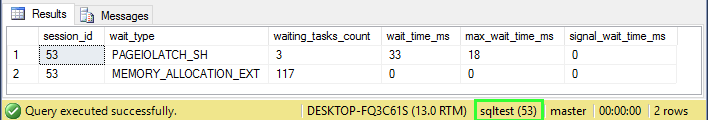
When I query the sys.dm_exec_session_wait_stats DMV in each of these sessions I am limited to viewing wait stats information relating to a given session – in this case only wait stats for session ID 53 are returned, as shown in Figure 2.
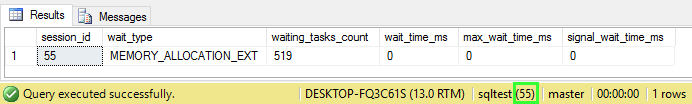
Likewise, when I query this new DMV under a different session (session ID 55), I only get to view wait stats information relating to session ID 55 as shown in Figure 3.
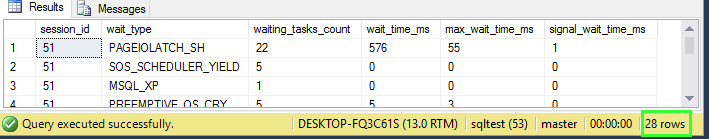
As a DBA you should have the freedom to monitor sessions across the database server. So how can you get to see wait statistics across all active sessions? Well, assuming you are a junior DBA with limited access to a server, you ought to be granted VIEW SERVER STATE permission on the server. Having granted sqltest login the required permission, I am then able to see wait stats information for all sessions as shown in Figure 4.
Finally, please note that unlike the sys.dm_os_wait_stats DMV which also gives you wait stats information though be at an aggregated level, sys.dm_exec_session_wait_stats DMV wait stats information can only be relevant for as long as a given session remains active; once the session is closed the information is disposed and DMV will begin collecting wait stats for the new/recycled session.
DMV for Monitoring Scalar User-Defined Functions
Generally, user defined functions have several benefits such as reusability and convenience but depending on how you have defined them and where you use them (i.e. part of column list or used in a WHERE clause) can have a performance impact in your SQL Server environment. Unlike other user defined objects such as triggers and stored procedures which prior to SQL Server 2016 already had their own DMVs for measuring performance statistics (i.e. sys.dm_exec_trigger_stats and sys.dm_exec_procedure_stats), you had to employ several workarounds (i.e. running a SQL Server profile trace, querying sys.dm_exec_query_stats DMV) in order to successfully monitor execution statistics for user defined functions.
Although you would still have to continue using these workarounds when measuring the performance of table-valued functions, SQL Server 2016 introduces a new DMV – sys.dm_exec_function_stats – which can be used to monitor execution statistics of scalar valued functions. This new DMV also monitors CRL as well as in-memory scalar functions.
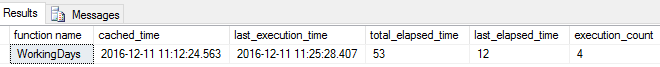
In my demo environment I have a sample user defined function that returns working days between two input date parameters. Figure 5 shows the execution statistics of my sample function returned by this new DMV. Again, just like the sys.dm_exec_query_stats DMV, this new DMV for measuring scalar functions can be a best starting point to identify performance bottlenecks within your environment.
DMV for Monitoring Stretch Database
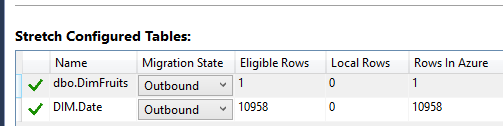
Stretch database is one of the many exciting features released in SQL Server 2016. If you decide to implement Stretch database functionality in your environment, you have an option of monitoring it using the Stretch Database Monitor which is available within SQL Server Management Studio. Figure 6 shows some of the information that is revealed when viewing Stretch Database Monitor against my sample database. As it can be seen all eligible rows from my two tables configured for stretch, were successfully migrated (stretched) into Azure.
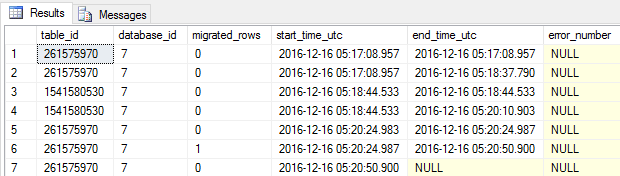
In addition to the Stretch Database Monitor, there is a new DMV in SQL Server 2016 – sys.dm_db_rda_migration_status
– which can be used to monitor Stretch database activities. The migration of data from local database into Azure is sent as a batch. Every row returned by this new DMV represent a batch. This new DMV can only return up to 200 rows of recent batches. Figure 7 shows some of the fields returned when querying sys.dm_db_rda_migration_status DMV; batches in rows 1-5 found no rows to migrate whilst the 6th batch migrated a single row. The 7th batch was currently active at the time of screen capture and thus the end_time_utc field is set to NULL.
DMVs for Monitoring Columnstore Indexes
There are several columnstore DMVs that have been introduced in SQL Server 2016, in this section we take a look at some of those newly added columnstore DMV. (For information on the rest of the newly added columnstore DMVs and system views, refer to this MSDN article).
One of the reasons that make columnstore technology so efficient is that unlike other components of SQL Server, it is reserved a special space in memory that is outside of your traditional SQL Server buffer pool. In versions prior to SQL Server 2016, you had to go through DMVs such as the sys.dm_os_memory_broker_clerks in order to get a sense of your columnstore memory usage. Figure 8 shows some of the results after querying the sys.dm_os_memory_broker_clerks DMV.

SQL Server 2016 introduces a new DMV – sys.dm_column_store_object_pool – that can further assist you in monitoring memory usage of columnstore indexes. Some of the fields returned by this DMV are shown in Figure 9 which returns columnstore index information off my sample table.

In spite of its benefits, a noticeable downside of updateable clustered columnstore index introduced in SQL Server 2014 is that it could contribute into columnstore index fragmentation. If you relied on catalog view sys.column_store_row_groups (particularly, the deleted_rows field) in order to identify fragmentation on your columnstore indexes, then you will be happy to know that SQL Server 2016 introduces some improvements on this catalog view. The improvements come in a form of a newly added DMV – sys.dm_db_column_store_row_group_physical_stats – which extends the information returned by the sys.column_store_row_groups catalog view to include fields such as rowgroup creation time, vertipaq optimisation flag, and rowgroup trim description.
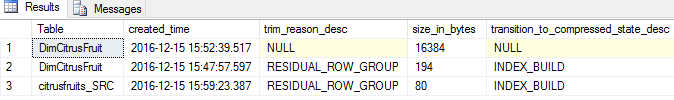
Figure 10 shows some of the new fields that are returned when querying the sys.dm_db_column_store_row_group_physical_stats DMV against my sample database.
Conclusion
Database administration can be a demanding job but we always appreciate every new mechanism that is designed to improve our demanding job. The DMVs introduced in SQL Server 2016 certainly assist in identifying potential risks and performance bottlenecks within SQL Server-based environments which could in turn reduce system downtime. I hope they will be helpful to you as they have been to me.
The next article in this series:

Sifiso's LinkedIn profile
View all posts by Sifiso W. Ndlovu