
A client recently discovered a discrepancy on one of our reports that showed an improvement in performance metrics but was inaccurate. Our reports came from a software tool, which showed the average performance throughout the day. It derived this number from periodic checks and the frequency changed, which affected our report. When we showed an improvement in the metrics on a report, the client showed us that the frequency change may have impacted this, not necessarily any improvement in performance. In situations where we’re measuring values and comparing them to other values, how can we prevent a change in measurement from impacting our reports?
Overview
Data providers may change their measurements for a variety of reasons and these changes can impact reports. Consider a data provider showing an oil well producing an average amount of oil every hour, then changing the report to every day (but consider the well may not be active around the clock). These may not be comparable time frames with derived measures, or we may be able to use a 24-hour cycle to drive the per-hour production.
In some of these situations where metrics change, the data provider will send an algorithm which automatically adjusts or calculates the change so that we can compare past data to new data. In this article, we’ll look at the situations where we must derive this for ourselves and how we can prevent this. We’ll look at two examples where we can see the impact of this on a report:
- Metric example
- Inflation example
Identifying a smaller part of the unit
Our best technique to prevent this will involve identifying the smallest part of the whole unit for measurement. ETL developers may use the unit as a whole, such as total performance metric per day or price per house in an area and these measurements may be impacted if the underlying data changes formats or if other measurements are impacted. In the case of homes, if a person adds to a living space, the price may be impacted, but other measurements like rooms, bathrooms, etc may not be other than square foot. Along with total price, we may want to include the price-per-square-foot. In the same manner, any total performance metrics per day could easily be impacted if anything is removed or added to the system being monitored.
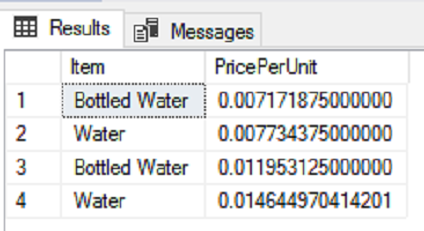
In the below two examples, we see the first table with four inserts (two inserts begin newer data for the same product) provides us with no way to obtain the cost per smallest part of the unit (in this case, fluid ounces). With this type of architecture, we may not identify that a cost increase has happened since the price per item is the same, even if the underlying amount is less. In the second table, we add two columns – the unit term (fluid ounce) and the total units.
We could have used other unit terms, provided that they allowed us to measure the total amount by a small unit which allows us to compare when data changes. Using a unit like 32 fluid ounce bottle is not a smaller unit for comparison if a company changes the bottle size (and this happens). A fluid ounce, by contrast, can be derived by any size, regardless of the measuring system. The same applies to a gallon versus two liters; if the measuring unit changes, we can still use a smaller part of the total for price comparison. In the second table, we then run a query to look at the price per fluid ounce – the smaller unit.
|
1 2 3 4 5 6 7 8 9 10 11 12 13 14 15 16 17 18 19 20 21 22 23 24 25 26 27 28 29 30 31 32 33 34 35 36 37 38 39 40 41 |
CREATE TABLE tbStageProcessB_ExA( ItemID SMALLINT, Item VARCHAR(25), Details VARCHAR(50), ItemPrice DECIMAL(13,5), ) --- Old values: INSERT INTO tbStageProcessB_ExA VALUES (1,'Bottled Water','32 count 20floz bottled water',4.59) , (2,'Water','1 gallon water',0.99) --- New values: INSERT INTO tbStageProcessB_ExA VALUES (1,'Bottled Water','32 count 12floz bottled water',4.59) --- bottled water changes from 20 fl oz to 12 fl oz , (2,'Water','2 litre water',0.99) --- unit changes completely CREATE TABLE tbStageProcessB_ExB( ItemID SMALLINT, Item VARCHAR(25), Details VARCHAR(50), ItemPrice DECIMAL(13,5), UnitTerm VARCHAR(25), Units DECIMAL(9,2) ) --- Old values: INSERT INTO tbStageProcessB_ExB VALUES (1,'Bottled Water','32 count 20floz bottled water',4.59,'fl oz',640) -- units: (32x20) , (2,'Water','1 gallon water',0.99,'fl oz',128) --- New values: INSERT INTO tbStageProcessB_ExB VALUES (1,'Bottled Water','32 count 12floz bottled water',4.59,'fl oz',384) -- units: (32x12) , (2,'Water','2 litre water',0.99,'fl oz',67.6) SELECT Item , ItemPrice/Units PricePerUnit FROM tbStageProcessB_ExB |
In some cases, a smaller unit is provided while in other cases, we must derive it. In dealing with real estate data, as an example, I’ve often seen price per square foot included as a measurement, but there are times where this must be added. Using a similar example as the above example, if a homeowner expands a room (not adds a new room) and raises the price based on the price per square foot, we would see why in the total square footage, not a number of rooms.
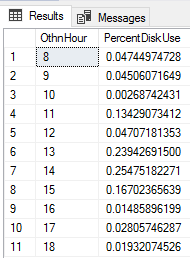
What about situations where we have a daily aggregate without details and the measurement timeframe changes? In the below example, we aggregate disk usage over an eleven-hour cycle, yet in the new data, we see only a daily aggregate of disk usage where daily would be considered the ten hours only. In these cases, we have a few options – one of which is to track our own measurements. In the below example, we’ll look at the percent of usage by each hour, then re-derive this from the total.
|
1 2 3 4 5 6 7 8 9 10 11 12 13 14 15 16 |
--- Get the numeric daily average DECLARE @ndavg BIGINT ;WITH GetAvg AS( SELECT DATEPART(DD,OthnDate) OthnDay, SUM(OthnMetric) OthnDayTotal FROM tblDrive GROUP BY DATEPART(DD,OthnDate) ) SELECT @ndavg = AVG(OthnDayTotal) FROM GetAvg ---- Report on our percentages (we'll save this in the next step): SELECT OthnHour , (AVG(OthnMetric)/CAST(@ndavg AS DECIMAL(17,8))) PercentDiskUse FROM tblDrive GROUP BY OthnHour |
|
1 2 3 4 5 6 7 8 9 10 11 12 13 14 15 16 |
DECLARE @ndavg BIGINT ;WITH GetAvg AS( SELECT DATEPART(DD,OthnDate) OthnDay, SUM(OthnMetric) OthnDayTotal FROM tblDrive GROUP BY DATEPART(DD,OthnDate) ) SELECT @ndavg = AVG(OthnDayTotal) FROM GetAvg --- Save template: SELECT OthnHour , (AVG(OthnMetric)/CAST(@ndavg AS DECIMAL(17,8))) PercentDiskUse INTO tbPercentFormat FROM tblDrive GROUP BY OthnHour |
We create this table format for deriving the new data that we now receive daily instead of hourly. In the below example of a variable, we have a new daily measurement that we derive hourly data from our format table:
|
1 2 3 4 5 6 |
--- Measurement changes with daily value (new value): DECLARE @newmetricmeasurement BIGINT = 2348713 SELECT OthnHour , CAST((PercentDiskUse*@newmetricmeasurement) AS BIGINT) OthnMetric FROM tbPercentFormat |
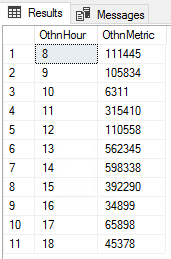
If nothing has changed in the system we’re measuring and we have a history of metrics that allow us to get an accurate measure of the past use, this may be a helpful measure to compare older to newer data. We’re assuming in the above example that the percent used in each hour will be the same for the new totals, which measure the total usage by day (a day is assumed to be 11 hours here). We can only assume this because nothing has changed in our system and we have enough aggregate data for each hour of usage in our old data. Even with these two points being true, these data by hour may not be correct.
In the cases where a tool changed its measuring system, I contacted the company and discussed the appropriate way to compare old to new data and they were able to provide an algorithm for this. These situations also proved the value of sometimes developing an independent tool since measurements can change. If I have to change a tool’s measurements which will affect new and old data for comparisons, I always begin the tool with how to derive comparable data from new to old.
Unfortunately, metrics measurements can change by time, amount or another measure. Sometimes, we do not receive an algorithm which allows us to compare old data to new. While this gives us an idea of a possible solution, we would want to ensure that it’s compatible with our system, such as no new application changes, ETL loaders being added, etc.
Conclusion
We will see this challenge in data periodically and if we use small measures, or add small measures to our calculations, we may be able to avoid complications with clients identifying errors. We should approach using dimensions carefully with this as well, especially if the unit system changes (such as metric to English). We can add a dimension for conversions in these cases, while still using small measurement units. In addition to using a small unit of measurement so we can accurately compare if a change occurs, we should make sure that other factors also remain the same. In the example of metrics, if the change of metric measurements also happened with a change in processes on the server or servers being measured, this would mean we don’t have an accurate comparison.
References
- Arithmetic operators available in T-SQL
- 3 T-SQL tips for DBAs
- Why ceteris paribus matters in statistics

He has spent a decade working in FinTech, along with a few years in BioTech and Energy Tech.He hosts the West Texas SQL Server Users' Group, as well as teaches courses and writes articles on SQL Server, ETL, and PowerShell.
In his free time, he is a contributor to the decentralized financial industry.
View all posts by Timothy Smith
- Data Masking or Altering Behavioral Information - June 26, 2020
- Security Testing with extreme data volume ranges - June 19, 2020
- SQL Server performance tuning – RESOURCE_SEMAPHORE waits - June 16, 2020