

In this article, we’ll show a process for SQL Server performance tuning, and several tools, tips and techniques you can use to monitor performance and take the necessary steps to improve it.
SQL Server is a common platform for enterprise-grade database workloads. As your SQL Server database grows in size and supports increasing application usage, performance can suffer and database administrators need the tools to identify, diagnose and resolve performance problems.

Monitoring SQL Server Components: A 5-Step process
SQL Server runs a dynamic environment: application data changes and the number of users or applications and the way they interact with the database can also change.
A SQL Server database automatically manages system resources, like disk space and memory, to reduce the need for large-scale manual optimization. SQL Server performance tuning allows administrators to view performance trends and determine if changes are needed.
Determine monitoring goals
In order to effectively perform SQL Server performance tuning, clarify the reasons you are monitoring the system. Your monitoring goals can include:
- Defining a performance benchmark and identifying changes in performance over time
- Diagnosing specific performance problems and identifying the component or process to be optimized
- Comparing the performance impact of different applications, monitor user activity, or test how the database reacts to different levels of load
- Testing scheduled maintenance, backup and recovery plans
- Testing different variations of database architecture or hardware setup
Choose a tool
Now that you have determined the reasons for monitoring, you can choose the right tool for monitoring. SQL Server offers performance tuning capabilities, as does the Windows operating system itself, allowing you to monitor environments with heavy transactional loads
Select components and metrics
Determine which components of the SQL Server database you need to monitor. SQL Server Profiler lets you perform traces to monitor specific types of events, or exclude irrelevant events. Select events that are relevant for the components you need to track
After determining the components to be tracked, determine the metrics to be tracked. Once you have selected events for monitoring, you can specify that only certain event data will be included, to ensure the data is relevant to your monitoring goals. Limiting the data you collect in a trace also conserves system resources required for SQL Server performance tuning
Monitor the database
Start running your monitoring tool on an ongoing basis and collect data about selected events and metrics
Analyze data
Analyze the data collected by the tool to ensure that the monitoring objectives are achieved. If you cannot achieve your goals based on the data – for example, you cannot identify the source of the performance problem – modify the components or metrics you are tracking
SQL Server Performance Tuning and Monitoring Tools
There are many tools available for SQL Server performance tuning. The list below briefly reviews popular tools.
Transact-SQL Built-in Functions
SQL Server provides functions that provide information about database activity from startup onwards. The data is stored in predefined counters.
Transact-SQL with DBCC
You can use database console command (DBCC) statements to verify the physical and logical integrity of the database and get performance statistics.
Database Engine Tuning Advisor (DTA)
Analyzes the impact of a Transact-SQL statement on the database to optimize performance. DTA provides automated instructions for modifying indexes, views, or partitions to improve performance.
Database Experimentation Assistant (DEA)
A new solution for SQL Server performance tuning, using the concept of A/B testing. This is a great way to evaluate specific versions of the SQL Server database engine for specific workloads.
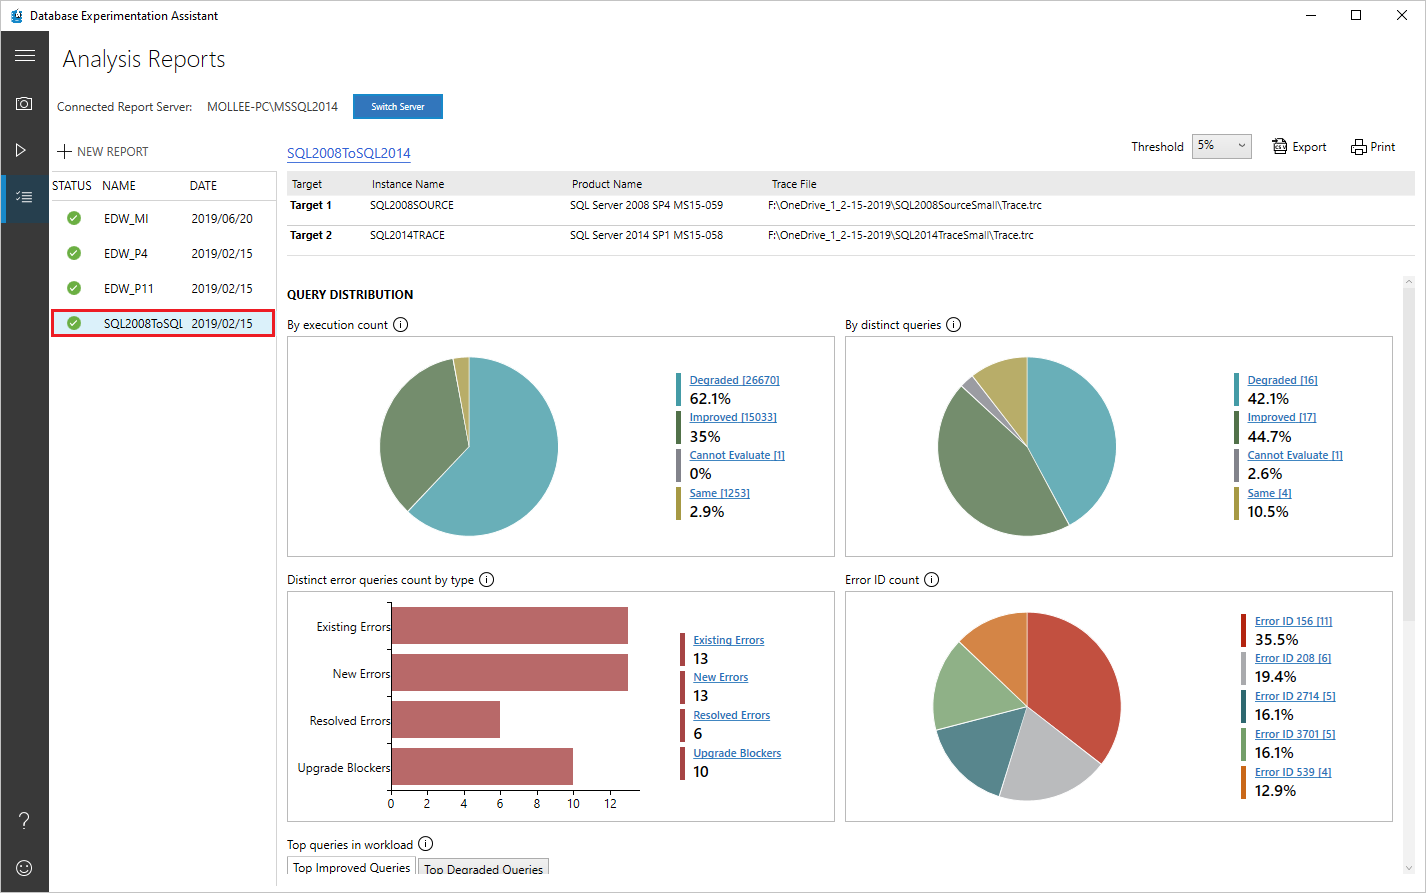
Image Source: Microsoft
Windows application event logs
Provides information on events recorded by SQL Server, the SQL Server Agent, and the text search process, which you cannot get from other tools, and can be valuable in SQL server performance tuning. You can use it to diagnose and solve many types of problems.
Extended events
A lightweight monitoring tool provided by Microsoft, which provides three dashboards for managing and analyzing session data: New Session Wizard, XE Profiler, and New Session.
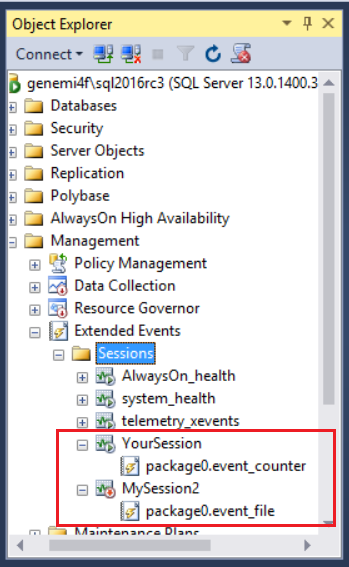
Image Source: Microsoft
Live Query Statistics (LQS)
Provides real-time data about query execution. This is very useful for troubleshooting query performance as part of SQL Server performance tuning.
System Monitor (resource usage)
Provides data on database resource usage, such as the number of page requests in the buffer manager. You can use it to track performance by defining counters and objects for specific events.
Management Studio Open Activity Monitor
Provides a snapshot of current activity in the database, including, including system processes currently running or blocked, database locks, and activity of user accounts.
Management Studio Performance Dashboard
A quick way to identify performance issues in a currently-running SQL Server instance.
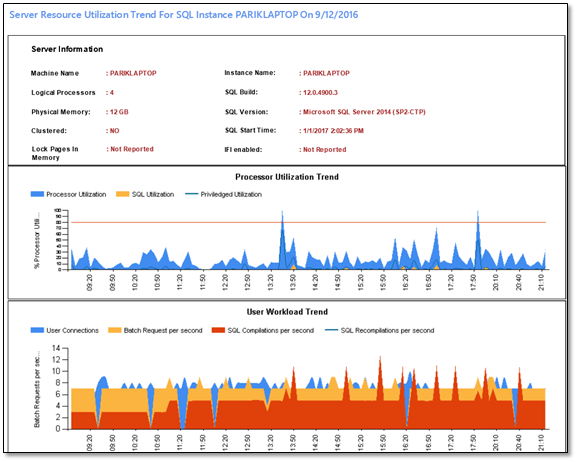
Image Source: Microsoft
Query Store
Provides information about the performance of query execution plans. You can quickly detect performance differences due to query plan changes. The tool automatically collects and displays historical queries, query plans, and execution data. Query Store lets you view data according to time intervals, to identify patterns of database usage and understand how query plan changes impact the database.
SQL Server Performance Tuning Tips
Here are a few tips you can use to perform SQL Server performance tuning on a production database instance.
SQL Server Performance with Amazon EBS
Here are several best practices to apply when configuring SQL Server instances with AWS EBS:
- Select the right volume — for your workload. Each volume provides different performance and latency, and is priced accordingly. You can learn more about EBS volumes in this article
- Try EBS-optimized instance types — uses configuration stacks optimized for delivering the best performance
- Use locally-attached NVMe storage for tempdb — this option works with ultra-low latency disks
- Stripe EBS volumes — to optimize performance. Let’s you exceed the limits of any single volume
Monitor Resource Usage
Resource utilization is an important factor in SQL database performance. If you are using Windows, use System Monitor to view the behavior of SQL Server objects, other relevant system objects, and performance counters. The nice thing about System Monitor is that it shows counters for Windows and SQL Server at the same time, so you can find correlations in case of performance issues.
Use Database Engine Tuning Advisor
Database Engine Tuning Advisor can help you analyze the performance of Transact-SQL statements executed against your databases as part of tuning.
The Advisor provides a wizard you can use to analyze the performance impact of Transact-SQL queries. Beyond that, it provides recommendations, for example, suggesting that you create or delete indexes.
Identify Suspect Queries
Use the following T-SQL code to find the 20 lowest performing queries. The code was provided by Sripal Reddy Vindyala. Note that even if the maximum average run time is high, the impact on the database will be small if the query is rarely used. Conversely, even if a query has a moderate average run time, but is run many times a day, it will create a much higher load on the database.
|
1 2 3 4 5 6 7 8 9 10 11 |
SELECT TOP 20 total_worker_time/execution_count AS Avg_CPU_Time ,Execution_count ,total_elapsed_time/execution_count as AVG_Run_Time ,total_elapsed_time ,(SELECT SUBSTRING(text,statement_start_offset/2+1,statement_end_offset ) FROM sys.dm_exec_sql_text(sql_handle) ) AS Query_Text FROM sys.dm_exec_query_stats ORDER BY Avg_CPU_Time DESC |
Fine Tuning Queries
It is essential to fine-tune T-SQL queries and add appropriate indexes, to help the SQL optimizer find the best execution plan for user queries. In order to fine-tune common user queries, you should consider their current execution plan:
- Identify which operators used in the query make up most of the query execution time
- If an operator is taking a long time, find out why. Check why a specific table or index scan is being performed instead of a seek (usually seeks to take less time than scans, but in small tables, scans can be more efficient)
- There are over 70 operators supported in SQL Server, and you need to understand them in depth to understand what changes would result in the fastest run for all possible use cases of the query
Conclusion
In this article, I covered a five-step process for SQL Server performance tuning, which involves determining your goals, choosing a tool or tools, identifying SQL Server components and metrics to be tracked, monitoring, and analyzing the data to identify improvements.
I also covered a variety of monitoring utilities built into SQL Server and the Windows operating system, including Transact-SQL, DTA, DEA, and the Windows application event logs. Finally, I covered several simple ways to fine-tune and improve SQL Server performance:
- Monitoring resource use to identify slow running SQL Server and Windows objects that affect database performance
- Using the Database Tuning Advisor to analyze the performance of T-SQL queries and get actionable recommendations for improvement
- Identifying the top 20 slow running queries and focusing on those
- Fine-tuning queries by analyzing their execution path and fine-tuning use of operators
I hope this will be helpful on your journey to a faster and more efficient SQL Server deployment.

You can find him on LinkedIn
- Getting started with MySQL on AWS: Costs, Setup, and Deployment options - November 11, 2022
- SQL Server Performance Tuning made simple - April 19, 2021
- How to migrate to Azure ML: A quick start guide - February 5, 2021