
Whenever a query is executed in SQL Server, its execution plan, as well as some useful execution data are placed into the plan cache for future use. This information is a treasure trove of metrics that can allow some very useful insight into your server’s performance and resource consumption. Much of this information would be difficult or impossible to acquire otherwise.
Understanding how to access and use the metadata about query execution will provide us the tools we need to answer questions about our server and gain fascinating performance data. I’ve found myself spending more and more time writing, tweaking, and using queries against the plan cache lately and look forward to sharing these adventures with you!
The power of the plan cache
Digging through the plan cache, something I often refer to as “dumpster diving” provides info on a variety of SQL Server components, all of which we will demonstrate here. These include:
- Server memory consumption
- Query text, execution plan, and execution frequency
- Resource consumption by query
- Query recompiles
- Worst performing queries on your server
The data in the plan cache is not static, and will change over time. Execution plans, along with their associated query and resource metrics will remain in memory for as long as they are deemed relevant. Plans can be removed from cache when there is memory pressure, when they age out (they get stale), or when a new plan is created, rendering the old one obsolete. Keep this in mind as we are looking around: The info we find in the plan cache is transient and indicative of a server’s current and recent activity and does not reflect a long-term history. As a result, be sure to do thorough research on the plan cache prior to making any significant decisions based on that data.
Let’s start out with a search based on query text. Maybe you’re looking for queries that have run against a specific table or have used a certain object. Here’s an example where we are searching for all queries run against the SalesOrderHeader table:
|
1 2 3 4 5 6 7 8 9 10 11 12 13 14 15 16 17 18 |
SELECT TOP 10 databases.name, dm_exec_sql_text.text AS TSQL_Text, dm_exec_query_stats.creation_time, dm_exec_query_stats.execution_count, dm_exec_query_stats.total_worker_time AS total_cpu_time, dm_exec_query_stats.total_elapsed_time, dm_exec_query_stats.total_logical_reads, dm_exec_query_stats.total_physical_reads, dm_exec_query_plan.query_plan FROM sys.dm_exec_query_stats CROSS APPLY sys.dm_exec_sql_text(dm_exec_query_stats.plan_handle) CROSS APPLY sys.dm_exec_query_plan(dm_exec_query_stats.plan_handle) INNER JOIN sys.databases ON dm_exec_sql_text.dbid = databases.database_id WHERE dm_exec_sql_text.text LIKE '%SalesOrderHeader%'; |
The results of this query will vary depending on your usage of this table, but on my server look like this:
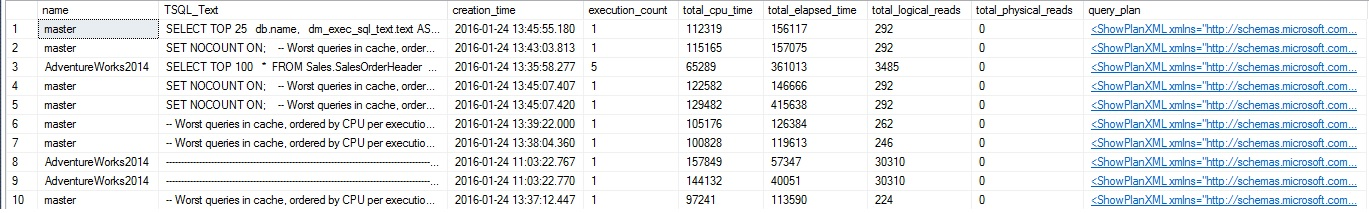
The search grabbed the top ten queries with this text on my server. Note that it collected queries from every database, not just AdventureWorks! If we’d like, we can filter on the database name to limit results to a target database. Our search queries also appear in the list, since they include the table name as well, and are likely worth excluding as well. Here’s a brief rundown of the views used above:
Sys.dm_exec_query_stats: Provides details about executions of the query, such as reads, writes, duration, etc…
Sys.dm_exec_sql_text: This function includes the text of the query executed. The plan handle is a uniquely identifying ID for a given execution plan.
sys.dm_exec_query_plan: Also a function of plan handle, this provides the XML query execution plan for a given query.
sys.databases: System view that provides quite a bit of info on each database on this instance.
Now we can filter and figure out what queries are running based on their text, how often they run, and some basic usage totals. We can also click on the XML execution plan and see what the optimizer decided to do when the query was executed. If you click on the query plan link within the results, a new tab will open with the graphical plan:
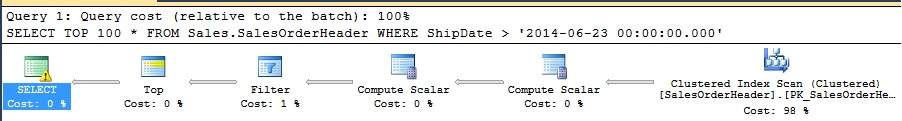
As with a plan you view normally in SQL Server Management Studio or another tool, you can hover over any steps to get more details, or open the properties window for even more information. As always, exclamation marks, like the yellow one above, are indicative of an execution warning and should always be investigated further.
Searching on text is handy, but we are capable of gathering far more useful data by adjusting our existing query. For example, what if we wanted to know which queries on our server are the most expensive? This would do the trick:
|
1 2 3 4 5 6 7 8 9 10 11 12 13 14 15 16 17 18 19 20 21 22 23 24 25 26 27 28 29 30 31 |
SELECT TOP 25 databases.name, dm_exec_sql_text.text AS TSQL_Text, CAST(CAST(dm_exec_query_stats.total_worker_time AS DECIMAL)/CAST(dm_exec_query_stats.execution_count AS DECIMAL) AS INT) as cpu_per_execution, CAST(CAST(dm_exec_query_stats.total_logical_reads AS DECIMAL)/CAST(dm_exec_query_stats.execution_count AS DECIMAL) AS INT) as logical_reads_per_execution, CAST(CAST(dm_exec_query_stats.total_elapsed_time AS DECIMAL)/CAST(dm_exec_query_stats.execution_count AS DECIMAL) AS INT) as elapsed_time_per_execution, dm_exec_query_stats.creation_time, dm_exec_query_stats.execution_count, dm_exec_query_stats.total_worker_time AS total_cpu_time, dm_exec_query_stats.max_worker_time AS max_cpu_time, dm_exec_query_stats.total_elapsed_time, dm_exec_query_stats.max_elapsed_time, dm_exec_query_stats.total_logical_reads, dm_exec_query_stats.max_logical_reads, dm_exec_query_stats.total_physical_reads, dm_exec_query_stats.max_physical_reads, dm_exec_query_plan.query_plan, dm_exec_cached_plans.cacheobjtype, dm_exec_cached_plans.objtype, dm_exec_cached_plans.size_in_bytes FROM sys.dm_exec_query_stats CROSS APPLY sys.dm_exec_sql_text(dm_exec_query_stats.plan_handle) CROSS APPLY sys.dm_exec_query_plan(dm_exec_query_stats.plan_handle) INNER JOIN sys.databases ON dm_exec_sql_text.dbid = databases.database_id INNER JOIN sys.dm_exec_cached_plans ON dm_exec_cached_plans.plan_handle = dm_exec_query_stats.plan_handle WHERE databases.name = 'AdventureWorks2014' ORDER BY dm_exec_query_stats.max_logical_reads DESC; |
A new view has been added to this query: sys.dm_exec_cached_plans, which provides additional info on a cached plan itself, such as the type of query that was executed and the size of the stored plan. The results don’t easily fit on a single line, so I’ve cut off a chunk of them to keep this readable:
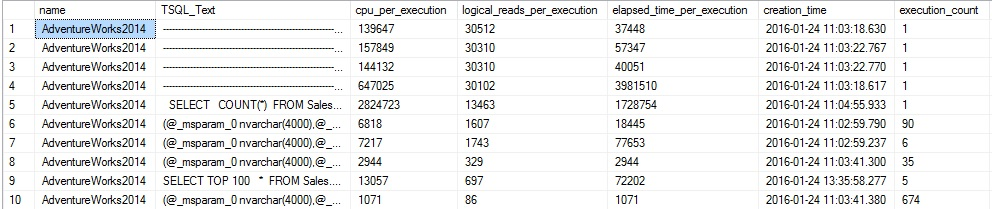
The key to the results is that they are sorted by the maximum logical reads for a given execution, which allows us to sift through the queries with the highest reads and determine if optimization is needed. We could also sort by total logical reads, or also by elapsed time (query duration), worker time (CPU), or number of executions. This allows us to pull out common queries and see what the worst offenders are based on a variety of metrics. Calculating metrics per execution allows us to understand more easily how expensive a given query was, and allows us to weight execution frequency vs. execution cost.
Some of the TSQL_Text results display as a bunch of dashes. This is because the query text stored in dm_exec_sql_text includes ALL text from the query, including comments. We can copy the TSQL from the TSQL_Text column and paste it into a separate window in order to get a better view of it. There is an added benefit of the inclusion of comments: We can tag queries so that they are easy to identify later on. For example, let’s say we’re introducing a new query into production that will run 50k times per hour. We are concerned about performance and want to be able to monitor resource consumption as soon as it is released. An efficient and easy way to make the query easy to find in cache would be to add a unique tag to it, such as in the following example:
|
1 2 3 4 5 6 7 8 9 10 11 12 13 14 15 |
-- 01232016 Open Order Query by EHP SELECT TOP 100 SalesOrderHeader.SalesOrderID, SalesOrderDetail.SalesOrderDetailID, SalesOrderHeader.OrderDate, SalesOrderHeader.DueDate, SalesOrderHeader.PurchaseOrderNumber, SalesOrderDetail.ProductID, SalesOrderDetail.LineTotal FROM Sales.SalesOrderHeader INNER JOIN Sales.SalesOrderDetail ON SalesOrderHeader.SalesOrderID = SalesOrderDetail.SalesOrderID WHERE Status <> 5; |
The comment at the top of the query will be included in the plan cache. At the cost of about 30 bytes of SQL text, we now can search the plan cache for this specific query and get exactly what we want without any noise:
|
1 2 3 4 5 6 7 8 9 10 11 12 13 14 15 16 17 18 19 20 21 22 23 24 25 26 27 28 29 30 |
SELECT databases.name, dm_exec_sql_text.text AS TSQL_Text, CAST(CAST(dm_exec_query_stats.total_worker_time AS DECIMAL)/CAST(dm_exec_query_stats.execution_count AS DECIMAL) AS INT) as cpu_per_execution, CAST(CAST(dm_exec_query_stats.total_logical_reads AS DECIMAL)/CAST(dm_exec_query_stats.execution_count AS DECIMAL) AS INT) as logical_reads_per_execution, CAST(CAST(dm_exec_query_stats.total_elapsed_time AS DECIMAL)/CAST(dm_exec_query_stats.execution_count AS DECIMAL) AS INT) as elapsed_time_per_execution, dm_exec_query_stats.creation_time, dm_exec_query_stats.execution_count, dm_exec_query_stats.total_worker_time AS total_cpu_time, dm_exec_query_stats.max_worker_time AS max_cpu_time, dm_exec_query_stats.total_elapsed_time, dm_exec_query_stats.max_elapsed_time, dm_exec_query_stats.total_logical_reads, dm_exec_query_stats.max_logical_reads, dm_exec_query_stats.total_physical_reads, dm_exec_query_stats.max_physical_reads, dm_exec_query_plan.query_plan, dm_exec_cached_plans.cacheobjtype, dm_exec_cached_plans.objtype, dm_exec_cached_plans.size_in_bytes FROM sys.dm_exec_query_stats CROSS APPLY sys.dm_exec_sql_text(dm_exec_query_stats.plan_handle) CROSS APPLY sys.dm_exec_query_plan(dm_exec_query_stats.plan_handle) INNER JOIN sys.databases ON dm_exec_sql_text.dbid = databases.database_id INNER JOIN sys.dm_exec_cached_plans ON dm_exec_cached_plans.plan_handle = dm_exec_query_stats.plan_handle WHERE dm_exec_sql_text.text LIKE '-- 01232016 Open Order Query by EHP%'; |
The results only include queries that start with the comment tag we created, and therefore all other similar results, including the search query above, are eliminated from what is returned:

Note that the creation time is included, which tells us when the plan was created. This provides some insight into how long the plan has been in cache. With it, we can calculate the number of executions per hour for a given query by adding the following TSQL to any of our searches:
|
1 2 3 |
CAST(CAST(dm_exec_query_stats.execution_count AS DECIMAL) / CAST((CASE WHEN DATEDIFF(HOUR, dm_exec_query_stats.creation_time, CURRENT_TIMESTAMP) = 0 THEN 1 ELSE DATEDIFF(HOUR, dm_exec_query_stats.creation_time, CURRENT_TIMESTAMP) END) AS DECIMAL) AS INT) AS executions_per_hour |
This looks a bit messy as we need to do some type conversions to prevent unwanted truncation or rounding, but the basic calculation is simply execution count divided by hours. The CASE statement handles the scenario where the plan is under an hour old, in which case zero would not be a useful result, so we use one for the hours value instead. With that TSQL added to our previous query, we can view the desired result:

Now that we have the basics under our belt, let’s start tearing apart execution plans themselves and search based on their contents!
Searching for query execution plan specifics
There are many reasons why we would want to search the execution plan itself for specific bits that interest us. Consider some of these examples:
- Use of a specific index.
- Warnings, such as implicit conversions, TempDB spills, or joins with no predicate.
- Use of Parallelism.
- Clustered index scans, table scans, or operators that may be indicative a bigger problem.
- Use of a table, function, stored proc, or other object that may not explicitly be in the query text.
- Execution plans that involve forced indexes, query hints, table hints, or other options.
The overly simple way to search the text of an execution plan for index usage would be to take the XML as a pile of text and scan it for all occurrences of the index name:
|
1 2 3 4 5 6 7 8 9 10 11 12 |
SELECT dm_exec_query_plan.query_plan, usecounts AS execution_count, dm_exec_sql_text.text FROM sys.dm_exec_cached_plans CROSS APPLY sys.dm_exec_query_plan(plan_handle) INNER JOIN sys.dm_exec_query_stats ON dm_exec_query_stats.plan_handle = dm_exec_cached_plans.plan_handle CROSS APPLY sys.dm_exec_sql_text(dm_exec_query_stats.plan_handle) WHERE CAST(dm_exec_query_plan.query_plan AS NVARCHAR(MAX)) LIKE '%PK_SalesOrderHeader_SalesOrderID%' |
This returns the results we are looking for, but also quite a bit of noise. Since we are not searching explicitly for index usage, there’s often going to be additional execution plans returned that involved the index in question, but did not explicitly use them. User metadata searches or system maintenance may cause some of this noise:
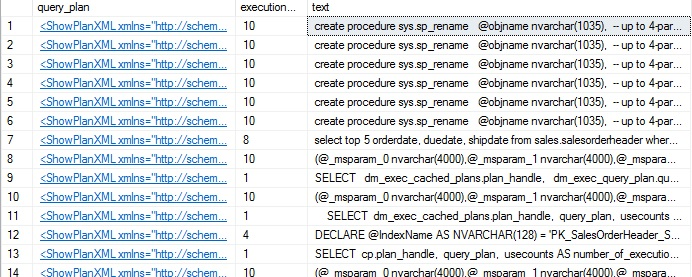
Index renames, as well as the various searches we have been executing all show up in the list. On a busier server, the amount of noise may make it time consuming to find the queries we are actually looking for. In addition, this search is rather slow. Since execution plans are XML, we will benefit from searching through them using XML. The following query will return only instances where the index is actually used, and will not include unrelated references:
|
1 2 3 4 5 6 7 8 9 10 11 12 13 14 15 16 17 18 19 |
DECLARE @index_name AS NVARCHAR(128) = '[PK_SalesOrderHeader_SalesOrderID]'; ;WITH XMLNAMESPACES (DEFAULT 'http://schemas.microsoft.com/sqlserver/2004/07/showplan') SELECT stmt.value('(@StatementText)[1]', 'varchar(max)') AS sql_text, obj.value('(@Database)[1]', 'varchar(128)') AS database_name, obj.value('(@Schema)[1]', 'varchar(128)') AS schema_name, obj.value('(@Table)[1]', 'varchar(128)') AS table_name, obj.value('(@Index)[1]', 'varchar(128)') AS index_name, obj.value('(@IndexKind)[1]', 'varchar(128)') AS index_type, dm_exec_query_plan.query_plan, dm_exec_cached_plans.usecounts AS execution_count FROM sys.dm_exec_cached_plans CROSS APPLY sys.dm_exec_query_plan(plan_handle) CROSS APPLY query_plan.nodes('/ShowPlanXML/BatchSequence/Batch/Statements/StmtSimple') AS nodes(stmt) CROSS APPLY stmt.nodes('.//IndexScan/Object[@Index=sql:variable("@index_name")]') AS index_object(obj) |
This is a bit more complex as we need to search the XML explicitly for index usage by name, but the results will be accurate:

The 4 rows returned correspond to specific queries in which the primary key on SalesOrderHeader was used in the execution plan. This can be an excellent tool when researching not only if an index is used, but how it is used, and in what queries. If we are trying to eliminate unneeded indexes, and discover one that is read a thousand times a day, we can use this further research to see exactly what queries cause those reads. With that information in hand, we can make intelligent decisions about whether the index can be removed, how the query could be rewritten to no longer need it, or some other solution.
Similar to searching for queries that use specific indexes, we can parse the XML and look for any execution plan operations that may be of interest. For example, implicit conversions will often harm performance as the optimizer needs to convert between data types on-the-fly. This can cause scans instead of seeks, excessive reads, and worst of all, unwanted latency. We can combine two earlier queries to provide a list of all queries in cache for AdventureWorks2014 that have had implicit conversions, as well as include the useful metrics from our initial plan cache searches:
|
1 2 3 4 5 6 7 8 9 10 11 12 13 14 15 16 17 18 19 20 21 22 23 24 25 26 27 |
;WITH XMLNAMESPACES (DEFAULT 'http://schemas.microsoft.com/sqlserver/2004/07/showplan') SELECT dm_exec_sql_text.text AS sql_text, CAST(CAST(dm_exec_query_stats.execution_count AS DECIMAL) / CAST((CASE WHEN DATEDIFF(HOUR, dm_exec_query_stats.creation_time, CURRENT_TIMESTAMP) = 0 THEN 1 ELSE DATEDIFF(HOUR, dm_exec_query_stats.creation_time, CURRENT_TIMESTAMP) END) AS DECIMAL) AS INT) AS executions_per_hour, dm_exec_query_stats.creation_time, dm_exec_query_stats.execution_count, CAST(CAST(dm_exec_query_stats.total_worker_time AS DECIMAL)/CAST(dm_exec_query_stats.execution_count AS DECIMAL) AS INT) as cpu_per_execution, CAST(CAST(dm_exec_query_stats.total_logical_reads AS DECIMAL)/CAST(dm_exec_query_stats.execution_count AS DECIMAL) AS INT) as logical_reads_per_execution, CAST(CAST(dm_exec_query_stats.total_elapsed_time AS DECIMAL)/CAST(dm_exec_query_stats.execution_count AS DECIMAL) AS INT) as elapsed_time_per_execution, dm_exec_query_stats.total_worker_time AS total_cpu_time, dm_exec_query_stats.max_worker_time AS max_cpu_time, dm_exec_query_stats.total_elapsed_time, dm_exec_query_stats.max_elapsed_time, dm_exec_query_stats.total_logical_reads, dm_exec_query_stats.max_logical_reads, dm_exec_query_stats.total_physical_reads, dm_exec_query_stats.max_physical_reads, dm_exec_query_plan.query_plan FROM sys.dm_exec_query_stats CROSS APPLY sys.dm_exec_sql_text(dm_exec_query_stats.sql_handle) CROSS APPLY sys.dm_exec_query_plan(dm_exec_query_stats.plan_handle) WHERE query_plan.exist('//PlanAffectingConvert') = 1 AND query_plan.exist('//ColumnReference[@Database = "[AdventureWorks2014]"]') = 1 ORDER BY dm_exec_query_stats.total_worker_time DESC; |
The first XML check will verify if PlanAffectingConvert is found in the execution plan, which verifies implicit conversions for us. The second XML check limits results to AdventureWorks2014. You may change this to another database or remove it altogether if you don’t expect too much noise from other databases. The results will look like this:
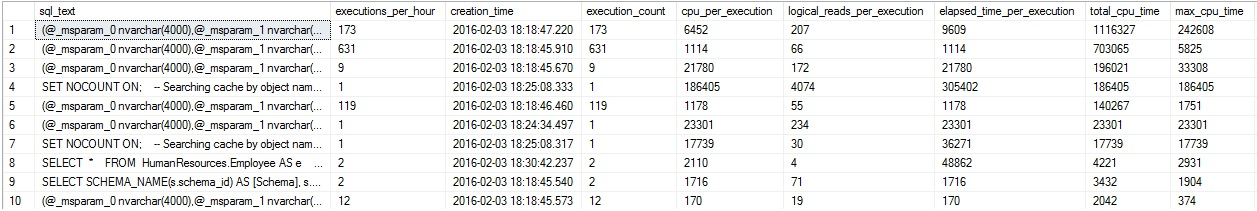
If we scroll over to the right, the last column provides the execution plans for our results. We’ll open the execution plan for the query against HumanResources.Employee on line 8 of the result set:
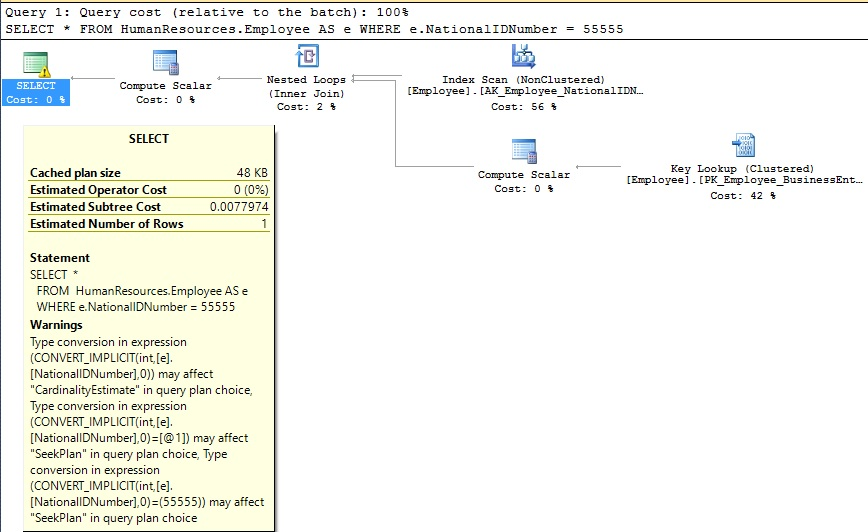
We can verify in the properties of the SELECT statement that an implicit conversion took place on NationalIDNumber. If we found this sort of query in a production environment, we could track it down and adjust the source to reference this column as a string, rather than a numeric value, which would resolve the implicit conversion, improve the execution plan, and improve performance.
As easily as we searched for implicit conversions, we could also check for TempDB spills, which may indicate overly large sorts, hash joins, or poorly written TSQL leading to a similar situation. We could then write another query to check for joins without a join predicate, or columns with no statistics, or any other warning we can dream up. Instead of writing a dozen queries, let’s use a single one to check for all warnings:
|
1 2 3 4 5 6 7 8 9 10 11 12 13 14 15 16 17 18 19 20 21 22 23 24 25 26 27 |
;WITH XMLNAMESPACES (DEFAULT 'http://schemas.microsoft.com/sqlserver/2004/07/showplan') SELECT dm_exec_sql_text.text AS sql_text, CAST(CAST(dm_exec_query_stats.execution_count AS DECIMAL) / CAST((CASE WHEN DATEDIFF(HOUR, dm_exec_query_stats.creation_time, CURRENT_TIMESTAMP) = 0 THEN 1 ELSE DATEDIFF(HOUR, dm_exec_query_stats.creation_time, CURRENT_TIMESTAMP) END) AS DECIMAL) AS INT) AS executions_per_hour, dm_exec_query_stats.creation_time, dm_exec_query_stats.execution_count, CAST(CAST(dm_exec_query_stats.total_worker_time AS DECIMAL)/CAST(dm_exec_query_stats.execution_count AS DECIMAL) AS INT) as cpu_per_execution, CAST(CAST(dm_exec_query_stats.total_logical_reads AS DECIMAL)/CAST(dm_exec_query_stats.execution_count AS DECIMAL) AS INT) as logical_reads_per_execution, CAST(CAST(dm_exec_query_stats.total_elapsed_time AS DECIMAL)/CAST(dm_exec_query_stats.execution_count AS DECIMAL) AS INT) as elapsed_time_per_execution, dm_exec_query_stats.total_worker_time AS total_cpu_time, dm_exec_query_stats.max_worker_time AS max_cpu_time, dm_exec_query_stats.total_elapsed_time, dm_exec_query_stats.max_elapsed_time, dm_exec_query_stats.total_logical_reads, dm_exec_query_stats.max_logical_reads, dm_exec_query_stats.total_physical_reads, dm_exec_query_stats.max_physical_reads, dm_exec_query_plan.query_plan FROM sys.dm_exec_query_stats CROSS APPLY sys.dm_exec_sql_text(dm_exec_query_stats.sql_handle) CROSS APPLY sys.dm_exec_query_plan(dm_exec_query_stats.plan_handle) WHERE query_plan.exist('//Warnings') = 1 AND query_plan.exist('//ColumnReference[@Database = "[AdventureWorks2014]"]') = 1 ORDER BY dm_exec_query_stats.total_worker_time DESC; |
This is virtually identical to our last query plan cache search, except that we have broadened our search to check for the existence of any warnings, rather than just implicit conversions.
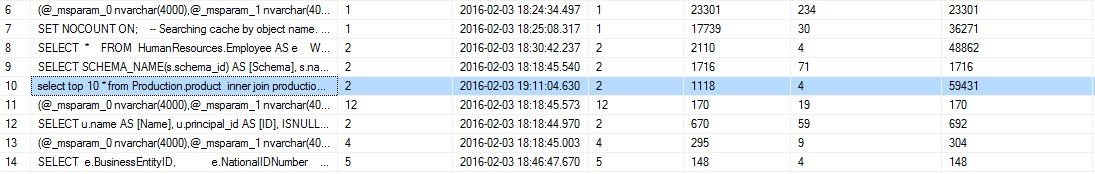
The highlighted row is new, and checking the execution plan reveals the problem:
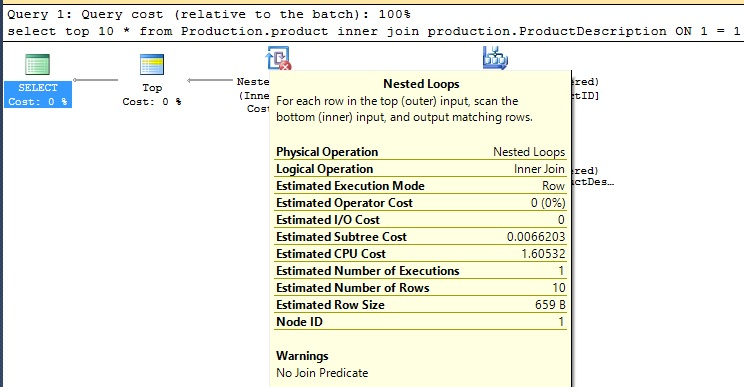
I wrote some pretty lousy TSQL there, joining two Production tables on 1 = 1, which leads to a very glaring warning: “No Join Predicate”. Typically, this is the sort of warning you won’t discover until a user complains that an application is slow. With the ability to periodically search the cache, we can proactively find these warnings, or worst case scenario, quickly identify them after someone has complained to you.
How about one final dive into the plan cache? This time, we’ll identify any queries that resulted in a table scan or clustered index scan:
|
1 2 3 4 5 6 7 8 9 10 11 12 13 14 15 16 17 18 19 20 21 22 23 24 25 26 27 28 |
;WITH XMLNAMESPACES (DEFAULT 'http://schemas.microsoft.com/sqlserver/2004/07/showplan') SELECT dm_exec_sql_text.text AS sql_text, CAST(CAST(dm_exec_query_stats.execution_count AS DECIMAL) / CAST((CASE WHEN DATEDIFF(HOUR, dm_exec_query_stats.creation_time, CURRENT_TIMESTAMP) = 0 THEN 1 ELSE DATEDIFF(HOUR, dm_exec_query_stats.creation_time, CURRENT_TIMESTAMP) END) AS DECIMAL) AS INT) AS executions_per_hour, dm_exec_query_stats.creation_time, dm_exec_query_stats.execution_count, CAST(CAST(dm_exec_query_stats.total_worker_time AS DECIMAL)/CAST(dm_exec_query_stats.execution_count AS DECIMAL) AS INT) as cpu_per_execution, CAST(CAST(dm_exec_query_stats.total_logical_reads AS DECIMAL)/CAST(dm_exec_query_stats.execution_count AS DECIMAL) AS INT) as logical_reads_per_execution, CAST(CAST(dm_exec_query_stats.total_elapsed_time AS DECIMAL)/CAST(dm_exec_query_stats.execution_count AS DECIMAL) AS INT) as elapsed_time_per_execution, dm_exec_query_stats.total_worker_time AS total_cpu_time, dm_exec_query_stats.max_worker_time AS max_cpu_time, dm_exec_query_stats.total_elapsed_time, dm_exec_query_stats.max_elapsed_time, dm_exec_query_stats.total_logical_reads, dm_exec_query_stats.max_logical_reads, dm_exec_query_stats.total_physical_reads, dm_exec_query_stats.max_physical_reads, dm_exec_query_plan.query_plan FROM sys.dm_exec_query_stats CROSS APPLY sys.dm_exec_sql_text(dm_exec_query_stats.sql_handle) CROSS APPLY sys.dm_exec_query_plan(dm_exec_query_stats.plan_handle) WHERE (query_plan.exist('//RelOp[@PhysicalOp = "Index Scan"]') = 1 OR query_plan.exist('//RelOp[@PhysicalOp = "Clustered Index Scan"]') = 1) AND query_plan.exist('//ColumnReference[@Database = "[AdventureWorks2014]"]') = 1 ORDER BY dm_exec_query_stats.total_worker_time DESC; |
Once again, our query is very similar to earlier, the only difference being that we are checking the query plan for the existence of any scans. We could easily pare the results down further by table, index, or other metrics, if too many rows were returned. Below is some sample output from my local SQL Server:
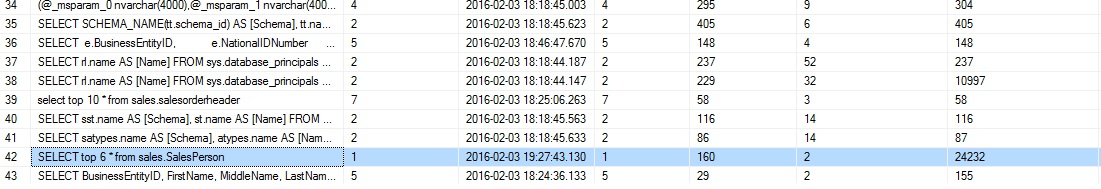
Row 42 looks like an obvious offender. We can check the execution plan and verify that a clustered index scan indeed occurred:
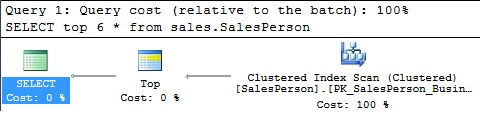
This, like the many other execution plans returned, will have some sort of scan that may be worth investigating further.
In addition to searching through the cache for specific queries or operators, we can also aggregate this data and determine some other useful metrics, such as:
- How much of the plan cache is used by each database?
- How large is the plan cache currently?
- What are the largest plans in the cache?
- What percentage of the plan cache is the result of queries against a particular table or index?
This information can provide insight into our SQL Server’s memory usage and identify groups of queries that are memory hogs. Very large execution plans can be indicative of poorly performing queries as well, though further research is required to confirm this. Either way, we can be given some direction when trying to improve memory usage or find specific execution plans.
Let’s start with a quick list of our largest plans in the plan cache. These will typically be queries on a large number of objects, those with a large amount of text, or some hefty XML operations.
|
1 2 3 4 5 6 7 8 9 10 11 12 13 14 |
SELECT dm_exec_sql_text.text, dm_exec_cached_plans.objtype, dm_exec_cached_plans.size_in_bytes, dm_exec_query_plan.query_plan FROM sys.dm_exec_cached_plans CROSS APPLY sys.dm_exec_sql_text(dm_exec_cached_plans.plan_handle) CROSS APPLY sys.dm_exec_query_plan(dm_exec_cached_plans.plan_handle) WHERE dm_exec_cached_plans.cacheobjtype = N'Compiled Plan' AND dm_exec_cached_plans.objtype IN(N'Adhoc', N'Prepared') AND dm_exec_cached_plans.usecounts = 1 ORDER BY dm_exec_cached_plans.size_in_bytes DESC; |
Running this query on my local server reveals one execution plan that is about 1.75MB, and quite a few that range between 200KB and 800KB:
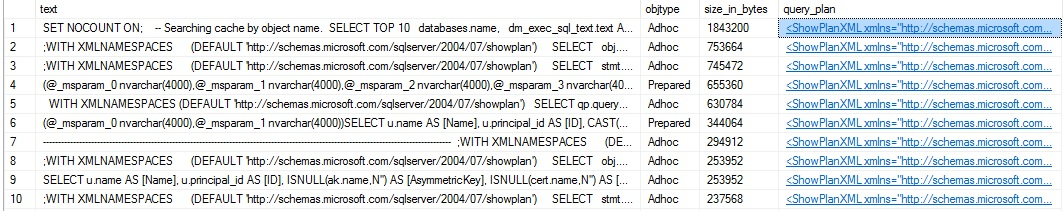
Clicking on that top plan reveals that it was not a single query that makes up the plan, but 14 queries all in the same batch. All of these are test queries that were run while searching the plan cache. If you’re running queries against production environments in order to learn about cache utilization, you may want to filter out the queries in this article as they will add noise to your result set. Adding in a comment with unique text is a good way to tag the query and filter it out later using a WHERE clause on dm_exec_sql_text.text. Percentages could also be added to this query to show the percent of the total cache taken up by any given query.
Getting the total cache size is relatively straightforward, and can be done with a single summation against dm_exec_cached_plans:
|
1 2 3 4 5 6 7 8 |
SELECT SUM(CAST(dm_exec_cached_plans.size_in_bytes AS BIGINT)) / 1024 AS size_in_KB FROM sys.dm_exec_cached_plans WHERE dm_exec_cached_plans.cacheobjtype = N'Compiled Plan' AND dm_exec_cached_plans.objtype IN(N'Adhoc', N'Prepared') AND dm_exec_cached_plans.usecounts = 1; |
Note the CAST into a BIGINT. Since the size_in_bytes column is an INT, if a sum of it were to exceed the maximum value an INT can have (2^31 – 1), then an error would be thrown as SQL Server would be unable to automatically cast it as a BIGINT. The result is returned quickly and is easy enough to read:
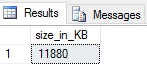
In the case of my local server, the plan cache is currently using 11,880KB (11.6MB). On a larger production server, this value would be significantly higher. Keep in mind that the cache cannot “fill up”. When memory pressure occurs, older or less used plans are cleared from the plan cache automatically. We can easily check what the average age of an execution plan is based on this query:
|
1 2 3 4 5 6 7 8 9 10 |
SELECT AVG(DATEDIFF(HOUR, dm_exec_query_stats.creation_time, CURRENT_TIMESTAMP)) AS average_create_time FROM sys.dm_exec_query_stats CROSS APPLY sys.dm_exec_sql_text(dm_exec_query_stats.plan_handle) CROSS APPLY sys.dm_exec_query_plan(dm_exec_query_stats.plan_handle) INNER JOIN sys.databases ON dm_exec_sql_text.dbid = databases.database_id WHERE databases.name = 'AdventureWorks2014' |
In this case, the answer is 19 hours:
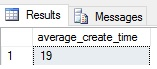
Of course, this metric is meaningless on its own and would only become useful when trended over a long period of time. Server restarts, index rebuilds, and other maintenance could reduce this number as well, so correct trending of this metric is needed to make any worthwhile use of it.
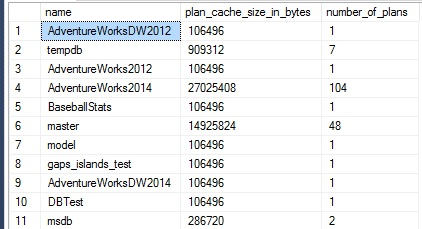
How about a breakdown of plan cache usage by database? The following query aggregates data and returns space used and counts for all database on my server:
|
1 2 3 4 5 6 7 8 9 10 11 12 13 |
SELECT databases.name, SUM(CAST(dm_exec_cached_plans.size_in_bytes AS BIGINT)) AS plan_cache_size_in_bytes, COUNT(*) AS number_of_plans FROM sys.dm_exec_query_stats query_stats CROSS APPLY sys.dm_exec_query_plan(plan_handle) AS query_plan INNER JOIN sys.databases ON databases.database_id = query_plan.dbid INNER JOIN sys.dm_exec_cached_plans ON dm_exec_cached_plans.plan_handle = query_stats.plan_handle GROUP BY databases.name |
The results show that AdventureWorks2014 is the heaviest used in both space used and quantity:
Last, but not least, we can collect the number of plans (and total space used) for any given index as follows:
|
1 2 3 4 5 6 7 8 9 10 11 12 13 |
DECLARE @index_name AS NVARCHAR(128) = '[PK_SalesOrderHeader_SalesOrderID]'; ;WITH XMLNAMESPACES (DEFAULT 'http://schemas.microsoft.com/sqlserver/2004/07/showplan') SELECT SUM(CAST(dm_exec_cached_plans.size_in_bytes AS BIGINT)) AS plan_cache_size_in_bytes, COUNT(*) AS number_of_plans FROM sys.dm_exec_cached_plans CROSS APPLY sys.dm_exec_query_plan(plan_handle) CROSS APPLY query_plan.nodes('/ShowPlanXML/BatchSequence/Batch/Statements/StmtSimple') AS nodes(stmt) CROSS APPLY stmt.nodes('.//IndexScan/Object[@Index=sql:variable("@index_name")]') AS index_object(obj) |
The results are as follows:
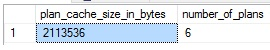
In the plan cache are a total of six execution plans that use the primary key on Sales.SalesOrderHeader, which add up to about 2MB.
But wait, is there more?
There are many other metrics that can be gleaned from the plan cache, a large number of which will be created based on the needs of your own database environment. Depending on how TSQL is created and used, the plan cache will look differently. If a business relies heavily on ORMs in order to generate TSQL, then there will be many more plans in cache, and likely a lower plan age. Ad-hoc queries will perform similarly, though at least have some control from developers to ensure that there are not too many columns selected or too many tables joined. An environment that relies heavily on stored procedures or other parametrized queries will tend to see less distinct queries in cache and plans that last longer.
These are just a few examples of how development tools and querying techniques can affect the plan cache. The best way to become familiar with yours is to dive in, research, and determine how it is used where you are. Take what is presented here and run with it. Write your own all-star queries and be sure to share with me when you’re done 🙂
SQL Server 2016 Query Store
New to SQL Server 2016 is the Query Store: A feature that adds a huge amount of insight into how queries are executed, how they are performing, and allows for easy research into the best ways to improve them. The Query Store provides an alternate way to dig into the query plan cache and see execution plans, query text, and do so without the worries of plans leaving cache before you get to them.
That being said, the Query Store is still in a preview version of SQL Server 2016 (CTP 3.3 at last check). Several articles have been written on the topic, and I recommend taking a look at them:
Intro to the Query Store w/ Configuration Info: Query Store – the next generation tool for every DBA
Example Queries and Usage of the Query Store: The SQL Server Query Store in action
Conclusion
The query plan cache is not exposed to us easily in SQL Server, but the many views available to us allow quite a bit of in-depth research into the queries that have run recently and how they have performed. This data can provide valuable insight into more metrics than I could ever list in this article.
Use the queries provided here as a starting point and customize/extend them to meet your needs. Anything found in the query text, execution plans, or query stats can be analyzed, and any of these can be aggregated based on any relevant database object. With these capabilities, we can not only search for plans, but analyze and trend usage, locating problems over time and fixing them as needed.

In his free time, Ed enjoys video games, sci-fi & fantasy, traveling, and being as big of a geek as his friends will tolerate.
View all posts by Ed Pollack
- SQL Server Database Metrics - October 2, 2019
- Using SQL Server Database Metrics to Predict Application Problems - September 27, 2019
- SQL Injection: Detection and prevention - August 30, 2019