
When we talk about memory usage in SQL Server, we are often referring to the buffer cache. This is an important part of SQL Server’s architecture and is responsible for the ability to query frequently accessed data extremely fast. Knowing how the buffer cache works will allow us to properly allocate memory in SQL Server, gauge accurately how databases are accessing data, and ensure that there are not inefficiencies in our code that cause excessive data to be cached.
What is in the buffer cache?
Hard disks are slow; memory is fast. This is a fact of nature for anyone that works with computers. Even SSDs are slow when compared to high-performance memory. The way in which software deals with this problem is to write data from slow storage into fast memory. Once loaded, your favorite apps can perform very fast and only need to go back to disk when new data is needed. This fact of life in computing is also an important part of SQL Server architecture.
Whenever data is written to or read from a SQL Server database, it will be copied into memory by the buffer manager. The buffer cache (also known as the buffer pool) will use as much memory as is allocated to it in order to hold as many pages of data as possible. When the buffer cache fills up, older and less used data will be purged in order to make room for newer data.
Data is stored in 8k pages within the buffer cache and can be referred to as “clean” or “dirty” pages. A dirty page is one that has been changed since last being written to disk and is the result of a write operation against that index or table data. Clean pages are those that have not changed, and the data within them still matches what is on disk. Checkpoints are automatically issued in the background by SQL Server that will write dirty pages to disk in order to create a known good restore point in the event of a crash or other unfortunate server situation.
You can see an overview of the current state of memory usage in SQL Server by checking the sys.dm_os_sys_info DMV:
|
1 2 3 4 5 6 7 8 |
SELECT physical_memory_kb, virtual_memory_kb, committed_kb, committed_target_kb FROM sys.dm_os_sys_info; |
The results of this query tell me a bit about memory usage on my server:

Here are what the columns mean:
physical_memory_kb: Total physical memory installed on the server.
virtual_memory_kb: Total amount of virtual memory available to SQL Server. Ideally, we do not want to utilize this often as virtual memory (using a page file on disk or somewhere that isn’t memory) is going to be significantly slower than a memory.
Committed_kb: The amount of memory currently allocated by the buffer cache for use by database pages.
Committed_target_kb: This is the amount of memory the buffer cache “wants” to use. If the amount currently in use (indicated by committed_kb) is higher than this amount, then the buffer manager will begin to remove older pages from memory. If the amount currently in use is lower then the buffer manager will allocate more memory for our data.
Memory use is critical to SQL Server performance—if there isn’t enough memory available to service our common queries, then we’ll spend far more resources reading data from disk, only to have it thrown away and read again later.
How can we use buffer cache metrics?
We can access information about the buffer cache using the dynamic management view sys.dm_os_buffer_descriptors, which provides everything you’ve ever wanted to know about the data stored in memory by SQL Server, but were afraid to ask. Within this view, you’ll find a single row per buffer descriptor, which uniquely identifies, and provides some information about each page in memory. Note that on a server with large databases, it may take a bit of time to query this view.
A useful metric that is easy to get is a measure of buffer cache usage by database on the server:
|
1 2 3 4 5 6 7 8 9 10 |
SELECT databases.name AS database_name, COUNT(*) * 8 / 1024 AS mb_used FROM sys.dm_os_buffer_descriptors INNER JOIN sys.databases ON databases.database_id = dm_os_buffer_descriptors.database_id GROUP BY databases.name ORDER BY COUNT(*) DESC; |
This query returns, in order from most pages in memory to fewest, the amount of memory consumed by each database in the buffer cache:
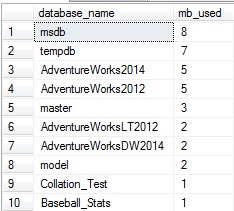
My local server isn’t terribly exciting right now…but if I were to jump in and run an assortment of queries against AdventureWorks2014, we could run our query from above again to verify the impact it had on the buffer cache:
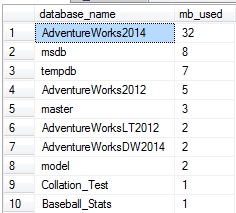
While I didn’t go too crazy here, my random querying did increase the amount of data in the buffer cache for AdventureWorks2014 by 27MB. This query can be a useful way to quickly determine which database accounts for the most memory usage in the buffer cache. On a multi-tenant architecture, or a server in which there are many key databases sharing resources, this can be a quick method to find a database that is performing poorly or hogging memory at any given time.
Similarly, we can view overall totals as a page or byte count:
|
1 2 3 4 5 6 |
SELECT COUNT(*) AS buffer_cache_pages, COUNT(*) * 8 / 1024 AS buffer_cache_used_MB FROM sys.dm_os_buffer_descriptors; |
This returns a single row containing the number of pages in the buffer cache, as well as the memory consumed by them:
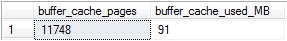
Since a page is 8KB, we can convert the number of pages into megabytes by multiplying by 8 to get KB, and then divide by 1024 to arrive at MB.
We can subdivide this further and look at how the buffer cache is used by specific objects. This can provide much more insight into memory usage as we can determine what tables are memory hogs. In addition, we can verify some interesting metrics, such as what percentage of a table is in memory currently, or what tables are infrequently (or not) used. The following query will return buffer pages and size by table:
|
1 2 3 4 5 6 7 8 9 10 11 12 13 14 15 16 17 18 19 20 21 |
SELECT objects.name AS object_name, objects.type_desc AS object_type_description, COUNT(*) AS buffer_cache_pages, COUNT(*) * 8 / 1024 AS buffer_cache_used_MB FROM sys.dm_os_buffer_descriptors INNER JOIN sys.allocation_units ON allocation_units.allocation_unit_id = dm_os_buffer_descriptors.allocation_unit_id INNER JOIN sys.partitions ON ((allocation_units.container_id = partitions.hobt_id AND type IN (1,3)) OR (allocation_units.container_id = partitions.partition_id AND type IN (2))) INNER JOIN sys.objects ON partitions.object_id = objects.object_id WHERE allocation_units.type IN (1,2,3) AND objects.is_ms_shipped = 0 AND dm_os_buffer_descriptors.database_id = DB_ID() GROUP BY objects.name, objects.type_desc ORDER BY COUNT(*) DESC; |
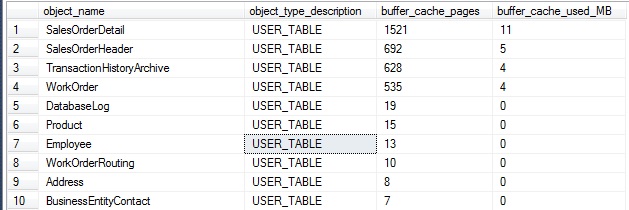
System tables are excluded, and this will only pull data for the current database. Indexed views will be included as their indexes are distinct entities from the tables they are derived from. The join on sys.partitions contains two parts in order to account for indexes, as well as heaps. The data shown here include all indexes on a table, as well as the heap if there are none defined.
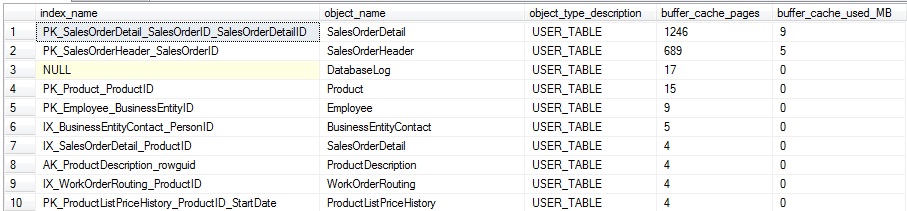
A segment of the results of this are as follows (for AdventureWorks2014):
Similarly, we can split out this data by index, instead of by table, providing even further granularity on buffer cache usage:
|
1 2 3 4 5 6 7 8 9 10 11 12 13 14 15 16 17 18 19 20 21 22 23 24 25 26 |
SELECT indexes.name AS index_name, objects.name AS object_name, objects.type_desc AS object_type_description, COUNT(*) AS buffer_cache_pages, COUNT(*) * 8 / 1024 AS buffer_cache_used_MB FROM sys.dm_os_buffer_descriptors INNER JOIN sys.allocation_units ON allocation_units.allocation_unit_id = dm_os_buffer_descriptors.allocation_unit_id INNER JOIN sys.partitions ON ((allocation_units.container_id = partitions.hobt_id AND type IN (1,3)) OR (allocation_units.container_id = partitions.partition_id AND type IN (2))) INNER JOIN sys.objects ON partitions.object_id = objects.object_id INNER JOIN sys.indexes ON objects.object_id = indexes.object_id AND partitions.index_id = indexes.index_id WHERE allocation_units.type IN (1,2,3) AND objects.is_ms_shipped = 0 AND dm_os_buffer_descriptors.database_id = DB_ID() GROUP BY indexes.name, objects.name, objects.type_desc ORDER BY COUNT(*) DESC; |
This query is almost the same as our last, except that we make one additional join to sys.indexes, and group on the index name, in addition to the table/view name. The results provide even more detail on how the buffer cache is being used, and can be valuable on tables with many indexes of varied use:
The results can be useful when trying to determine the overall level of usage for a specific index at any given time. In addition, it allows us to gauge how much of an index is being read, compared to its overall size.
To collect the percentage of each table that is in memory, we can put that query into a CTE and compare the pages in memory vs the total for each table:
|
1 2 3 4 5 6 7 8 9 10 11 12 13 14 15 16 17 18 19 20 21 22 23 24 25 26 27 28 29 30 31 32 33 34 35 36 37 38 39 40 41 42 43 44 |
WITH CTE_BUFFER_CACHE AS ( SELECT objects.name AS object_name, objects.type_desc AS object_type_description, objects.object_id, COUNT(*) AS buffer_cache_pages, COUNT(*) * 8 / 1024 AS buffer_cache_used_MB FROM sys.dm_os_buffer_descriptors INNER JOIN sys.allocation_units ON allocation_units.allocation_unit_id = dm_os_buffer_descriptors.allocation_unit_id INNER JOIN sys.partitions ON ((allocation_units.container_id = partitions.hobt_id AND type IN (1,3)) OR (allocation_units.container_id = partitions.partition_id AND type IN (2))) INNER JOIN sys.objects ON partitions.object_id = objects.object_id WHERE allocation_units.type IN (1,2,3) AND objects.is_ms_shipped = 0 AND dm_os_buffer_descriptors.database_id = DB_ID() GROUP BY objects.name, objects.type_desc, objects.object_id) SELECT PARTITION_STATS.name, CTE_BUFFER_CACHE.object_type_description, CTE_BUFFER_CACHE.buffer_cache_pages, CTE_BUFFER_CACHE.buffer_cache_used_MB, PARTITION_STATS.total_number_of_used_pages, PARTITION_STATS.total_number_of_used_pages * 8 / 1024 AS total_mb_used_by_object, CAST((CAST(CTE_BUFFER_CACHE.buffer_cache_pages AS DECIMAL) / CAST(PARTITION_STATS.total_number_of_used_pages AS DECIMAL) * 100) AS DECIMAL(5,2)) AS percent_of_pages_in_memory FROM CTE_BUFFER_CACHE INNER JOIN ( SELECT objects.name, objects.object_id, SUM(used_page_count) AS total_number_of_used_pages FROM sys.dm_db_partition_stats INNER JOIN sys.objects ON objects.object_id = dm_db_partition_stats.object_id WHERE objects.is_ms_shipped = 0 GROUP BY objects.name, objects.object_id) PARTITION_STATS ON PARTITION_STATS.object_id = CTE_BUFFER_CACHE.object_id ORDER BY CAST(CTE_BUFFER_CACHE.buffer_cache_pages AS DECIMAL) / CAST(PARTITION_STATS.total_number_of_used_pages AS DECIMAL) DESC; |
This query joins our previous data set with a query on sys.dm_db_partition_stats in order to compare what’s currently in the buffer cache vs. the total space used by any given table. The various CAST operations at the end help to avoid truncation and make the final result in a form that is easy to read. The results on my local server are as follows:
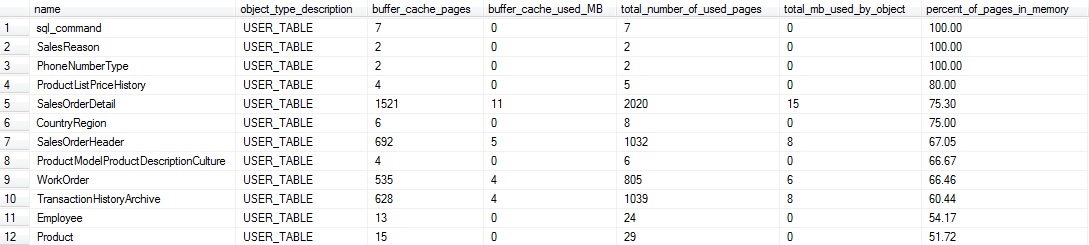
This data can tell us which tables are hot spots in our database, and with some knowledge of their application usage, we can determine which ones simply have too much data residing in memory. Small tables are probably not very important to us here. For example, the top four in the output above are under a megabyte, and if we wanted to omit them, we could filter the results to only return tables larger than a specific size of interest.
On the other hand, this data tells us that 3/4 of SalesOrderDetail is in the buffer cache. If this seemed unusual, I’d consult the query plan cache and determine if there are any inefficient queries on the table that are selecting *, or an overly large amount of data. By combining our metrics from the buffer cache and plan cache, we can devise new ways of pinpointing bad queries or applications that are pulling far more data than they require.
This query can be modified to provide the percentage of an index that is being used as well, similar to how we collected the percentage of a table used:
|
1 2 3 4 5 6 7 8 9 10 11 12 13 14 15 16 17 18 19 20 21 22 23 24 25 26 27 28 29 |
SELECT indexes.name AS index_name, objects.name AS object_name, objects.type_desc AS object_type_description, COUNT(*) AS buffer_cache_pages, COUNT(*) * 8 / 1024 AS buffer_cache_used_MB, SUM(allocation_units.used_pages) AS pages_in_index, SUM(allocation_units.used_pages) * 8 /1024 AS total_index_size_MB, CAST((CAST(COUNT(*) AS DECIMAL) / CAST(SUM(allocation_units.used_pages) AS DECIMAL) * 100) AS DECIMAL(5,2)) AS percent_of_pages_in_memory FROM sys.dm_os_buffer_descriptors INNER JOIN sys.allocation_units ON allocation_units.allocation_unit_id = dm_os_buffer_descriptors.allocation_unit_id INNER JOIN sys.partitions ON ((allocation_units.container_id = partitions.hobt_id AND type IN (1,3)) OR (allocation_units.container_id = partitions.partition_id AND type IN (2))) INNER JOIN sys.objects ON partitions.object_id = objects.object_id INNER JOIN sys.indexes ON objects.object_id = indexes.object_id AND partitions.index_id = indexes.index_id WHERE allocation_units.type IN (1,2,3) AND objects.is_ms_shipped = 0 AND dm_os_buffer_descriptors.database_id = DB_ID() GROUP BY indexes.name, objects.name, objects.type_desc ORDER BY CAST((CAST(COUNT(*) AS DECIMAL) / CAST(SUM(allocation_units.used_pages) AS DECIMAL) * 100) AS DECIMAL(5,2)) DESC; |
Since sys.allocation_units provides some size info on our indexes, we avoid the need for the additional CTE and data set from dm_db_partition_stats. Here is a slice of the results, showing index size (MB and pages) and buffer cache space used (MB and pages):
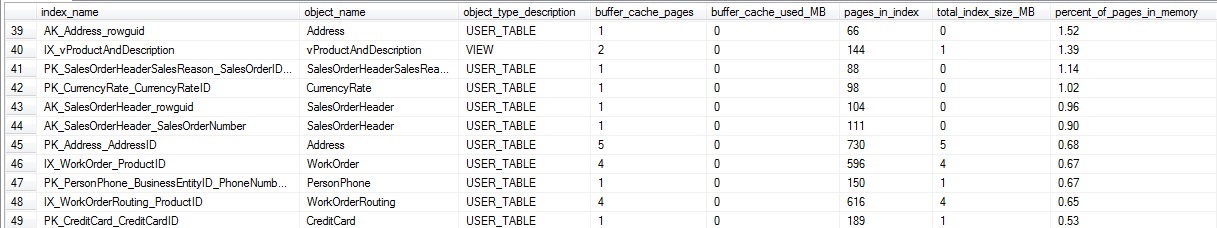
If we were uninterested in small tables/indexes, we could add a HAVING clause to the query in order to filter by an index that is smaller than a specific size, in MB or in pages. This data provides a nice view into the efficiency of queries on specific indexes and could assist in index cleanup, index tuning, or some more granular tuning of memory usage on your SQL Server.
An interesting column in dm_os_buffer_descriptors is the free_space_in_bytes column. This tells us how full each page in the buffer cache is, and therefore provides an indicator of potential wasted space or inefficiency. We can determine the percentage of pages that are taken up by free space, rather than data, for each database on our server:
|
1 2 3 4 5 6 7 8 9 10 11 12 13 14 15 16 17 |
WITH CTE_BUFFER_CACHE AS ( SELECT databases.name AS database_name, COUNT(*) AS total_number_of_used_pages, CAST(COUNT(*) * 8 AS DECIMAL) / 1024 AS buffer_cache_total_MB, CAST(CAST(SUM(CAST(dm_os_buffer_descriptors.free_space_in_bytes AS BIGINT)) AS DECIMAL) / (1024 * 1024) AS DECIMAL(20,2)) AS buffer_cache_free_space_in_MB FROM sys.dm_os_buffer_descriptors INNER JOIN sys.databases ON databases.database_id = dm_os_buffer_descriptors.database_id GROUP BY databases.name) SELECT *, CAST((buffer_cache_free_space_in_MB / NULLIF(buffer_cache_total_MB, 0)) * 100 AS DECIMAL(5,2)) AS buffer_cache_percent_free_space FROM CTE_BUFFER_CACHE ORDER BY buffer_cache_free_space_in_MB / NULLIF(buffer_cache_total_MB, 0) DESC |
This returns a row per database showing the aggregate of free space per database, summed across all pages in the buffer cache for that particular database:
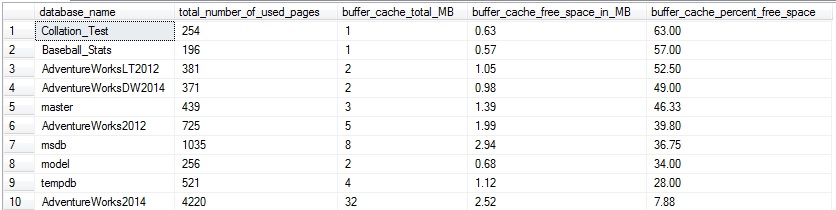
This is interesting, but not too useful yet as these results are not very targeted. They tell us a database may have some wasted space, but not much about what tables are the culprit. Let’s take the same approach we previously did and return free space per table in a given database:
|
1 2 3 4 5 6 7 8 9 10 11 12 13 14 15 16 17 18 19 20 21 22 23 24 25 |
SELECT objects.name AS object_name, objects.type_desc AS object_type_description, COUNT(*) AS buffer_cache_pages, CAST(COUNT(*) * 8 AS DECIMAL) / 1024 AS buffer_cache_total_MB, CAST(SUM(CAST(dm_os_buffer_descriptors.free_space_in_bytes AS BIGINT)) AS DECIMAL) / 1024 / 1024 AS buffer_cache_free_space_in_MB, CAST((CAST(SUM(CAST(dm_os_buffer_descriptors.free_space_in_bytes AS BIGINT)) AS DECIMAL) / 1024 / 1024) / (CAST(COUNT(*) * 8 AS DECIMAL) / 1024) * 100 AS DECIMAL(5,2)) AS buffer_cache_percent_free_space FROM sys.dm_os_buffer_descriptors INNER JOIN sys.allocation_units ON allocation_units.allocation_unit_id = dm_os_buffer_descriptors.allocation_unit_id INNER JOIN sys.partitions ON ((allocation_units.container_id = partitions.hobt_id AND type IN (1,3)) OR (allocation_units.container_id = partitions.partition_id AND type IN (2))) INNER JOIN sys.objects ON partitions.object_id = objects.object_id WHERE allocation_units.type IN (1,2,3) AND objects.is_ms_shipped = 0 AND dm_os_buffer_descriptors.database_id = DB_ID() GROUP BY objects.name, objects.type_desc, objects.object_id HAVING COUNT(*) > 0 ORDER BY COUNT(*) DESC; |
This returns a row per table or indexed view that has at least one page in the buffer cache, ordered by those with the most pages in memory first.
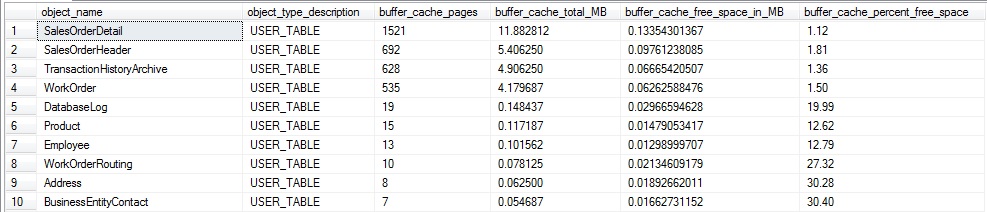
As with our previous example, small tables can be ignored as their impact on buffer cache memory consumption will be negligible. Our top four tables have very small amounts of free space (under 2% each).
What does this mean exactly? The more free space per page on average, the more pages need to be read in order to return the data that we’re looking for. In addition, more pages are required to store data, meaning more space in memory and on disk is required to maintain our data. Wasted space also means more IOs to get the data we need and queries running longer than needed as this data is retrieved.
The most common cause of a glut on free space are tables with very wide rows. Since a page is 8k, if a row happened to be 5k, we would never be able to fit a single row onto a page, and there would always be that extra ~3k of free space that cannot be used. Tables with lots of random insert operations can be problematic as well. For example, a non-increasing key may result in page splits as data is written out-of-order. A GUID would be the worst case scenario, but any keys that are not increasing in nature can result in this problem to some extent.
As indexes become fragmented over time, the fragmentation would be seen partly as excess free space when we look at the contents of the buffer cache. Most of these problems are solved with smart database design and sensible database maintenance. This isn’t the place to go into detail on those topics, but there are many articles and presentations on these topics out there for your enjoyment.
Early on in this article, we briefly discussed what dirty and clean pages are and their correlation to write operations within a database. Within dm_os_buffer_descriptors we can verify whether a page is clean or not using the is_modified column. This tells us if a page has been modified by a write operation, but has yet to be written back to disk. We can use this information to count the clean vs. dirty pages in the buffer cache for a given database:
|
1 2 3 4 5 6 7 8 9 10 11 12 13 14 15 16 17 18 19 20 21 22 23 24 25 |
SELECT databases.name AS database_name, COUNT(*) AS buffer_cache_total_pages, SUM(CASE WHEN dm_os_buffer_descriptors.is_modified = 1 THEN 1 ELSE 0 END) AS buffer_cache_dirty_pages, SUM(CASE WHEN dm_os_buffer_descriptors.is_modified = 1 THEN 0 ELSE 1 END) AS buffer_cache_clean_pages, SUM(CASE WHEN dm_os_buffer_descriptors.is_modified = 1 THEN 1 ELSE 0 END) * 8 / 1024 AS buffer_cache_dirty_page_MB, SUM(CASE WHEN dm_os_buffer_descriptors.is_modified = 1 THEN 0 ELSE 1 END) * 8 / 1024 AS buffer_cache_clean_page_MB FROM sys.dm_os_buffer_descriptors INNER JOIN sys.databases ON dm_os_buffer_descriptors.database_id = databases.database_id GROUP BY databases.name; |
This query returns page counts and the data size in MB:
My server doesn’t have too much going on at the moment. If I were to run a big update statement, we could illustrate what we would see when more write operations are going on. Let’s run the following query:
|
1 2 3 4 |
UPDATE Sales.SalesOrderDetail SET OrderQty = OrderQty |
This is essentially a no-op, and will not result in any actual change to the SalesOrderDetail table—but SQL Server will still go through the trouble of updating every row in the table for this particular column. If we run the dirty/clean page count from above, we’ll get some more interesting results:
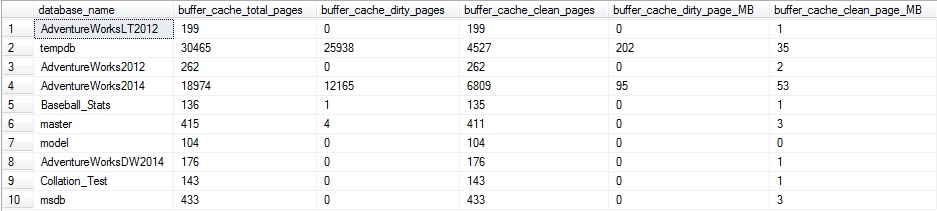
About 2/3 of the pages for AdventureWorks2014 in the buffer cache are dirty. In addition, TempDB also has quite a bit of activity, which is indicative of the update/insert/delete trigger on the table, which caused a large amount of additional TSQL to be executed. The trigger caused there to be quite a few additional reads against AdventureWorks2014, as well as the need for worktable space in TempDB to process those additional operations.
As with before, we can break this out by table or index in order to collect more granular data on buffer cache usage:
|
1 2 3 4 5 6 7 8 9 10 11 12 13 14 15 16 17 18 19 20 21 22 23 24 25 26 27 28 29 30 31 32 33 34 35 36 37 38 39 40 41 |
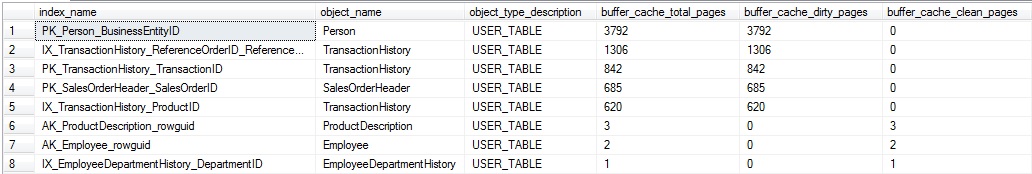
SELECT indexes.name AS index_name, objects.name AS object_name, objects.type_desc AS object_type_description, COUNT(*) AS buffer_cache_total_pages, SUM(CASE WHEN dm_os_buffer_descriptors.is_modified = 1 THEN 1 ELSE 0 END) AS buffer_cache_dirty_pages, SUM(CASE WHEN dm_os_buffer_descriptors.is_modified = 1 THEN 0 ELSE 1 END) AS buffer_cache_clean_pages, SUM(CASE WHEN dm_os_buffer_descriptors.is_modified = 1 THEN 1 ELSE 0 END) * 8 / 1024 AS buffer_cache_dirty_page_MB, SUM(CASE WHEN dm_os_buffer_descriptors.is_modified = 1 THEN 0 ELSE 1 END) * 8 / 1024 AS buffer_cache_clean_page_MB FROM sys.dm_os_buffer_descriptors INNER JOIN sys.allocation_units ON allocation_units.allocation_unit_id = dm_os_buffer_descriptors.allocation_unit_id INNER JOIN sys.partitions ON ((allocation_units.container_id = partitions.hobt_id AND type IN (1,3)) OR (allocation_units.container_id = partitions.partition_id AND type IN (2))) INNER JOIN sys.objects ON partitions.object_id = objects.object_id INNER JOIN sys.indexes ON objects.object_id = indexes.object_id AND partitions.index_id = indexes.index_id WHERE allocation_units.type IN (1,2,3) AND objects.is_ms_shipped = 0 AND dm_os_buffer_descriptors.database_id = DB_ID() GROUP BY indexes.name, objects.name, objects.type_desc ORDER BY COUNT(*) DESC; |
The results show buffer cache usage by index, showing how many of the pages in memory are clean or dirty:
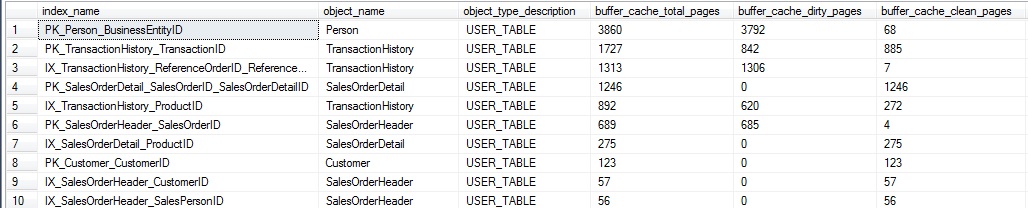
This data provides an idea of the write activity on a given index at this point in time. If it were tracked over a period of days or weeks, we could begin to gauge the overall write activity of the index and trend it. This research could be useful if you were looking to understand the best possible isolation level to use on a database, or if those reports that are always run READ UNCOMMITTED could be more susceptible to dirty reads than originally thought. In this specific case, the dirty pages all relate to the update query that we previously ran above, and therefore comprise a somewhat limited set.
DBCC DROPCLEANBUFFERS
A DBCC command that is often thrown around as a way to test a query and accurately gauge execution speed is DBCC DROPCLEANBUFFERS. When run, this will remove all clean pages from memory for an entire database server, leaving behind only the dirty pages, which will typically be a small minority of data.
DBCC DROPCLEANBUFFERS is a command that should typically only be run in a non-production environment, and even then, only when there is no performance or load testing being conducted. The result of this command is that the buffer cache will end up mostly empty. Any queries run after this point will need to use physical reads to bring data back into the cache from your storage system, which as we established earlier, is likely much slower than memory.
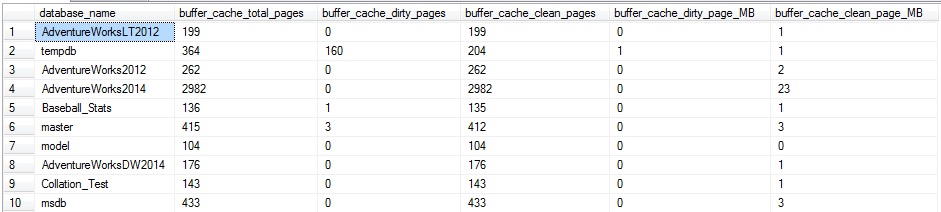
After running this command on my local server, the dirty/clean page query from earlier returns the following:
That’s all that’s left! Repeating my previous warning: Treat this command similarly to DBCC FREEPROCCACHE in that it should not be run on any production server unless you absolutely know what you are doing
This can be a useful development tool in that you can run a query in a performance testing environment over and over without any changes in speed/efficiency due to caching of data in memory. Drop the clean buffer data between executions and you’re in business. This can provide misleading results, though, in that production environments will always use the buffer cache, and will not read from your storage system unless necessary. Dropping clean buffers will lead to slower execution times than would otherwise be seen, but can provide a way to test queries in a consistent environment with each execution.
Understanding all of those caveats, feel free to use this as needed to test and gain insight into query performance, pages read into memory as a result of a query, dirty pages created by a write statement, and so on.
Page Life Expectancy
When discussing memory performance in SQL Server, it is unlikely that we would go a few minutes before someone asks about page life expectancy (PLE for short). PLE is a measure of, on average, how long (in seconds) will a page remain in memory without being accessed, after which point it is removed. This is a metric that we want to be higher as we want our important data to remain in the buffer cache for as long as possible. When PLE gets too low, data is being constantly read from disk (aka: slow) into the buffer cache, removed from the cache, and likely read from disk again in the near future. This is the recipe for a slow (and frustrating) SQL Server!
To view the current PLE on a server, you can run the following query, which will pull the current value from the performance counter dynamic management view:
|
1 2 3 4 5 6 7 |
SELECT * FROM sys.dm_os_performance_counters WHERE dm_os_performance_counters.object_name LIKE '%Buffer Manager%' AND dm_os_performance_counters.counter_name = 'Page life expectancy'; |
The results will look like this:

cntr_value is the value of the performance counter, and on my quiet local server is 210,275 seconds. Since very little data is read or written on my SQL Server, the need to remove data from the buffer cache is low, and therefore PLE is absurdly high. On a more heavily used production server, PLE would almost certainly be lower.
If your server has a NUMA (non-uniform memory access) architecture, then you’ll want to consider PLE for each node separately, which can be done with the following query:
|
1 2 3 4 5 6 7 |
SELECT * FROM sys.dm_os_performance_counters WHERE dm_os_performance_counters.object_name LIKE '%Buffer Node%' AND dm_os_performance_counters.counter_name = 'Page life expectancy'; |
On a server without NUMA, these values will be identical. On a server with a NUMA architecture, there will be multiple PLE rows returned, all of which will add up to the total given for the buffer manager as a whole. If you are working with NUMA, be sure to consider PLE on each node, in addition to the total, as it is possible that one node is a bottleneck, while the overall total looks acceptable
The most obvious question now is, “What is a good value for PLE?” To answer this question, we need to dig further into a server to see how much memory it has, and what the expected volume of data being written and read should be. 300 seconds is often thrown around as a good value for PLE, but like many quick & easy answers, it is likely wrong.
Before considering what PLE should look like, let’s consider a bit more about what it means. Let’s consider a server that has 256GB of RAM, of which 192GB is allocated to SQL Server in its configuration. I check the dm_os_sys_info view and find out that there is currently about 163GB committed to the buffer cache. Lastly, I check the performance counter above and find out that the PLE on this server is 2000 seconds.
Based on these metrics, we know that we have 163GB of memory available to the buffer cache, and data will exist there for about 2000 seconds. This means that we are reading, on average, 163GB per 2000 seconds, which comes out to be about 83MB/second. This number is very useful as it gives us a clear indicator of how heavily our SQL Server is being accessed by applications or processes. Before considering what a good PLE is, we need to ask ourselves some questions:
- How much data traffic to we expect on average by our applications/services?
- Are there “special” times when backups, index maintenance, archiving, DBCC CheckDB, or other processes may cause PLE to become very low?
- Is latency an issue? Are there measurable waits that are causing applications to perform poorly?
- Are there significant IO waits on the server?
- Which queries do we expect to read the most data?
In other words, know thin data! The only true answer to the PLE question is that a good value of PLE is one that represents optimal server performance with enough headroom to account for growth and spikes in usage. For example, let’s take the server from earlier, which has 163GB of memory devoted to the buffer cache, an average PLE of 2000 seconds, and an extrapolated throughput of 83MB/second. After some additional research, I discover that performance begins to suffer when PLE dips below 1500 seconds. From this point, I do some further due diligence and find out that the application grows 1% per month (in terms of data size and throughput). As a result, I can extrapolate that in 6 months, I would need 172GB of RAM dedicated to SQL Server in order to maintain a similar level of PLE that we have now. As time marches on, PLE will dip below 1500 seconds more often, and if left alone indefinitely, average PLE would eventually dip below 1500 seconds and performance would be consistently unacceptable.
These calculations are an important part of capacity planning and ensuring that any organization is ready for the future. This allows us to stay proactive and not simply add RAM to a server when things become intolerably slow. Applications rarely grow 1% per month forever. Rather, they grow based on a mix of data growth, new features, architecture changes, and infrastructure changes. This means that an application may grow 1% per month, but after a major software release, we see growth jump by 10% as a one-time occurrence.
Conclusion
Peeking into the buffer cache is a great way to learn more about how your applications and processes are performing. With this information, you can track down poorly performing queries, identify objects that use more memory than they should, and improve server planning for the future. This knowledge spans development, administration, architecture, and design in terms of who impacts it and who can be influenced by it. As a result, effectively staying on top of your server’s memory management will make your life easier, while improving the experience for anyone that uses your SQL Servers.
We jumped into quite a few scripts that can return useful information about the buffer cache but didn’t necessarily go into great detail about the views and TSQL involved. In a future article, I’ll revisit some of the system views that we used in more detail, as well as delve into page data and some additional ways to use this information towards the benefit of the great good. I expect this will be both exciting and terrifying all at once, and therefore wouldn’t have it any other way

In his free time, Ed enjoys video games, sci-fi & fantasy, traveling, and being as big of a geek as his friends will tolerate.
View all posts by Ed Pollack
- SQL Server Database Metrics - October 2, 2019
- Using SQL Server Database Metrics to Predict Application Problems - September 27, 2019
- SQL Injection: Detection and prevention - August 30, 2019