
In this article, we will learn how to use Power BI to source data from an instance of Azure Database for PostgreSQL, transform this data and load it into Power BI for reporting.
Introduction
Reporting data is one of the most common and standard practices in the area of data consumption. Data is sourced from a variety of data sources, it may then be optionally transformed in flight and then reported using a variety of reporting tools. Examples of some of the most popular databases are SQL Server, Postgres, Oracle, etc. and examples of some of the most popular reporting tools are Power BI, Tableau, and others. Power BI supports a variety of data sources of different types like flat files, relational databases, NoSQL databases, commercial and open-source databases, databases from different clouds as well as other sources and applications that supports the consumption of data from reporting tools. Postgres is one of the most popular open-source databases. Azure provides Azure Database for PostgreSQL service as its Postgres offering on Azure cloud. Power BI does not provide a specific connector for the PostgreSQL service, but it provides a connector for Postgres as a data source that can be used to source data from an instance of Azure Database for PostgreSQL as well.
Sourcing data from Azure Database for PostgreSQL
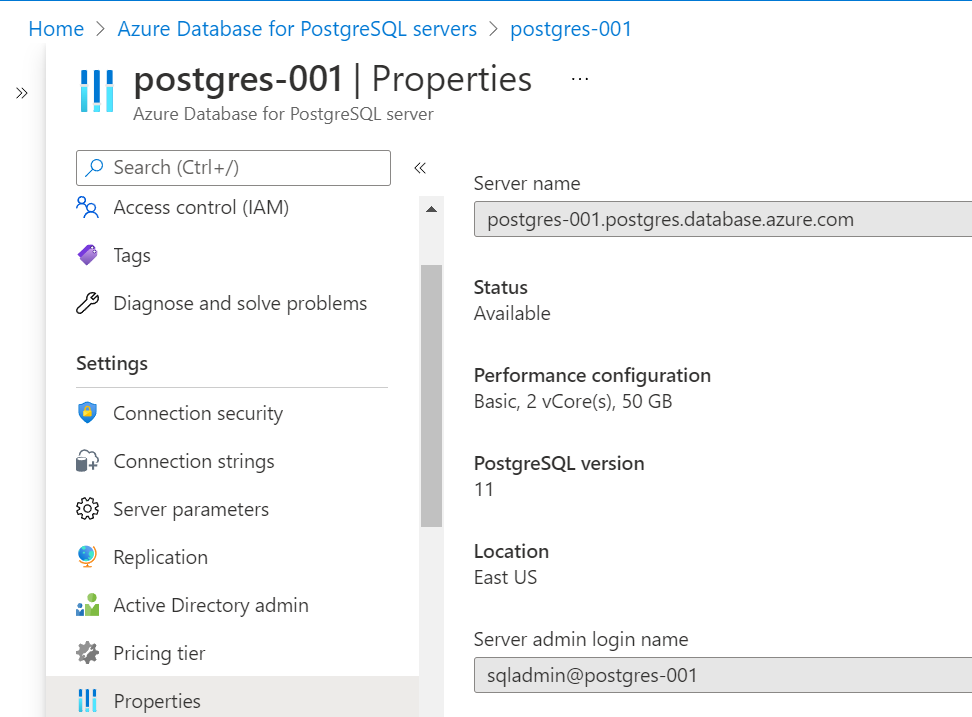
The first step for the exercise in question is to have an instance of Azure Database for PostgreSQL, which we will use as a data source. It is assumed that one has an Azure account subscription and the required privileges to administer the service to create a database instance. Navigate to the Azure portal, open the PostgreSQL service, and create a new instance of the PostgreSQL database in a single server edition using the default settings. After the instance is created, navigate to the dashboard of the instance, and open the properties of the instance. You would be able to find the server endpoint i.e., the name of the instance that we would use to make a connection to it.
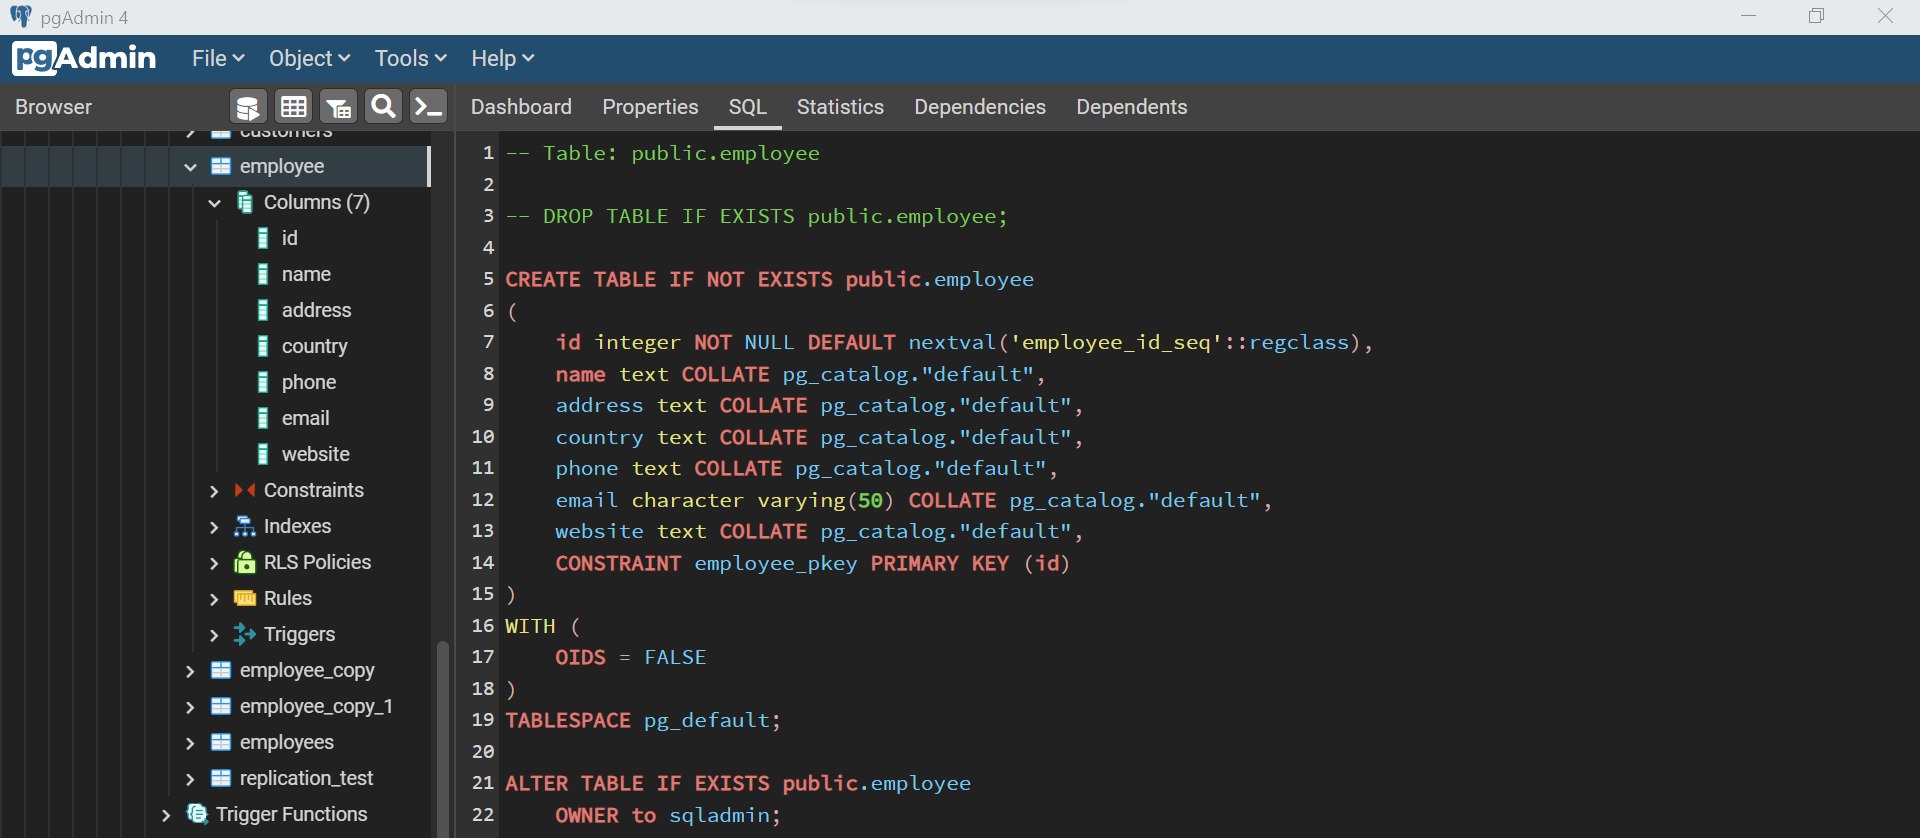
The next step after the creation of the instance is to create at least one table with some sample data in it. To work with an instance of Azure Database for PostgreSQL, one can install the pgAdmin utility which is one of the most famous tools that is used to work with PostgreSQL. Assuming it is installed on the local machine and connected to the database instance, we can create a simple table with a few fields in it. An example of one such table is shown below. Here we have an employee table with few fields and a primary key constraint. After the table is created, use the INSERT SQL command, and add a few records in it, so that we can source this data into Power BI.
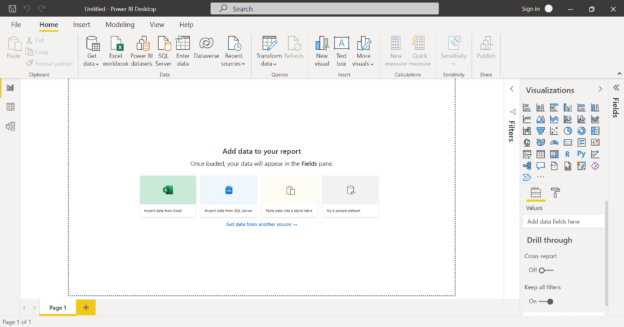
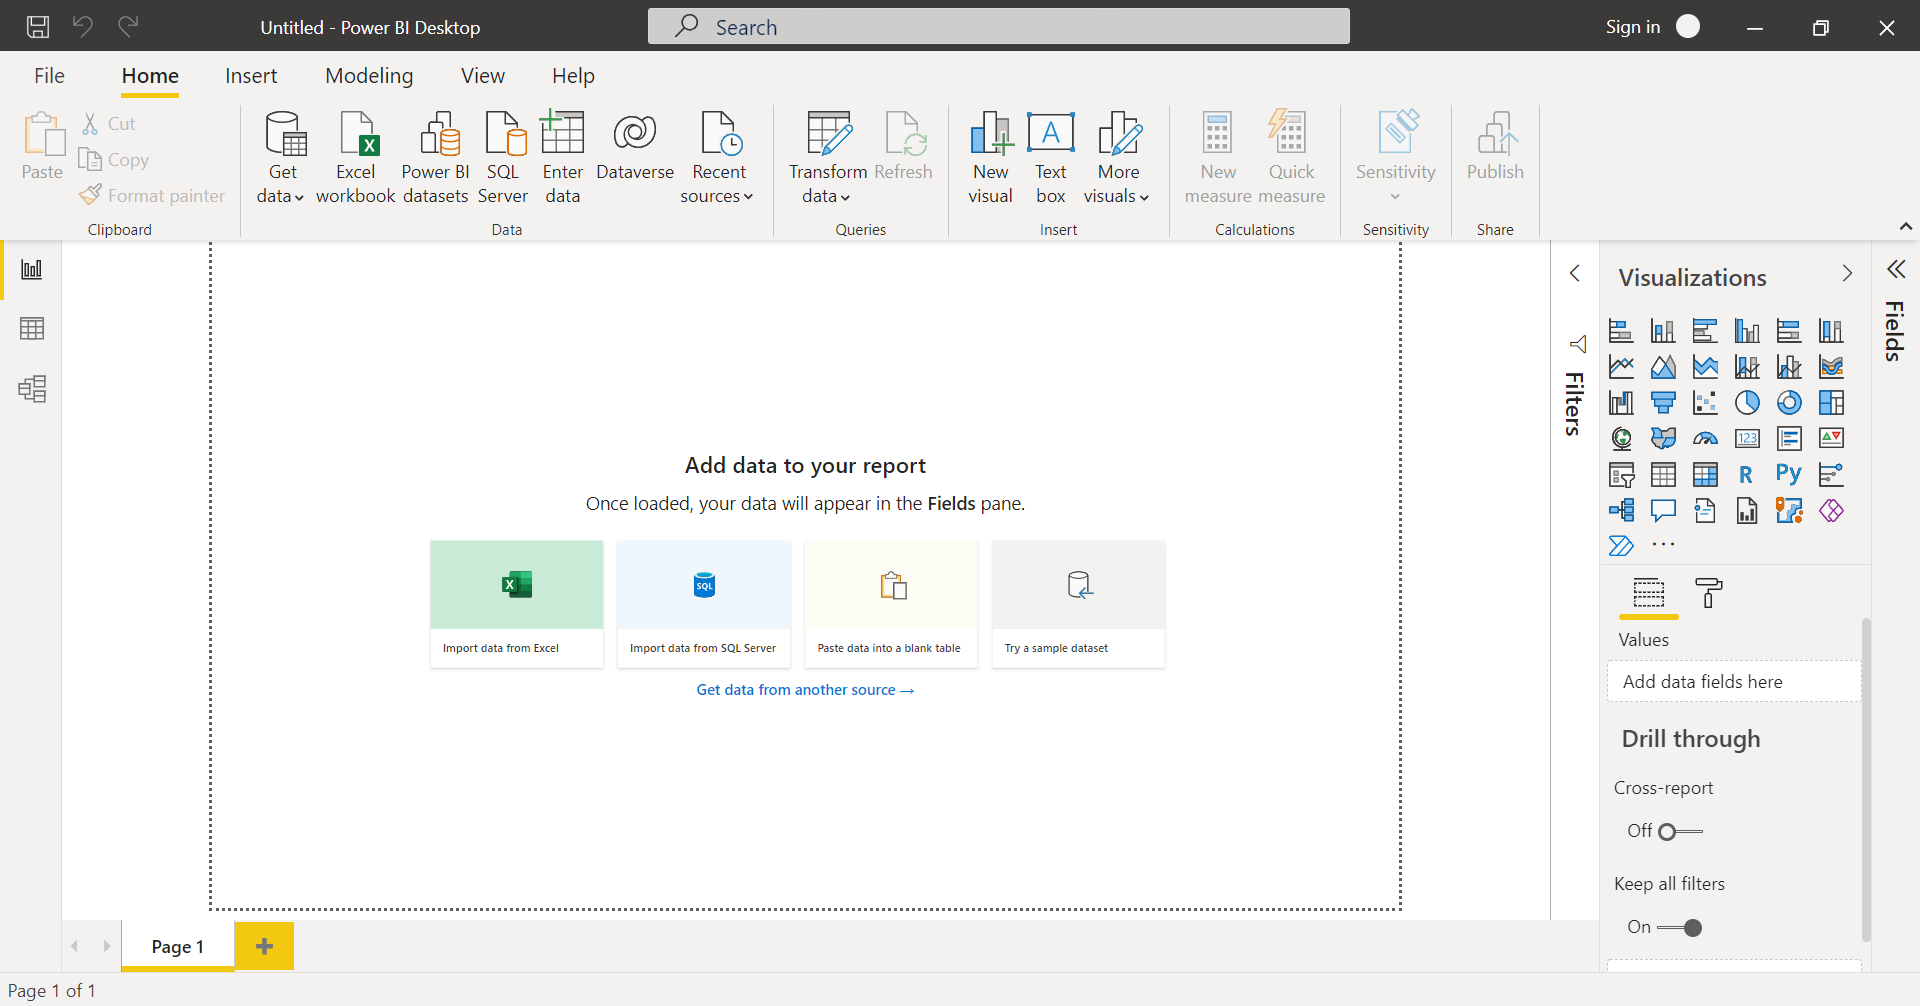
Now that we have the data source set up already, the final step is to source data from this setup into a Power BI report. It is assumed that the latest version of Power BI is already installed on the local machine. Open Power BI and the home screen or the layout of the report designer would look as shown below.
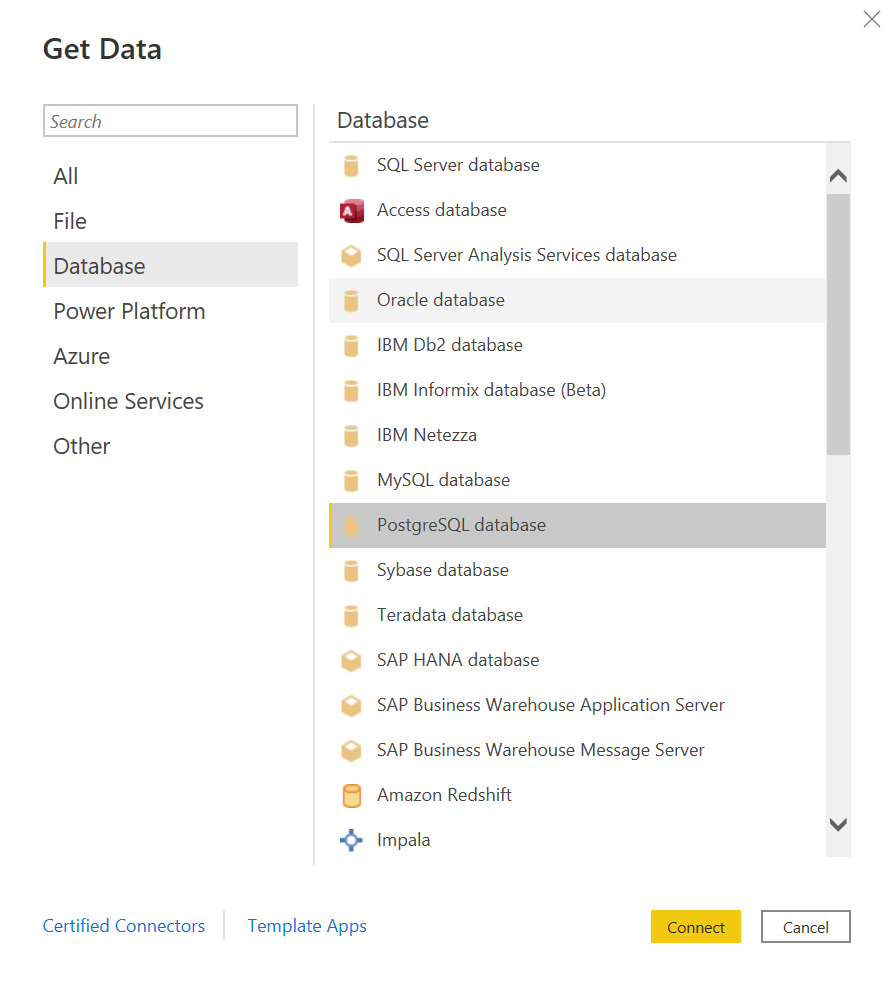
Click on the Get Data menu and click on More to get options to select the desired connector. Select the database category and select the menu option PostgreSQL database as shown below.
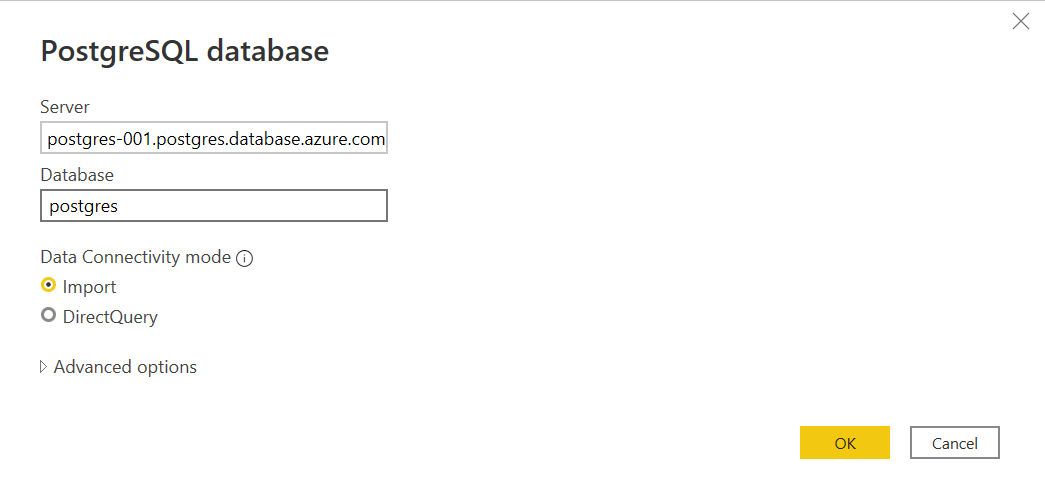
Once this option is selected, we would get a prompt to select the server’s name and database name. The server’s name should be the endpoint of the instance of Azure Database for PostgreSQL, and the name of the database would be the default database i.e., Postgres. Key in these details and move to the next step. The default connectivity mode is “Import” which means data would be copied locally in the report data model. Another option is to query the data directly, which is also fine in certain use cases. For now, we will continue with the import mode.
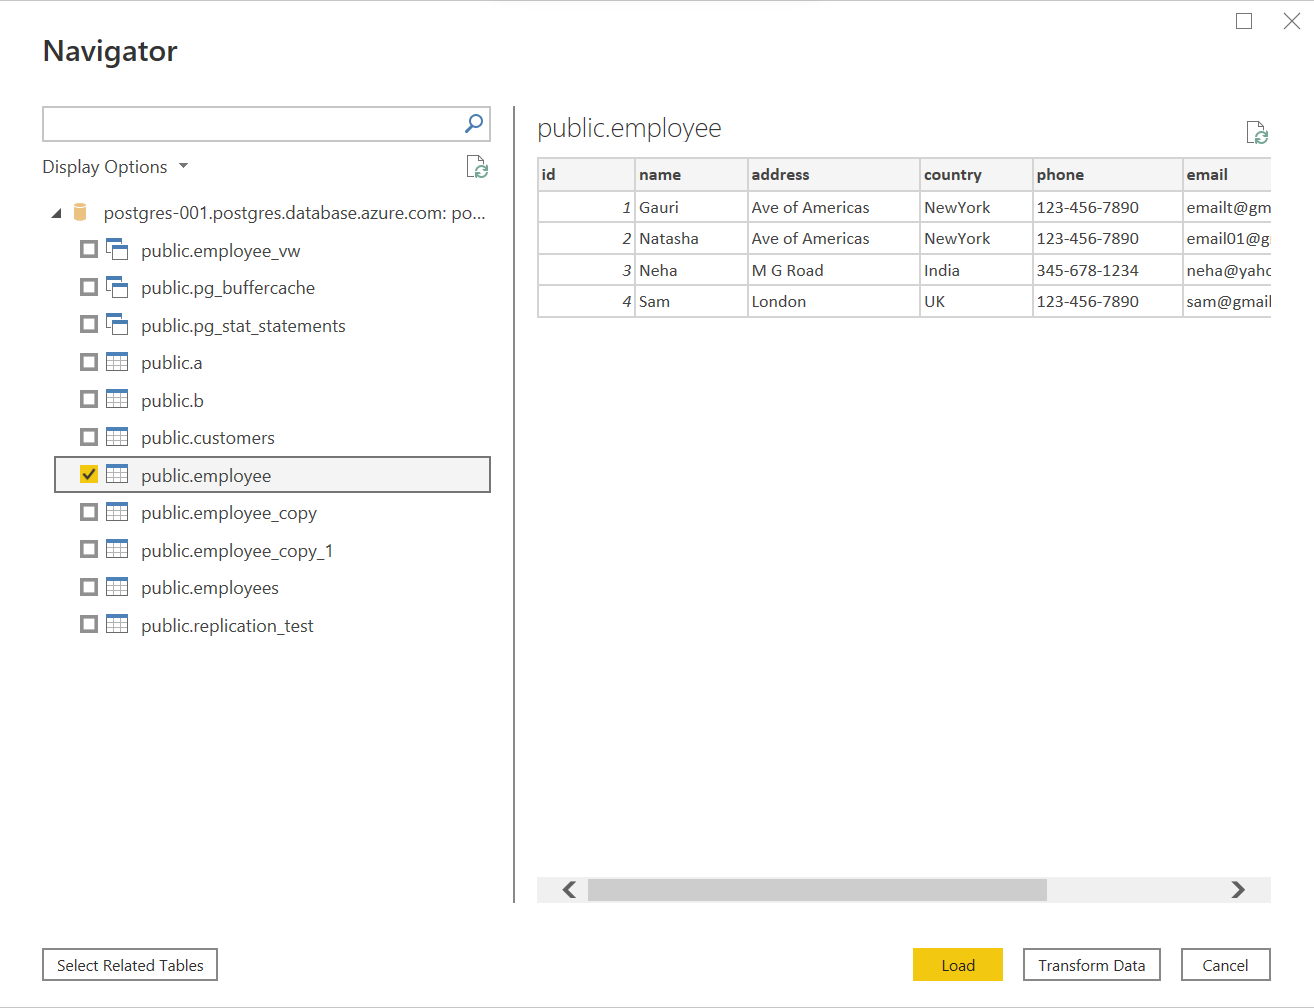
In the next step, we would be required to provide the connection credentials. Provide the username in the format of <username@servername> where username is the administrator username, or any other username created on the instance and the server name is the endpoint name. Provide the password as well and proceed to the next step. If the connectivity is successful, we would be able to see the database objects in this instance as shown below. Select the table of interest and we would be able to preview the data in the right pane as shown below. Here we will select the previously created Employee table and proceed to the next step, by clicking the Transform Data button.
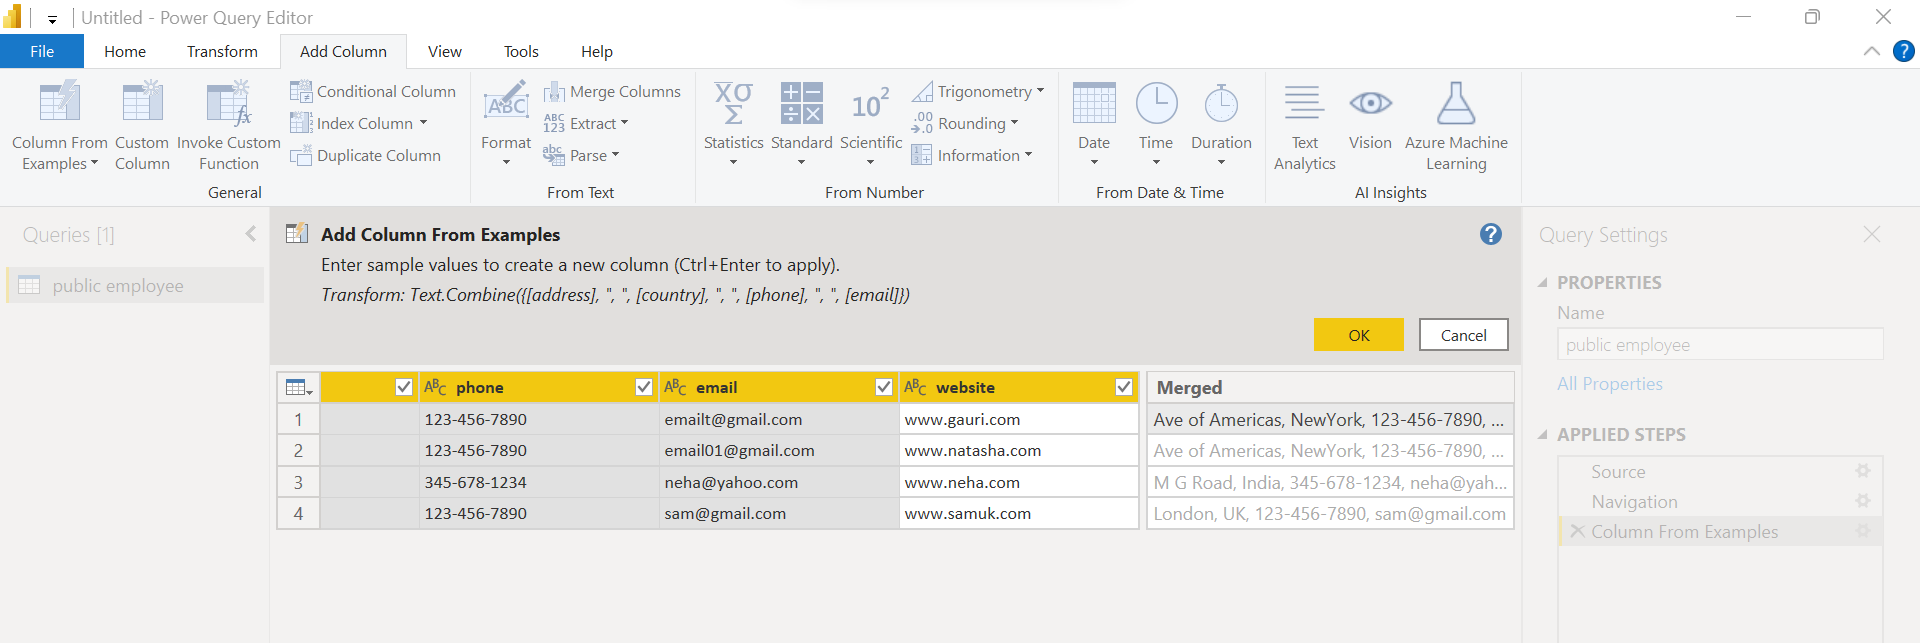
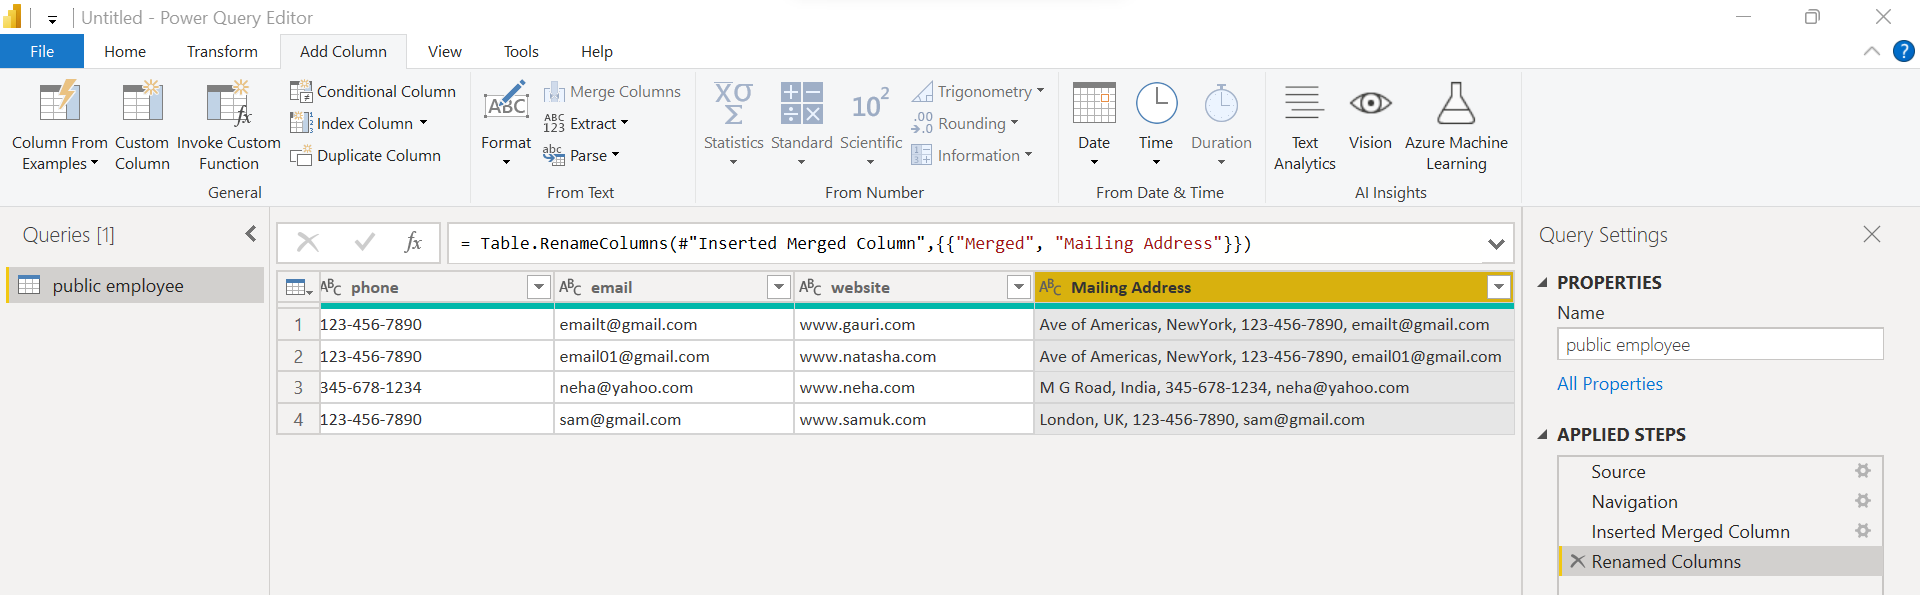
Clicking the Transform Data button opens the Power Query Editor environment. Here we can transform the data as desired. Let’s say that we intend to add a new field in the dataset named “Shipping Address” which combines the values from different fields like address, country, phone, and email. To add a new column to the dataset, click on the Add column tab and select the “Add column from examples” menu option.

This would add a new field towards the end of the dataset. Instead of writing a full formula for concatenation, we can use an easier way. Type the values of fields address, country, phone, and email for the first record in the new column and it would automatically draft the formula to use the Text.Combine function as shown below. It would also show the resultant values for other records as shown below. This allows us to focus on the desired result and the formula gets generated in the background to meet this result automatically. Click on the OK button to move to the next step.
Now that the field is configured with the formula that results in desired values for the newly created field, we just need to rename this field. Double click on the column header of the new field and the name is to something appropriate as shown below. We can see the series of changes in a sequence in the applied steps section on the right pane. Once this is done, click on the Apply and close button to proceed with the next step.
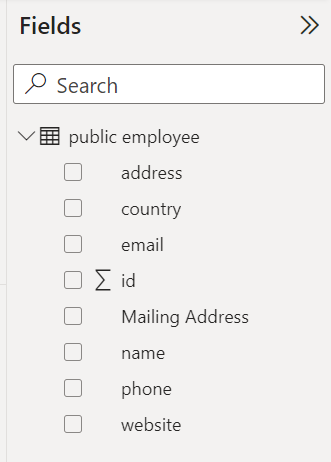
Once the data is imported into the Power BI data model, check out the fields section to see that all the fields from the base table as well as the newly created field are important and are available for use in the fields section.
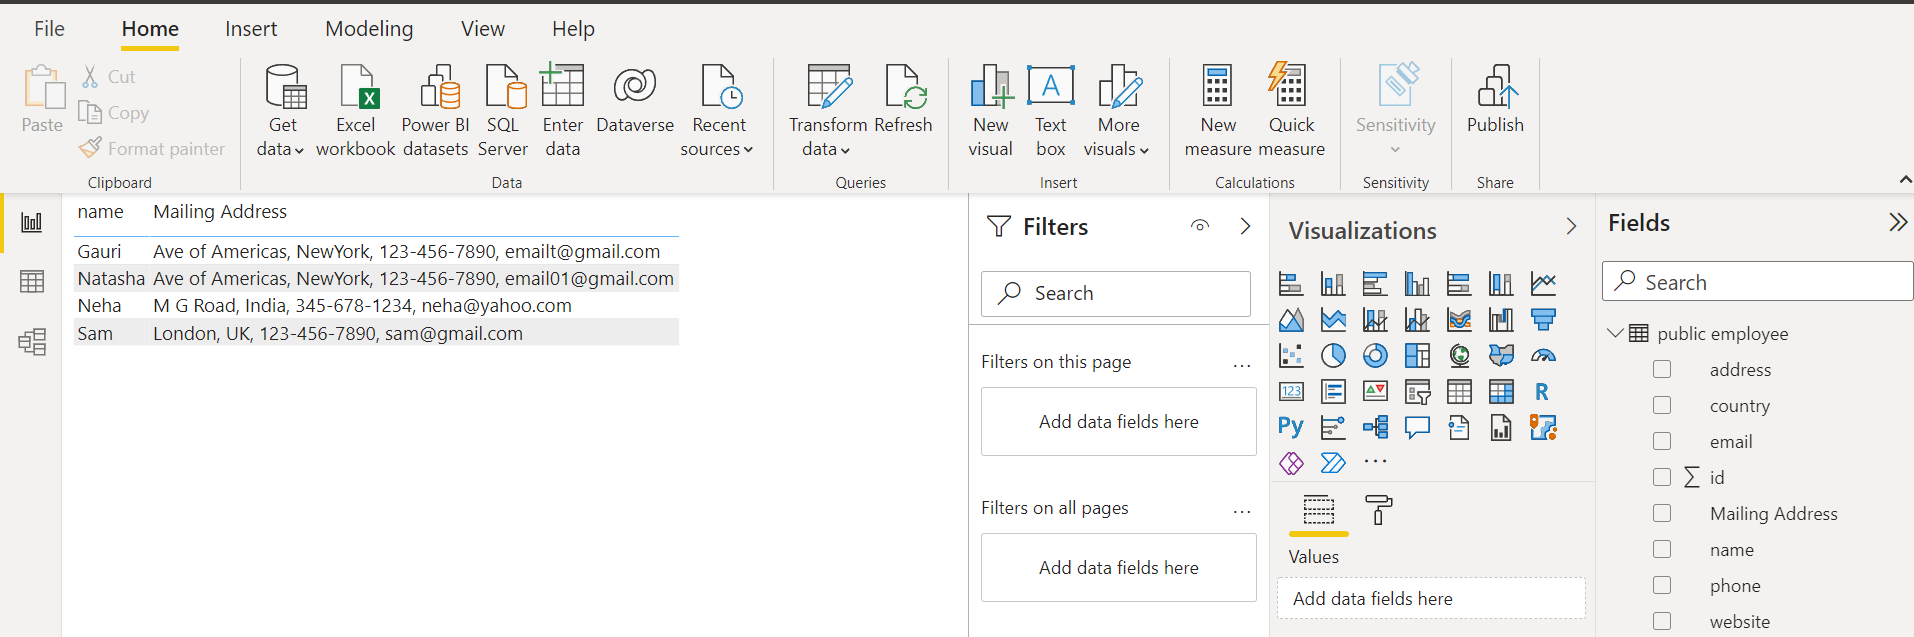
To ensure that data from the instance of Azure Database for PostgreSQL, as well as the new field that gets created during the data transformation process, is available for consumption, just drag a few fields on the report layout as shown below. If everything works as expected, we should be able to report data from this instance of Azure Database for PostgreSQL as shown below.
In this way, we can use the PostgreSQL connector of Power BI to connect to an instance of Azure Database for PostgreSQL to report data.
Conclusion
In this article, we started by creating a new instance of Azure Database for PostgreSQL on Azure cloud and a setup of pgAdmin tool on the local machine. Then we created a new table with some sample data by using the pgAdmin tool. We transformed this data before importing it into the Power BI data model and then finally reported this data in the Power BI report.

She has a deep experience in designing data and analytics solutions and ensuring its stability, reliability, and performance. She is also certified in SQL Server and have passed certifications like 70-463: Implementing Data Warehouses with Microsoft SQL Server.
View all posts by Gauri Mahajan
- Oracle Substring function overview with examples - June 19, 2024
- Introduction to the SQL Standard Deviation function - April 21, 2023
- A quick overview of MySQL foreign key with examples - February 7, 2023