
Modeling for the xVelocity/Vertipaq engine is a completely different beast than modeling for your trusty multi-dimensional SSAS cubes.
In-memory = blazingly fast; At least that’s what you would think.
As Tabular models gain popularity with business users and developers alike, we’re starting to see that this isn’t always the case.
We’re going to take a look at some of the common errors and mistakes and how to avoid them.
And since the PowerPivot engine is the same – you will learn how to tune your PowerPivot-based Excel workbooks as well.
PowerPivot was launched with the Vertipaq engine back in 2010, but when MS SQL Server 2012 was released with the SSAS Tabular mode, the Vertipaq engine had been rebranded as the xVelocity Engine.
It is, in fact, the same technology, which might confuse newcomers. I for one tend to use both names interchangeably, seeing as the Vertipaq name pops up all over the place.
At the heart of the engine – no matter what you call it – is the in-memory columnstore technology and some nifty compression techniques. The techniques have been discussed in-depth elsewhere and is not a topic for this article. But it’s worth knowing a bit about what is happening and why columnstore is different from your standard row-based SQL server.
As the name indicates, columnstore stores values in columns instead of in pages of rows with columns. This provides significantly increased performance when trying to fetch a sum of a column, or a distinct count – but takes a not so much when having to fetch an entire table.
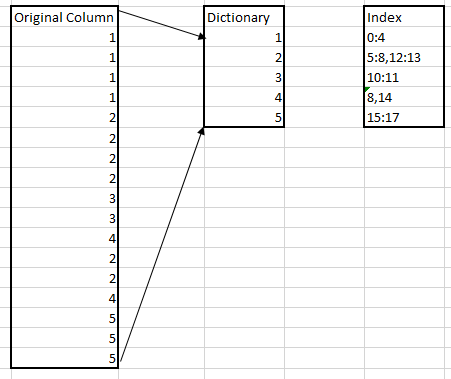
To keep track of the values in each column, xVelocity uses a dictionary of unique values and an index of where the values are found. This can give a significant compression in the right circumstances.
Here’s a simple illustration of how this works:
There are several topics to consider when designing your model, I’ve grouped these into three areas ranging from the most basic – and where you gain the most effect to the more advanced and the effect varies more.
Your data:
Try having as few unique records in your columns as you can. In other words, avoid high granularity in your columns. The larger the column dictionary is, the less effective your compression is, and your memory usage increases.
Avoid DateTime columns, better to split time and date into two separate columns. Don’t store time down to milliseconds unless it’s really needed, and so on.
Just as low granularity helps, so does the sorting of the columns – the closer the unique values are to each other in your column the smaller the dictionary index is. However, it’s not possible to sort all columns perfectly – so you need to consider which column sorting gives the best result for you.
Since the data is stored by column and not by row, you should never pull an entire table into your model if you aren’t going to use all the columns. Yes, you can always hide the column from view – but the data in those hidden columns will still fill up memory. I’ve seen tables with 30+ columns being pulled in, just so that the developer could use one single column from the table.
Your calculations:
The calculation language of PowerPivot and Tabular – DAX – is a powerful language that lets you do all sorts of things with your data. You can calculate a running average, do simple distinct counts, add calculated columns to your tables and so on.
This is all great, calculations are important and calculated columns lets you add functionality to your model quite easily, depending on your knowledge of DAX of course.
But, this comes with a price. Every calculation comes with a memory cost. For instance, on a small 5+ million row model – adding a simple «RELATED» column can add 2,5 MB to your model. And this will impact the performance of your cube. Therefore, when modeling your data, it’s important to consider exactly what you need to calculate in the model and what you can calculate before sending data to the model.
If you are using PowerPivot and not using PowerQuery, you are not using all your tools. PowerQuery is an excellent self-service ETL tool. And you can do a lot here.
Likewise, if you are working with a Tabular model you will have access to both regular MS SQL Server as well as Integration Services. Both of which will let you do transformations and calculations that will be delivered ready for use in your model. And now it’ll be just regular data – taking no more memory or CPU than any of your other columns. Pulling entire tables into your model, just so you can use one column in a RELATED-formula in your fact table is a waste of resources. Add the column to your fact table before pulling it in instead.
Your Fact and Dimension tables:
Now this is an area that you should consider more closely if you – after having tweaked both your data and your calculations – still see the need for tuning. This will also be a good place to look if you are inheriting a model someone else made.
It doesn’t always give the needed results, and sometimes you will trade off memory consumption for increased processing time. But it might be the right thing for you, so take it into consideration.
Consider the following model
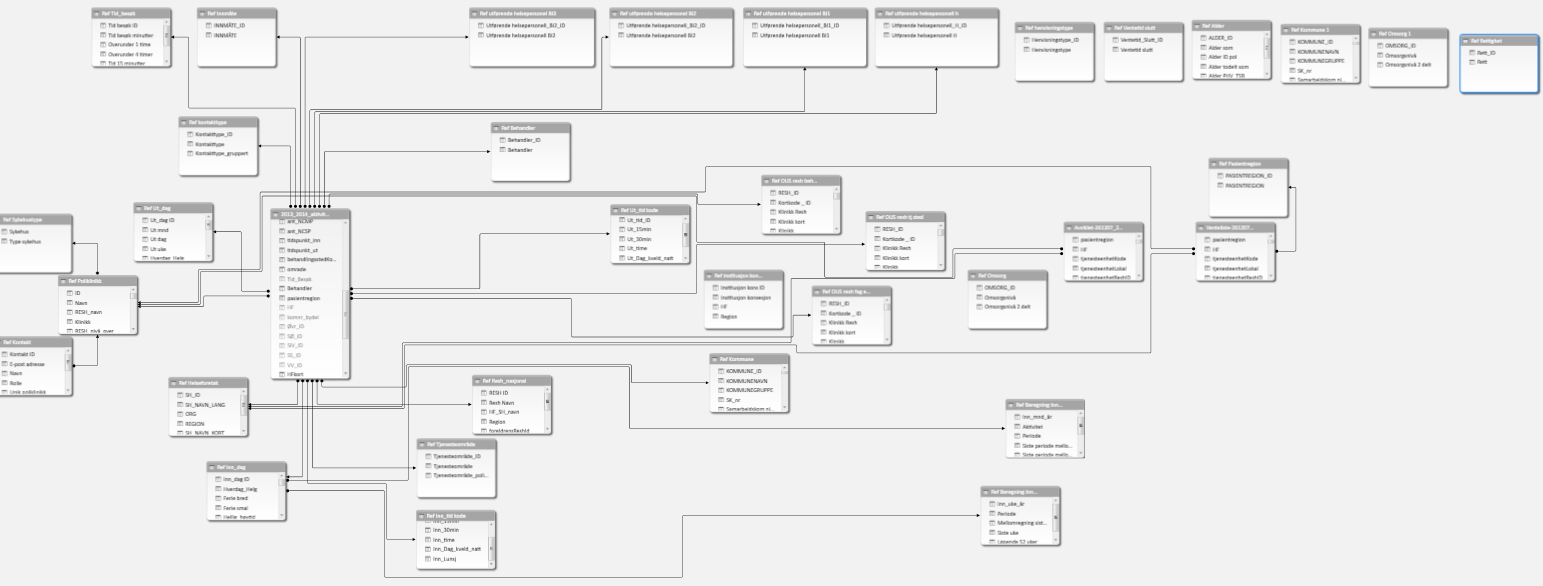
This a mostly standard snowflake schema – except for the six tables that are isolated from the rest – and do nothing. This is, of course, a total waste of memory. Remember to remove unused tables when you are done modeling.
However, there are still quite a few dimensions here. And as mentioned earlier – dragging in an entire table to use only one column is a waste. Even if you drag in just two – one you want to use and then a link-column you might be better off merging this into either the fact table or into a related dimension. Every join and lookup will also take up some resources, and even if that seems minimal in the larger scale of things, it all adds up.
To illustrate, here is a compact version of the same model as above:
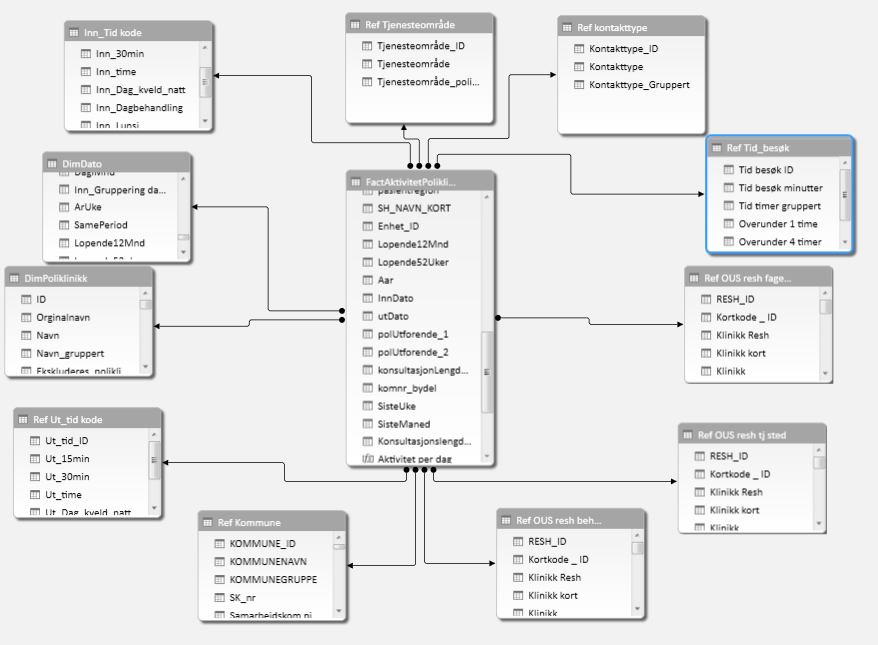
Dimensions have been merged into either the fact table or dimension tables that contained much of the same information or similar information.
There are fewer jumps and the model performs well. A potential downside to this is that a large fact table can take longer to process, though it might perform better once it’s in memory. This is something that might be totally fine or a deal breaker. And it will be up to you to decide what is best in any given scenario.

Combining his passion for MS SQL Server with his passion for sharing knowledge, he has recently started speaking at various events in the SQL Community. Johan Ludvig's current favourite topic is in-memory technology and self-service BI.
View all posts by Johan Ludvig Brattås
- Performance tuning an SSAS Tabular model - March 19, 2015