

Sometimes, when I saw expressions like ‘Expr1002’ or ‘WindowCount1007’ or something similar in the columns Output List of a query plan, I asked myself, is there a way to project those columns into the final result to look at the values. That question first came to me out of curiosity when I was playing with window aggregate functions and a Window Spool plan operator in SQL Server 2012, I wanted to look into the Window Spool to understand, how it performs an aggregation.
Interestingly, that SQL Server 2016 CTP3.0 allows us to look deep inside into the iterator and observe the data flowing through it. Let’s turn on an “x-ray machine” and take a look.
I will use the query that calculates running total in the DB opt.
|
1 2 3 |
use opt; go select sum(a) over(order by a) from t1 where a < 5; |
The query plan uses Window Spool to implement running total logic.

Now let’s look inside. As an x-ray machine this time we will use new Extended Event (XE): query_trace_column_values. This event is located in the debug channel, so I suppose it is not documented (meaning officially supported), however, it has the following description: “query_trace_column_values – Trace output column values of each row on each query plan operator.”
From the description, we may see that this is what we need. The usage of this XE is a little bit tricky and demands several conditions to be met:
- event is produced when the query is compiled or re-compiled;
- set statistics xml should be turned on;
- undocumented trace flag 2486 should be turned on on the session level.
Next we start XE session, open Live Data window (right click on the session name “Watch Live Data”) and re-run the query with the mentioned conditions.
|
1 2 3 4 5 6 7 |
use opt; go dbcc traceon(2486); set statistics xml on; select sum(a) over(order by a) from t1 where a < 5 option(recompile); set statistics xml off; dbcc traceoff(2486); |
This query produced the following result in the Live Data window:
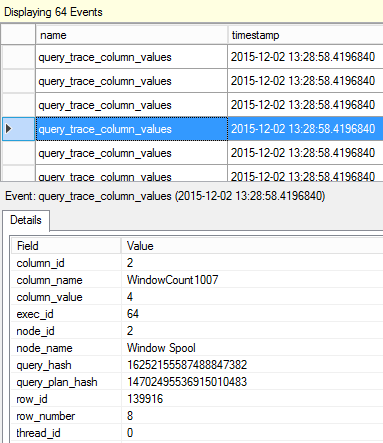
There were 64 events produced for this execution. We may multiply the number of rows in each plan operator (except Compute Scalar because it might be not a “classical” iterator, but a placeholder for defining expression that is calculated somewhere else in the plan).
|
1 2 3 4 5 6 |
select 4*1 + -- (Clustered Index Seek, 4 rows, 1 output column: a) 4*2 + -- (Segment, 4 rows, 2 output columns: a, Segment1005) 4*3 + -- (Segment, 4 rows, 3 output columns: a, Segment1005, Segment1006) 8*4 + -- (Window Spool, 8 rows, 4 output columns: a, Segment1005, Segment1006, WindowCount1007) 4*2 -- (Stream Aggregate, 4 rows, 2 output columns: Expr1003, Expr1004) |
And that gives us perfect 64 events for each row, each operator, and each column. How cool is that? =)
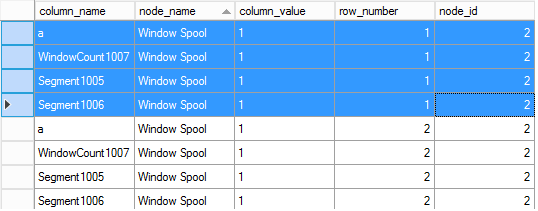
To analyze data in a more convenient way we may add or remove columns from the extended event grid and sort rows, to get something like this:
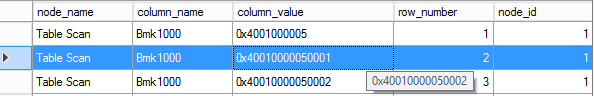
In a similar way you may watch other internal columns values, for example, Bookmark column:
Unfortunately, it seems that this event works only for the Row Execution mode, I tried and got no luck with Batch execution.
Before you start using this XE imagining your own scenarios and exploring SQL Server behavior I should mention once again, that this is not documented and maybe verbose. Also, firing an event, each and every time the column of the row is processed is not free, I didn’t measure the impact of enabling this event, but I think it should be considered. Because of all that mentioned above, use it carefully and in the test environment only.
I also would like to thank Microsoft dev team for keep adding those cool features and making server more transparent.

Currently he works as a database developer lead, responsible for the development of production databases in a media research company. He is also an occasional speaker at various community events and tech conferences. His favorite topic to present is about the Query Processor and anything related to it. Dmitry is a Microsoft MVP for Data Platform since 2014.
View all posts by Dmitry Piliugin
- SQL Server 2017: Adaptive Join Internals - April 30, 2018
- SQL Server 2017: How to Get a Parallel Plan - April 28, 2018
- SQL Server 2017: Statistics to Compile a Query Plan - April 28, 2018