
In this article, we will explore Microsoft SQL Server trace flags with all aspects, and we will learn also how to use them.
Introduction
Trace flags are the advanced configuration options that are used to change specific behaviors of the SQL Server. Trace flags are commonly used to diagnose specific problems of the Microsoft SQL Server but sometimes they can be recommended practices to resolve specific issues related to the database engine. Besides this, some trace flags might be transformed into a feature in newer releases of SQL Server. Such as, trace flag 1117 helps to resolve some tempdb database performance issues under particular circumstances. However, this trace flag functionality has become a default option with Microsoft SQL Server 2016 and the higher versions.
Trace Flag 1117: Tempdb database data file grows with all files at the same time so each of them remains on an equal size.
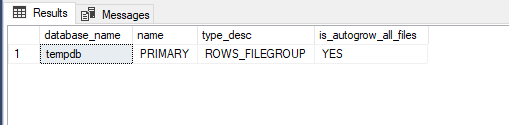
Microsoft SQL Server 2016 and upper versions this trace flag is implemented as a default setting for the tempdb database. Through the following query, we can display this setting for the tempdb database.
|
1 2 3 4 5 6 7 8 9 10 11 |
USE tempdb GO SELECT DB_NAME() AS database_name ,[name] ,type_desc ,CASE WHEN is_autogrow_all_files = 0 THEN 'NO' ELSE 'YES' END AS is_autogrow_all_files FROM sys.filegroups |
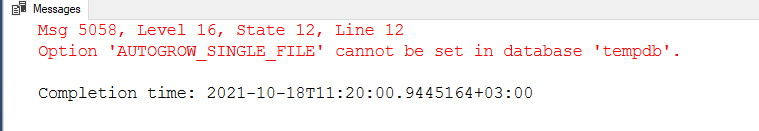
At the same time, we can not change this setting for the tempdb database. As we can see below, when we try to alter this feature, SQL Server will return an error.
|
1 2 3 |
ALTER DATABASE tempdb MODIFY FILEGROUP [PRIMARY] AUTOGROW_SINGLE_FILE |
The other remarkable point about the flags is that some flags can be undocumented by Microsoft. In this situation, usage of these trace flags can impact the database workload negatively therefore test the flags in the non-production environment will be a good practice.
Trace flags scopes
Trace flags can be enabled or disabled with different methods in Microsoft SQL Server for the different scopes. We can enable flags manually through the commands for the following scopes:
- Query-level
- Session-level
- Global
How to enable a trace flag in query-level
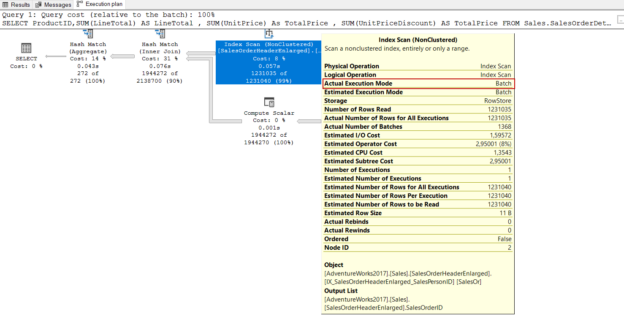
We can use the QUERYTRACEON query hint in the queries to enable a trace at the query-level. By default, the query optimizer decides to use adaptive join for the following query.
|
1 2 3 4 5 6 7 8 9 |
SELECT ProductID,SUM(LineTotal) AS LineTotal , SUM(UnitPrice) As TotalPrice , SUM(UnitPriceDiscount) AS TotalPrice FROM Sales.SalesOrderDetailEnlarged SOrderDet INNER JOIN Sales.SalesOrderHeaderEnlarged SalesOr ON SOrderDet.SalesOrderID = SalesOr.SalesOrderID GROUP BY ProductID |
Trace Flag 9398: This trace flag prevents the use of the adaptive join operator by the query optimizer. This trace flag can be enabled for all scopes.
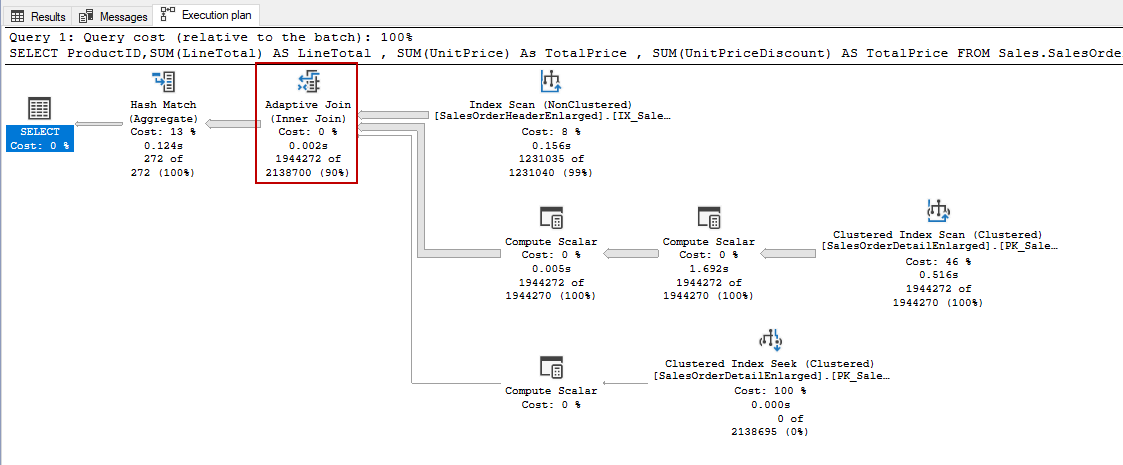
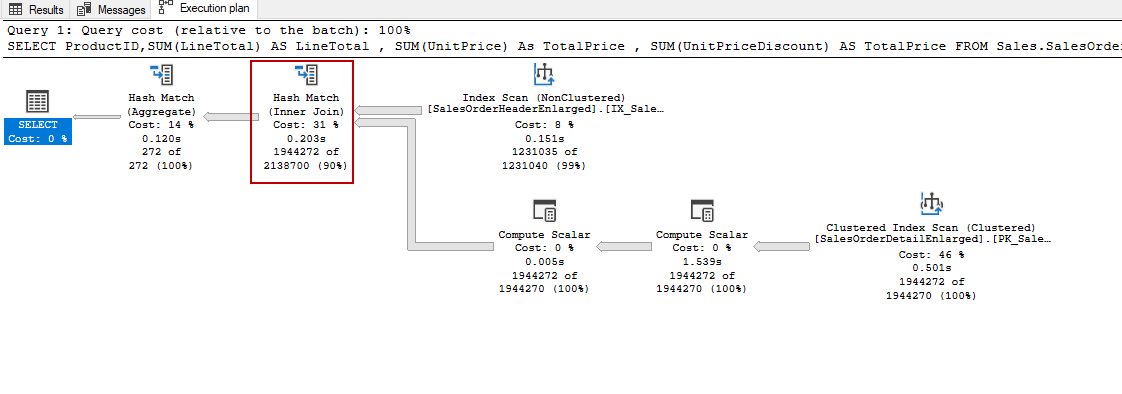
Now, we add the QUERYTRACEON hint to the query and enable the 9398 flag. In this case, the optimizer will abandon to use adaptive join operator.
|
1 2 3 4 5 6 7 8 9 10 |
SELECT ProductID,SUM(LineTotal) AS LineTotal , SUM(UnitPrice) As TotalPrice , SUM(UnitPriceDiscount) AS TotalPrice FROM Sales.SalesOrderDetailEnlarged SOrderDet INNER JOIN Sales.SalesOrderHeaderEnlarged SalesOr ON SOrderDet.SalesOrderID = SalesOr.SalesOrderID GROUP BY ProductID OPTION(QUERYTRACEON 9398) |
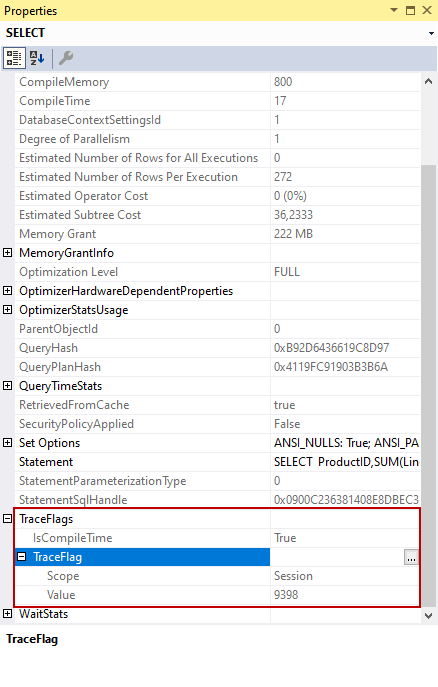
The select operator includes the TraceFlags property, which lists the trace flags that affect the query during its execution. The IsCompileTime attribute shows true and it means the flag has been enabled during the compilation of the query.
Enabling a trace flag in session-level
We can use the DBCC TRACEON command to enable the flags at the session-level. We only pass the trace flag number into this command. The following command enables a trace flag at the session-level.
|
1 2 3 |
DBCC TRACEON(9398) |
When we want to disable the same flag, we need to run the DBCC TRACEOFF command on the same session.
|
1 2 3 |
DBCC TRACEOFF(9398) |
Enabling a trace flag at the global level
To enable a trace flag at the global level we need to pass the -1 value as a second parameter into the DBCC TRACEON command.
|
1 2 3 |
DBCC TRACEON(9398,-1) |
In order to disable the same trace flag at the global level, we can execute the following query.
|
1 2 3 |
DBCC TRACEOFF(9398,-1) |
When we enable a flag at the global level to use the DBCC TRACEON statement, it will remain valid until the trace flag is disabled or restarting the Microsoft SQL Server.
Adding a trace flag into the Microsoft SQL Server startup parameters
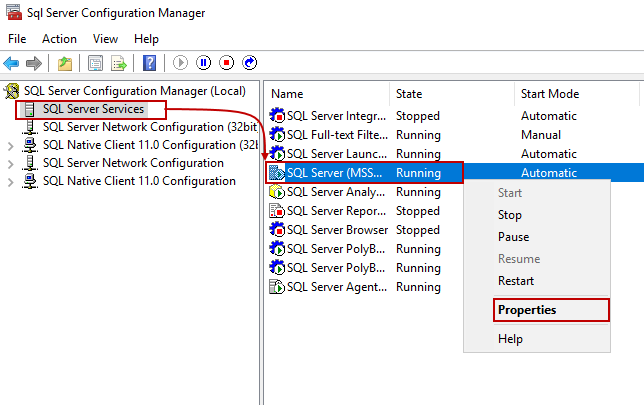
In some scenarios, we can require to enable a trace flag automatically when the database engine is started. In such a case, we can add the trace flag into the database startup parameters. We can easily make trace flag automatization to use SQL Server Configuration Manager. Firstly, we will launch the Configuration Manager and right-click on the SQL Server service from the service list panel. In the menu, we select the Properties.
We click the Startup Parameters and then add the trace flag number with the -T switch into the Specify a startup parameter text box. As a final step, we click the Apply button.
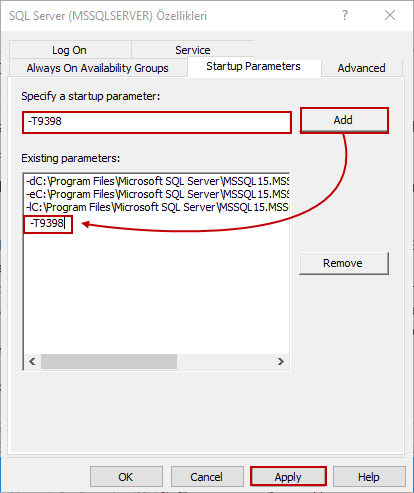
After adding the trace flag into the startup parameters, it will become active after the SQL Server service restarts.
Getting trace flag status
DBCC TRACESTATUS command helps us to learn the status of the trace flags. When we execute the DBCC TRACESTATUS command with the -1 parameter, it will return the status of all trace flags that are currently enabled globally.
|
1 2 3 |
DBCC TRACESTATUS (-1) |
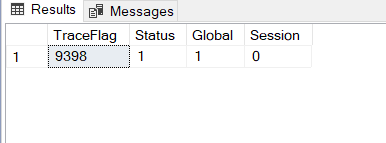
TraceFlag column specifies the number of the trace flag number and the other columns show the status of the trace flags in the specific level. The 1 value identifies that the trace flag is enabled at and the 0 value identifies the trace flag is disabled. When we execute the DBCC TRACESTATUS without the -1 parameter, it will return the enabled trace flags for the current session.
Monitoring trace flag activities
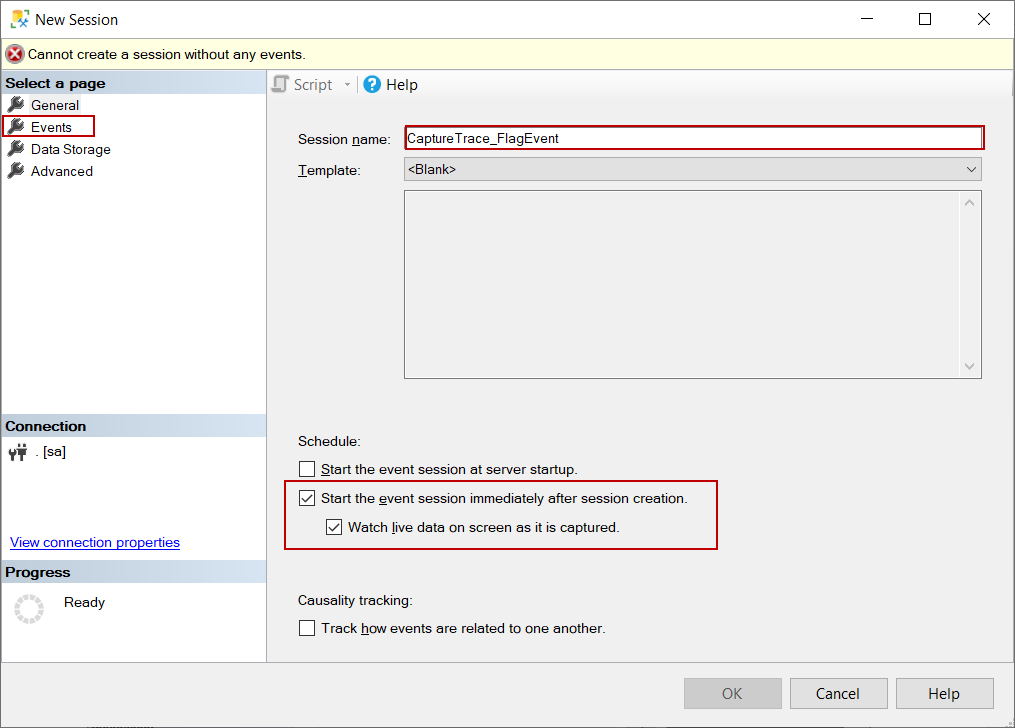
Microsoft SQL Server extended event is a lightweight monitoring tool and offers a very effective solution to diagnose the problems. The trace_flag_changed event captures when a trace flag status is changed thus we can use this event to monitor the trace flags. At first, we add a new session and give a name to it. In the General tab, we click the below options:
- Start the event session immediately after session creation
- Watch the live data on screen as it is captured
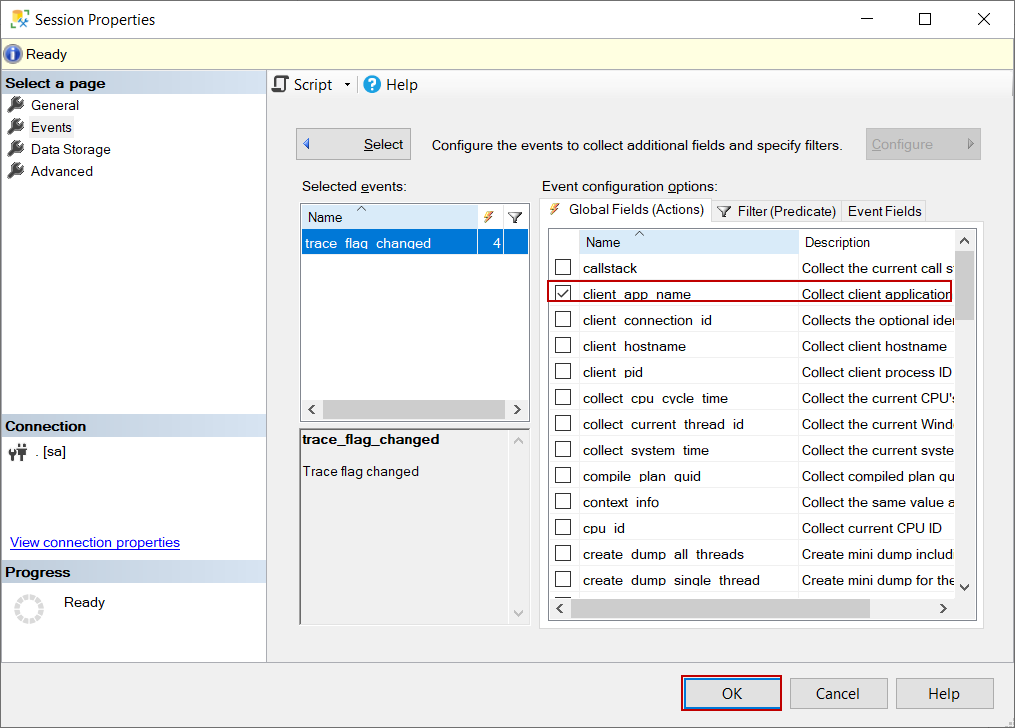
After that, we click the Events tab and we find the trace_flag_changed, and then add it into the Selected Event list.
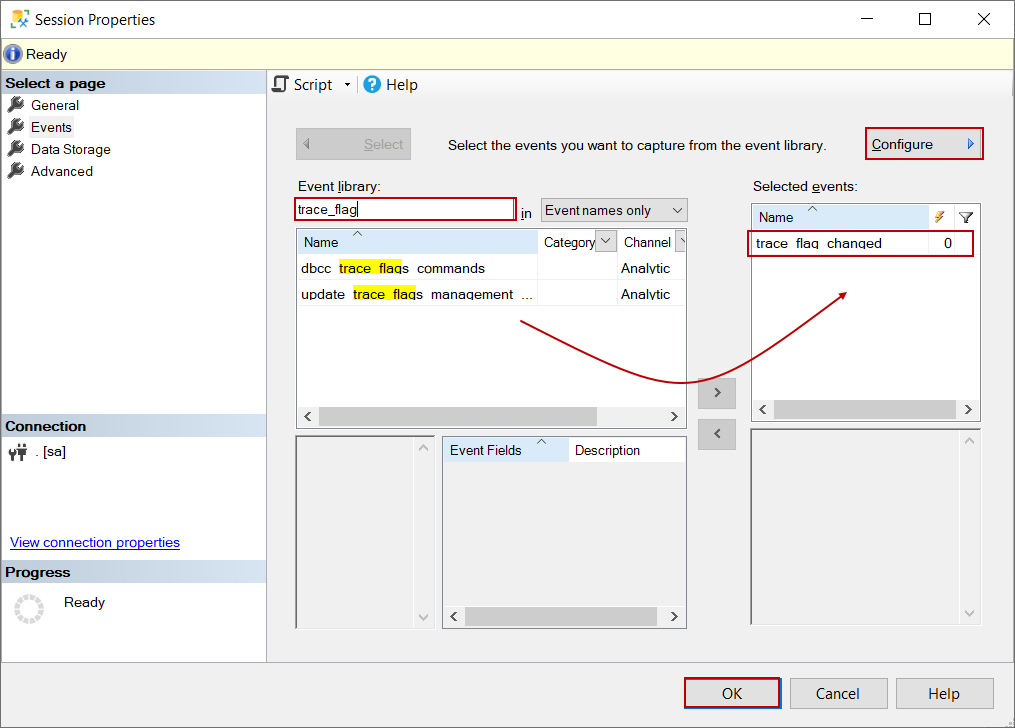
Click the Configure button and select the required global fields, and click OK.
- client app name
- database name
- SQL text
On the Data Storage tab, we select the event_file type and click OK. Now we will enable and disable a trace flag for the different scopes.
|
1 2 3 4 5 6 7 8 9 10 11 12 |
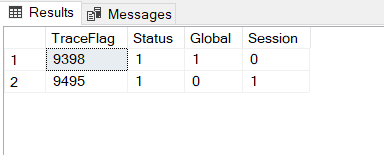
DBCC TRACEON(9453); GO DBCC TRACEON(9495,-1); GO WAITFOR DELAY '00:00:01'; GO DBCC TRACEOFF(9453); GO DBCC TRACEOFF(9495,-1); GO |
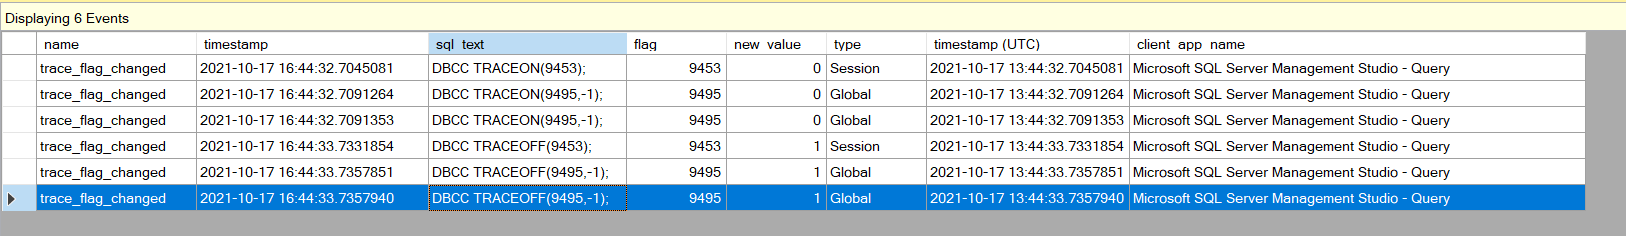
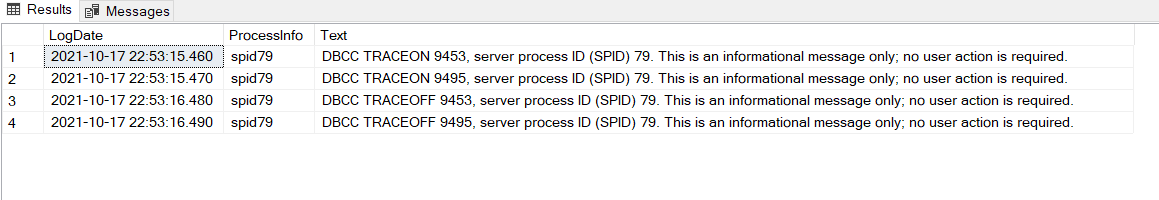
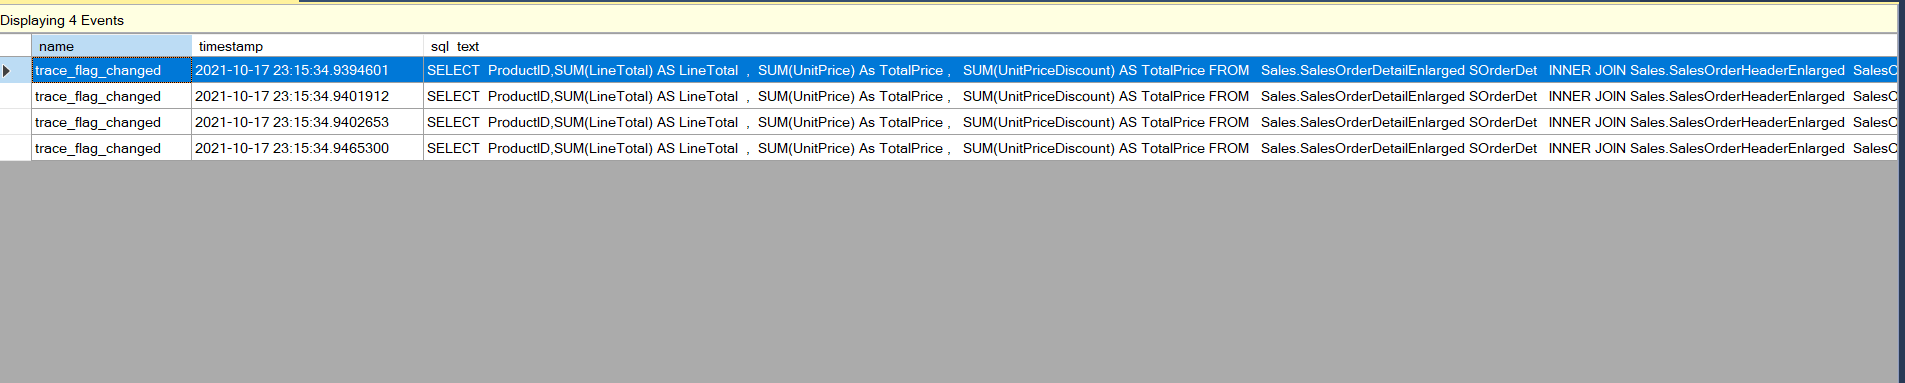
As we can see, all trace flag changes are captured by our extended event session. Another method to monitor the trace flags is to read the SQL Server error log records. When a trace flag is enabled, SQL Server writes a log record for these activities. To read the Microsoft SQL Server error logs, we can use the sp_readerrorlog procedure. With the help of the following query, we can filter the error logs and only return trace flag-related activity logs.
|
1 2 3 |
EXEC sys.sp_readerrorlog 0, 1, N'DBCC TRACE'; |
Monitoring the query-level trace flag usage activities can be a bit different than the session-level and global ones.
When we execute the following query, it will process the rows in a batch mode because of the Microsoft SQL Server 2019 Batch Mode on Rowstore feature.
|
1 2 3 4 5 6 7 8 9 |
SELECT ProductID,SUM(LineTotal) AS LineTotal , SUM(UnitPrice) As TotalPrice , SUM(UnitPriceDiscount) AS TotalPrice FROM Sales.SalesOrderDetailEnlarged SOrderDet INNER JOIN Sales.SalesOrderHeaderEnlarged SalesOr ON SOrderDet.SalesOrderID = SalesOr.SalesOrderID GROUP BY ProductID |

Now, we will enable flag 9453 for this query, and then the batch mode row processing will not be used by the optimizer.
|
1 2 3 4 5 6 7 8 9 10 |
SELECT ProductID,SUM(LineTotal) AS LineTotal , SUM(UnitPrice) As TotalPrice , SUM(UnitPriceDiscount) AS TotalPrice FROM Sales.SalesOrderDetailEnlarged SOrderDet INNER JOIN Sales.SalesOrderHeaderEnlarged SalesOr ON SOrderDet.SalesOrderID = SalesOr.SalesOrderID GROUP BY ProductID OPTION(QUERYTRACEON 9453) |
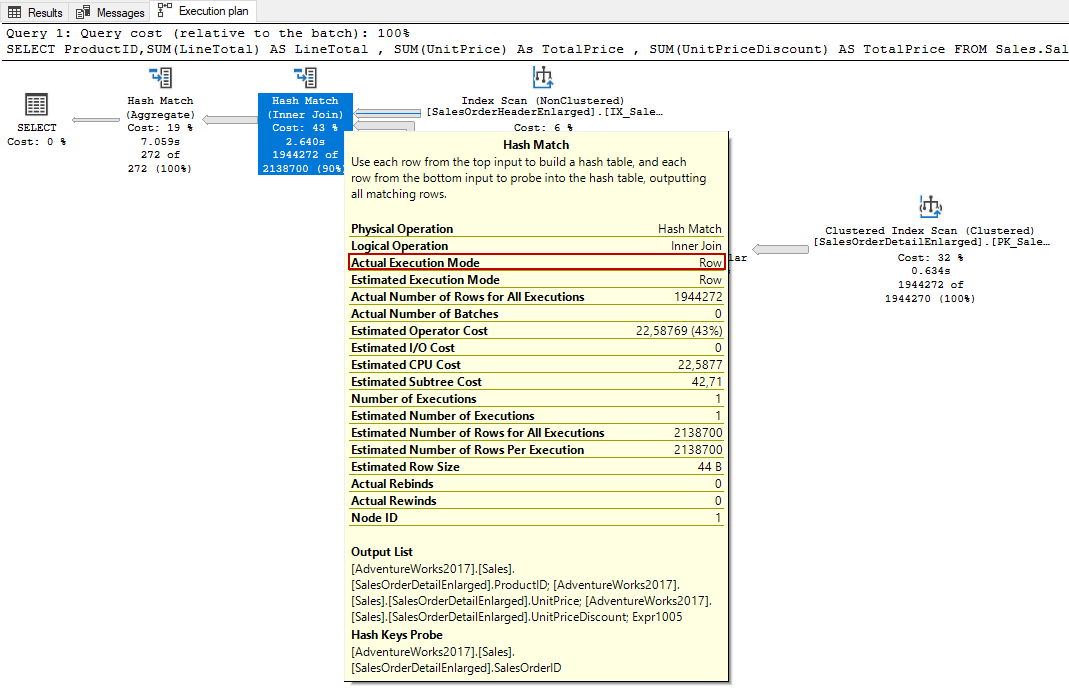
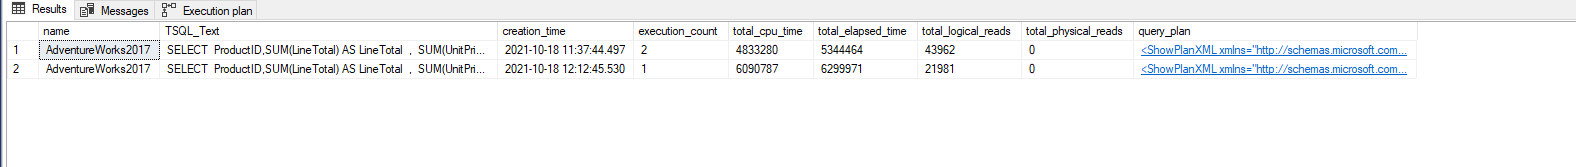
As we can see the query level usage of the trace flag has been captured. However, in the next execution of the same query, any event is not captured because the cached plan will be used. An alternative method to monitor the query-level flag activities is to use cached query plans. We can search the ‘%OPTION%QUERYTRACEON%’ pattern in the cached query plans so that we can find out which queries enable the flags.
|
1 2 3 4 5 6 7 8 9 10 11 12 13 14 15 16 17 18 19 |
SELECT databases.name, dm_exec_sql_text.text AS TSQL_Text, dm_exec_query_stats.creation_time, dm_exec_query_stats.execution_count, dm_exec_query_stats.total_worker_time AS total_cpu_time, dm_exec_query_stats.total_elapsed_time, dm_exec_query_stats.total_logical_reads, dm_exec_query_stats.total_physical_reads, dm_exec_query_plan.query_plan FROM sys.dm_exec_query_stats CROSS APPLY sys.dm_exec_sql_text(dm_exec_query_stats.plan_handle) CROSS APPLY sys.dm_exec_query_plan(dm_exec_query_stats.plan_handle) INNER JOIN sys.databases ON dm_exec_sql_text.dbid = databases.database_id WHERE dm_exec_sql_text.text LIKE '%OPTION%QUERYTRACEON%' AND dm_exec_sql_text.text NOT LIKE ('%dm_exec_query_stats%') |
Summary
In this article, we have learned usage details of the Microsoft SQL Server trace flags and how we can enable or disable the trace flags for the different scopes.

Most of his career has been focused on SQL Server Database Administration and Development. His current interests are in database administration and Business Intelligence. You can find him on LinkedIn.
View all posts by Esat Erkec
- SQL Performance Tuning tips for newbies - April 15, 2024
- SQL Unit Testing reference guide for beginners - August 11, 2023
- SQL Cheat Sheet for Newbies - February 21, 2023