
Introduction
In this article, we’re going through many of the tools we can use for monitoring SQL Server performance. SQL Server is chock-full of lots of good reports that allow a DBA to quickly spot whether there is any current performance bottleneck on the SQL Server. Many of these sit on top of DMVs but they give us a visually interactive way to look and work with the data. We’re going to start with SQL Server Performance Dashboard Reports.
Dashboard Reports
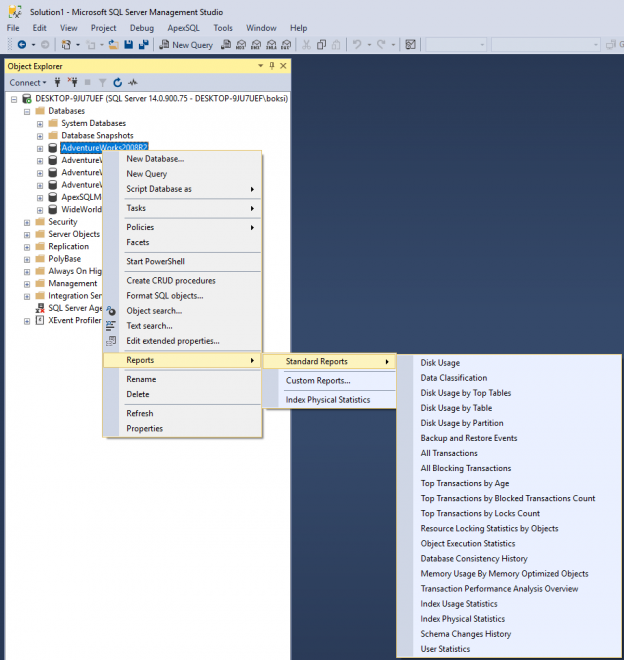
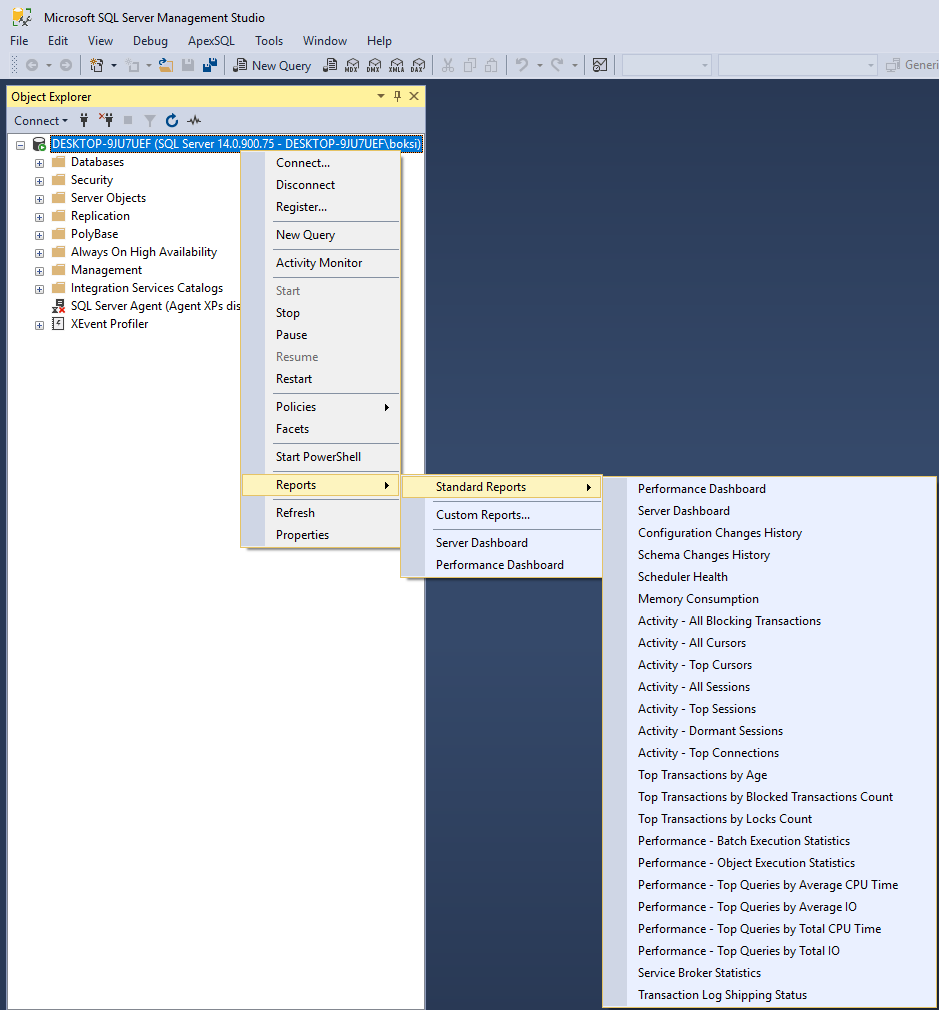
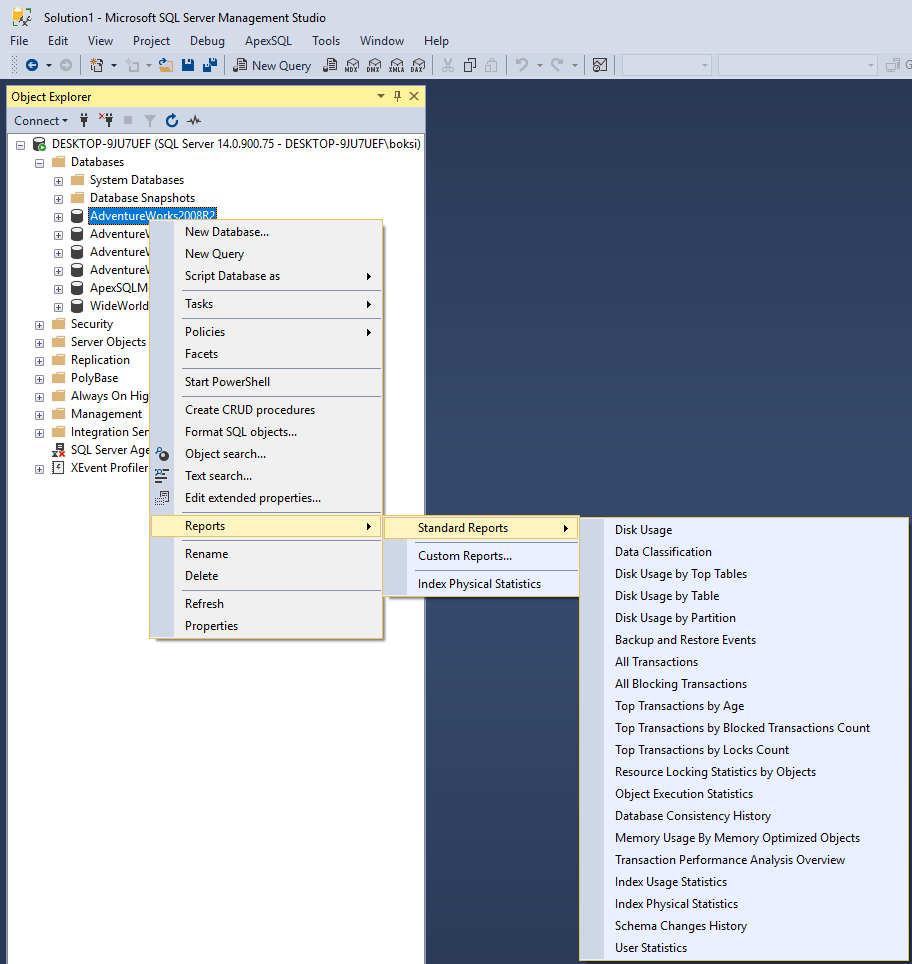
Let’s jump into SQL Server Management Studio (SSMS) and the first thing we’re going to take you through out-of-the-box dashboard reports of all levels. They can be found by right-clicking the SQL Server instance in Object Explorer, and from the context menu, you’ll find Reports > Standard Reports:
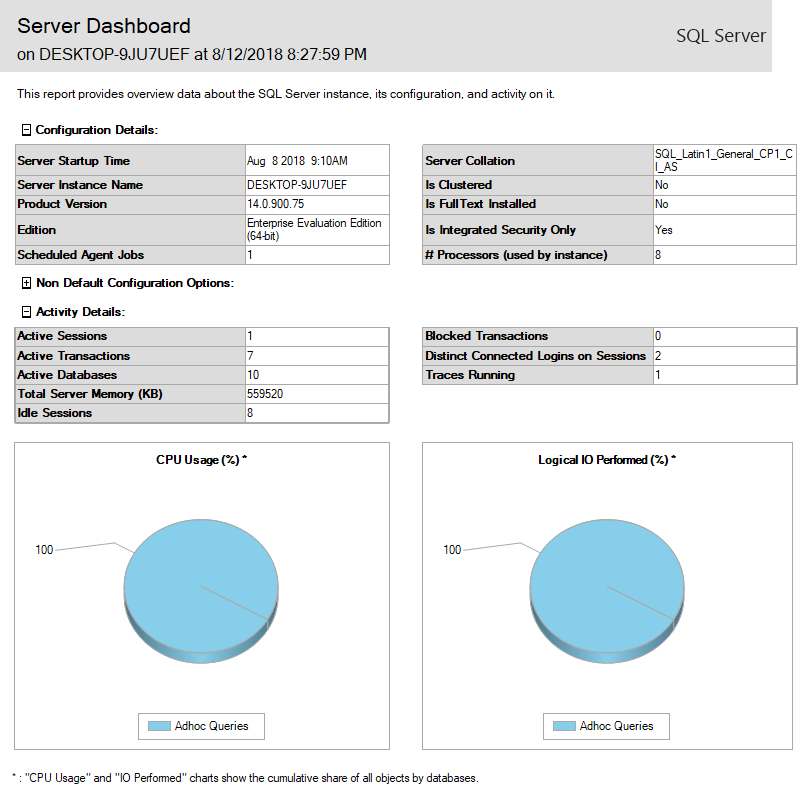
All of the dashboard reports are useful, and we are not going to go through all of them as that would require a lot of time/words though feel free to check all of them whenever you get the chance. To show an example, choose the Server Dashboard from the context menu. This report gives us a lot of information about SQL Server instance current state including its configuration, version, services, and activity on it:
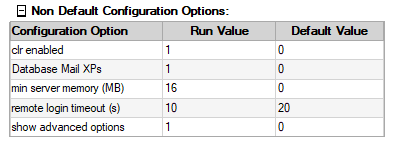
Here we also have non-default configuration options. These are the ones that have been changed from the vanilla installation:
Also, at the database level, if we right-click on a database, and go into reports, we have all kind of disk usage reports, backup and restore events, top transactions, index statistics, etc.:
So, all of these dashboard reports are great, they’re easy to consume and work with.
Activity Monitor
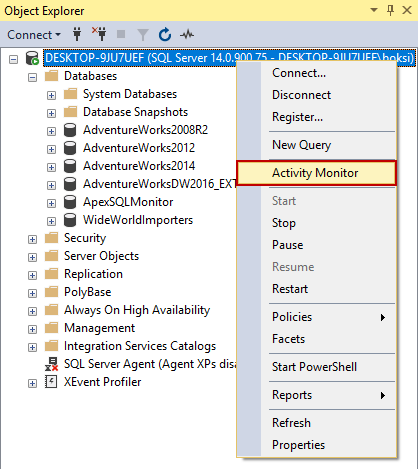
Next, we’re going to look at the Activity Monitor which is a real-time monitor within SQL Server we can use to monitor everything from performance to I/O costs to expensive queries, etc. To launch Activity Monitor, right-click on the SQL Server instance in the Object Explorer and from the context menu choose Activity Monitor. You can also launch it from the Standard toolbar, by clicking the Activity Monitor icon:
Activity Monitor has always been one of the go-to tools if something suddenly goes wrong with SQL Server performance. The first thing we see, when we fire up Activity Monitor is the Overview pane. Furthermore, this tool has following expandable and collapsible panes: Resource Waits, Data File I/O, Recent Expensive Queries, and Active Expensive Queries:
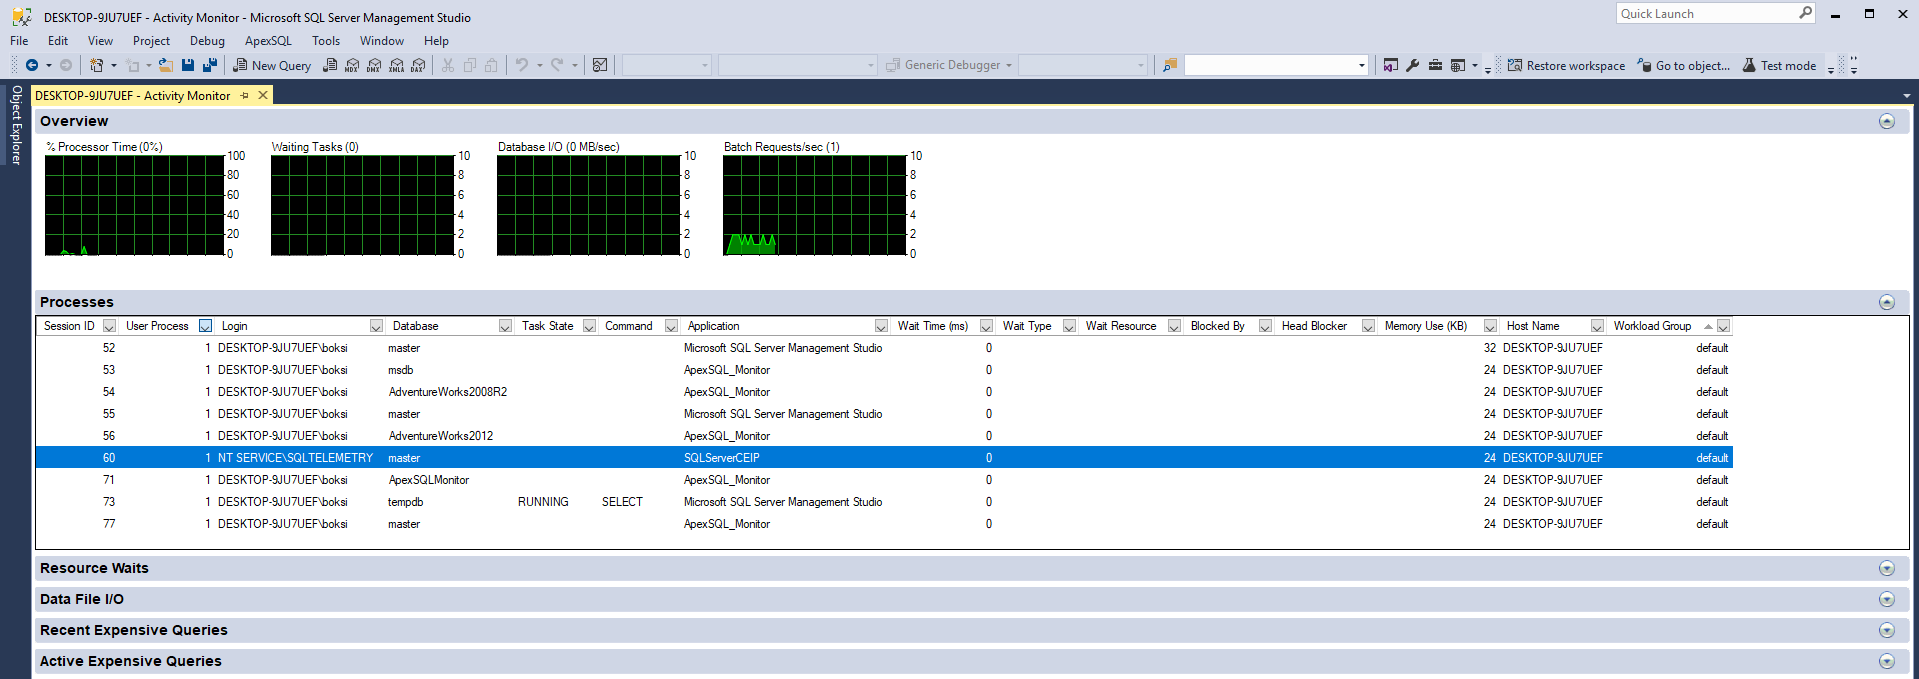
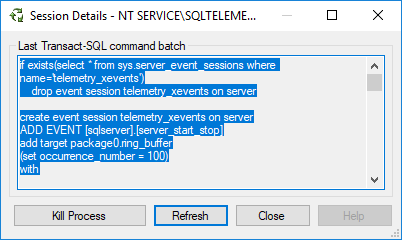
Processes – give us the ability to look at currently running processes so we can manage them. Right-click brings up the context menu from where they can be terminated, traced in SQL Server Profiler (more about it later), viewed as an execution plan, and last but not least, the session details which pops up a dialog showing last T-SQL command batch:
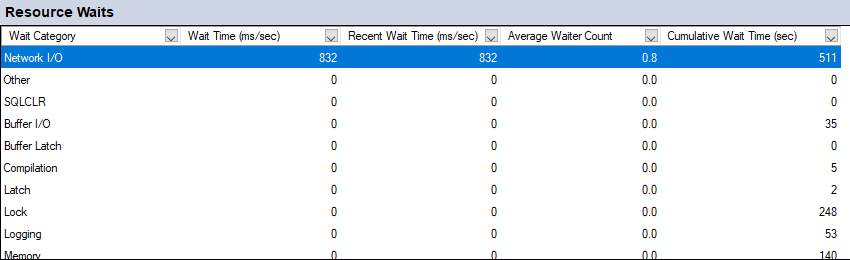
Resources Waits – shows information about waits for resources:
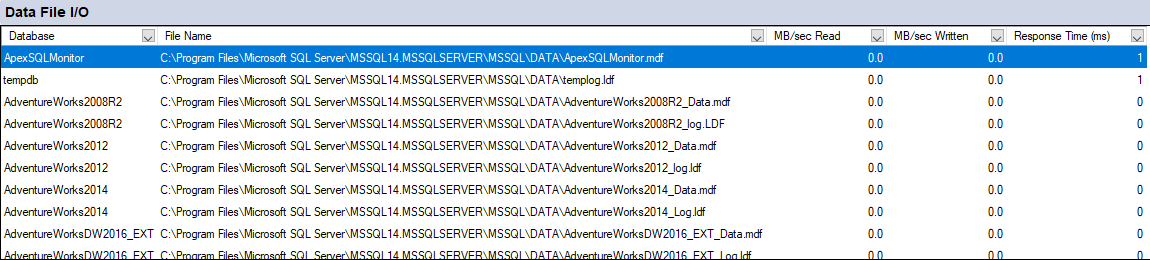
Data File I/O – shows current data file I/O information that is happening at the file level:
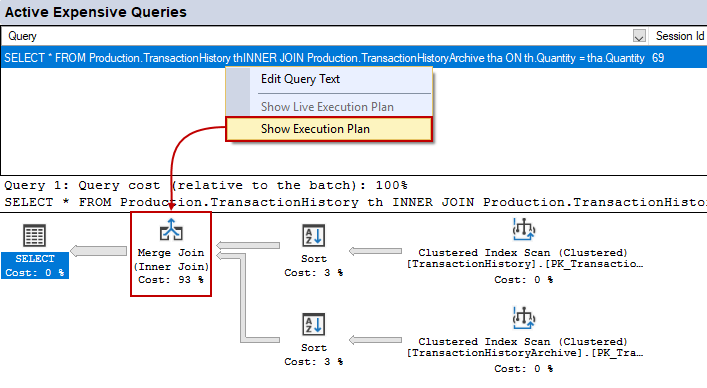
Recent/Active Expensive Queries – shows recent/active expensive queries that use many resources (memory, disk activity, network):

This is a great starting point for finding what queries are causing problems, taking too many resources, etc. because once found, they can be viewed as the execution plan so that hot spots can be easily found:
Top DBA DMVs
Moving on, let’s check out top DMVs that every DBA should know. These are the DMVs that you should always have in your pocket. To get a quick list of all DMOs (DMVs and DMFs) just query the batch below:
|
1 2 3 4 5 6 7 |
-- List of all DMOs (DMVs & DMFs) SELECT name, type, type_desc FROM sys.system_objects so WHERE so.name LIKE 'dm_%' ORDER BY so.name; |
This will return all DMVs & DMFs in SQL Server. Look at the type column and note that “V” stands for a view, and “IF” for a function:
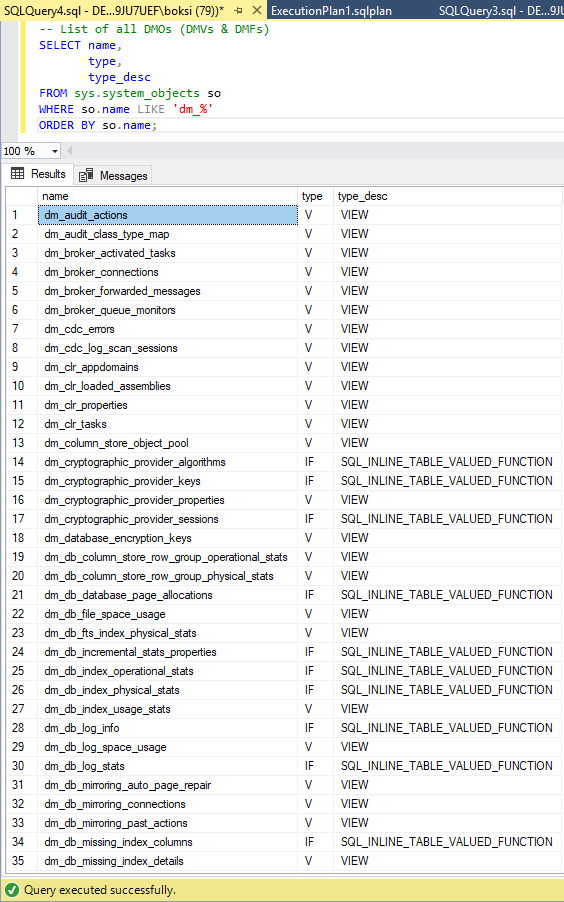
The above query returned 243 DMOs on a system. Here’s the list of the most useful ones:
Execution
sys.dm_exec_connections = Established connection
sys.dm_exec_sessions = Authenticated sessions
sys.dm_exec_requests = Current requests
Execution (query related)
sys.dm_exec_cached_plans = Cached execution plans
sys.dm_exec_query_plan = Show plan for a given cached plan_handle
sys.dm_exec_query_stats = Query performance stats
sys.dm_exec_sql_text = SQL text given a sql_handle
Index
sys.dm_db_index_physical_stats = Index size and fragmentation
sys.dm_db_index_usage_stats = index usage via the query optimizer
sys.dm_db_missing_index_details = Discover missing indexes
OS
sys.dm_os_performance_counters = List of all SQL Server performance counters and values
sys.dm_os_schedulers = Detect CPU pressure
sys.dm_os_waiting_tasks = Tasks waiting on resources
sys.dm_os_wait_stats = All waits types and stats
I/O
sys.dm_io_virtual_file_stats = I/O stats for data and log files
sys.dm_io_pending_io_requests = Pending I/O requests
CLR
sys.dm_clr_loaded_assemblies = Loaded assemblies
sys.dm_clr_tasks = CLR related tasks
The books online (docs.microsoft.com) have a great overview pages for all the DMOs. Feel free to copy any name from the result grid, paste it into the browser and search for it. Most likely the very first article at the top will be from MS docs showing the overview and usage of T-SQL.
At the very end, let’s take a peek at the SQL Server Profiler to create and replay a trace. That’s extremely useful when troubleshooting problems whether they’re from an application or internally within the database. Creating a trace allows us to capture a workload. And if that workload is the one causing problems than having the ability to reproduce that problem will make it much easier to verify if we actually fixed it when resolving the issue.
Unfortunately, Microsoft announced deprecation of SQL Server Profiler, but this feature is still available in SQL Server 2016 and will be removed in the future versions.
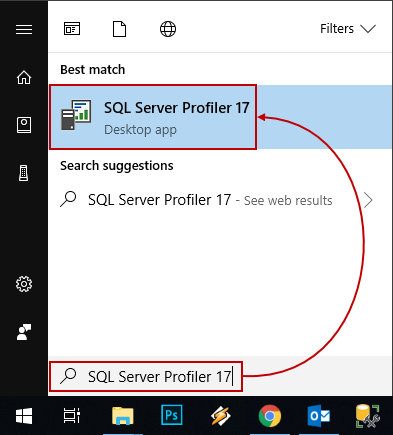
So, let’s move on to the SQL Server Profiler and see how it works. To start SQL Server Profiler, hit the Windows Start icon or press the Windows key and enter “SQL Server Profiler 17”:
Remember, the SQL Server Profiler can be initialized from Activity Monitor as well, just click the Processes pane, right-click the process that you want to profile, and then from the right-click context menu choose the Trace Process in SQL Server Profiler option.
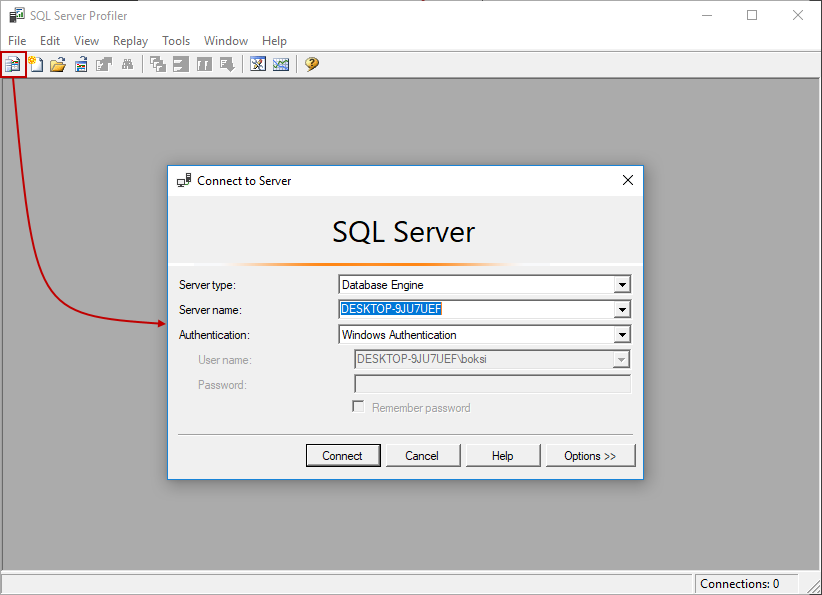
So, once this fires up, click the very first button that says, “New Trace”. This will bring up the connection dialog to your instance:
After the connection is established to the instance you want to profile and create traces against, the Trace Properties window will appear. Give the trace a name in the Trace name box. And since we want to replay this trace, select a built-in trace template because there are a couple of requirements with replays, certain events and fields need to be captured and the easy way to do this is to choose the TSQL_Replay template from the Use the template list:
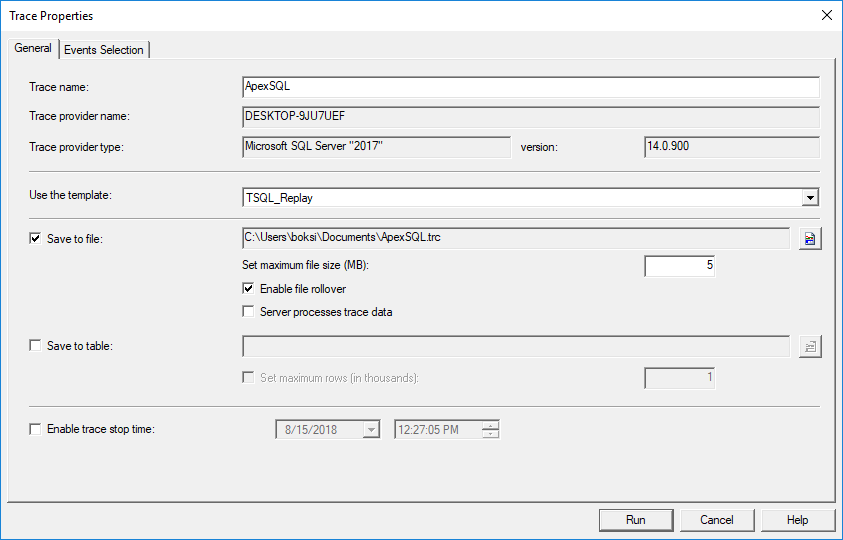
For now, save this as a file by checking the Save to file option and then change the tab to Events Selection. Since we choose a template, it’s going to preselect a lot of events. From here, you can play with the options, show all events/columns, add/remove certain events, etc.:
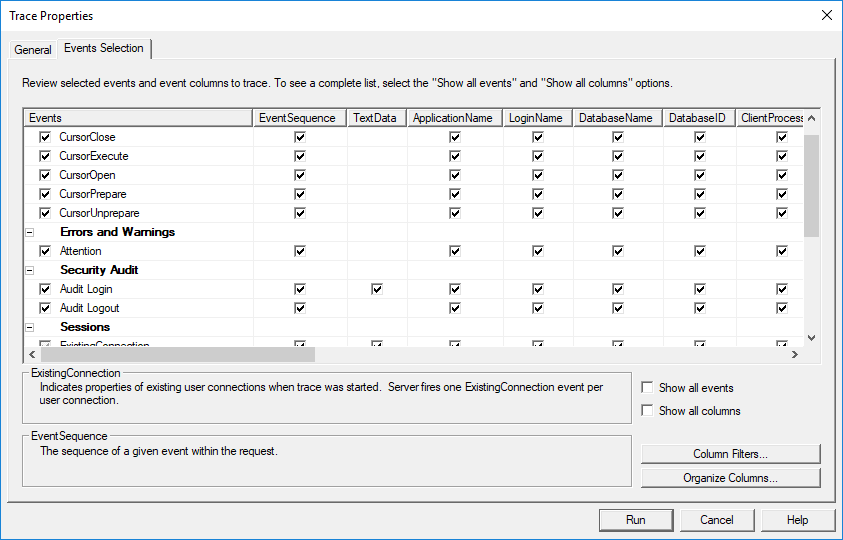
In this case, let’s click the Column Filters button to set a filter on a database name. We only want to trap events that hit the AdventureWorks2014 database. This is a great way to trim out all the extra noise that will be coming in a real-world scenario:
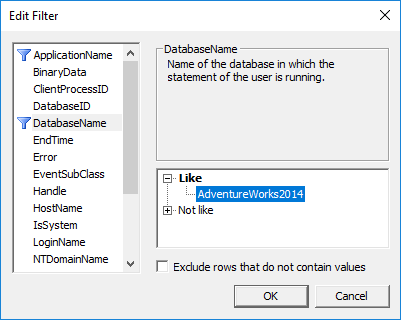
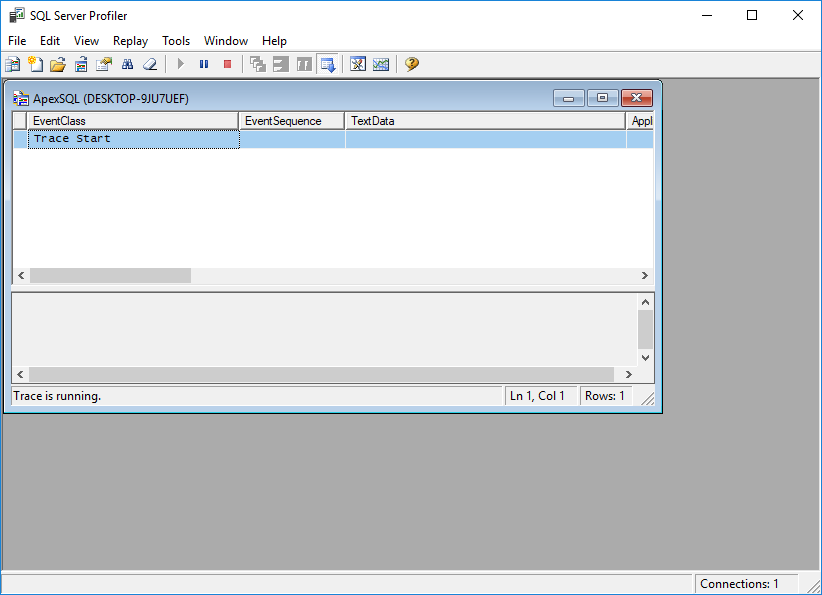
Once all this is set up, click OK in the Edit Filter dialog to save the setting and close it. Back in the initial windows, hit the Run button to start the trace. So, this trace is running now, monitoring everything that is happening in the AdventureWorks2014 database:
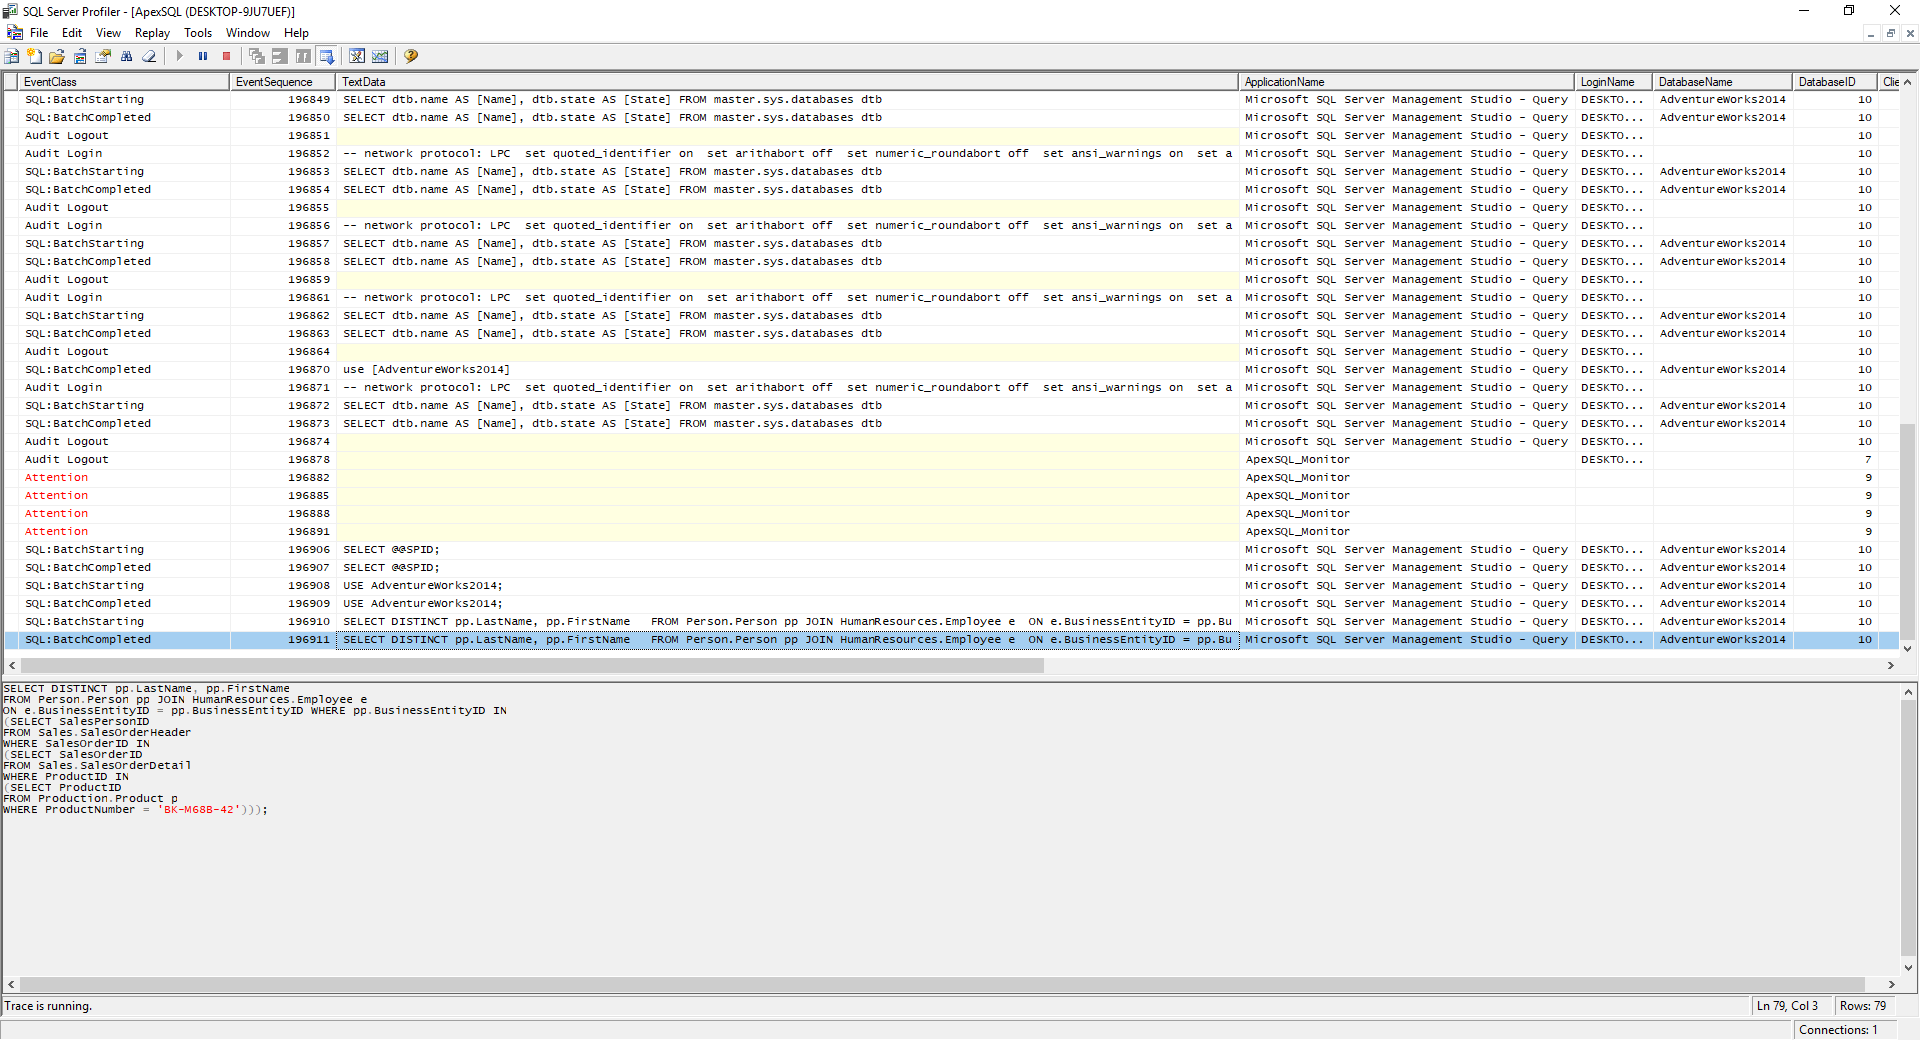
Switch over SSMS and execute some queries or just let it run in the background for a while. Various events will be captured even if no user queries are hitting the database:
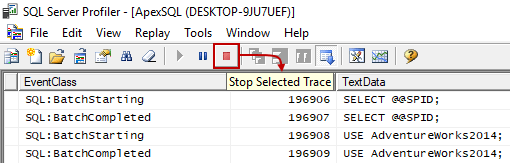
After sitting there for a while, stop the trace by clicking the red stop button as shown bellow:
Now what we got everything captured inside that previously saved file, we can for example run this replay on a different instance. Why? Because it can be extremely useful when you’re having a problem in production. It’s very unlikely that any big issues can be fixed directly on a production server. In this use case scenario, the best approach would be to copy production to test, take that trace that was captured in production, and then we can do anything we want on that test database in terms of troubleshooting and fixing the problem.
To do this, open up the trace in SQL Server Profiler:

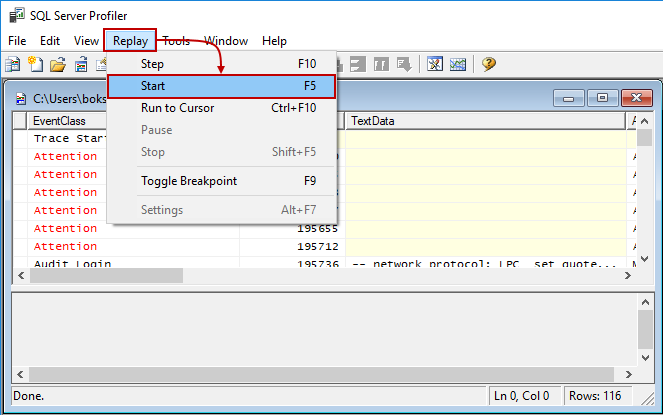
Now, go to Replay and choose Start:
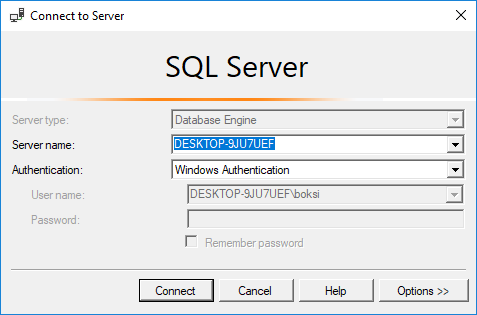
This will, once again, bring up the SQL Server connection dialog to your instance:
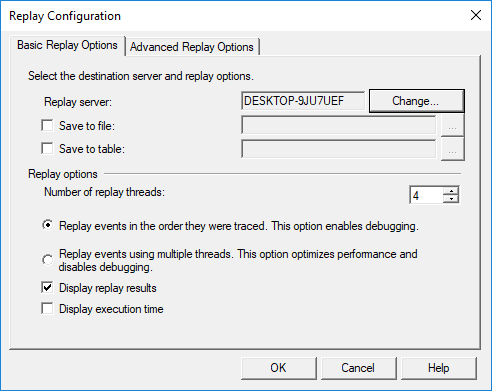
Which will then take us to the Replay Configuration window in which we can change the replay server if we need to for the purpose mentioned earlier. It’s pretty much straightforward from this point. Just hit OK to replay the trace:
The first row will always contain all the Replay Setting Event. Then anytime there is an event, it will fire off that event. The result set will only indicate that it’s done:
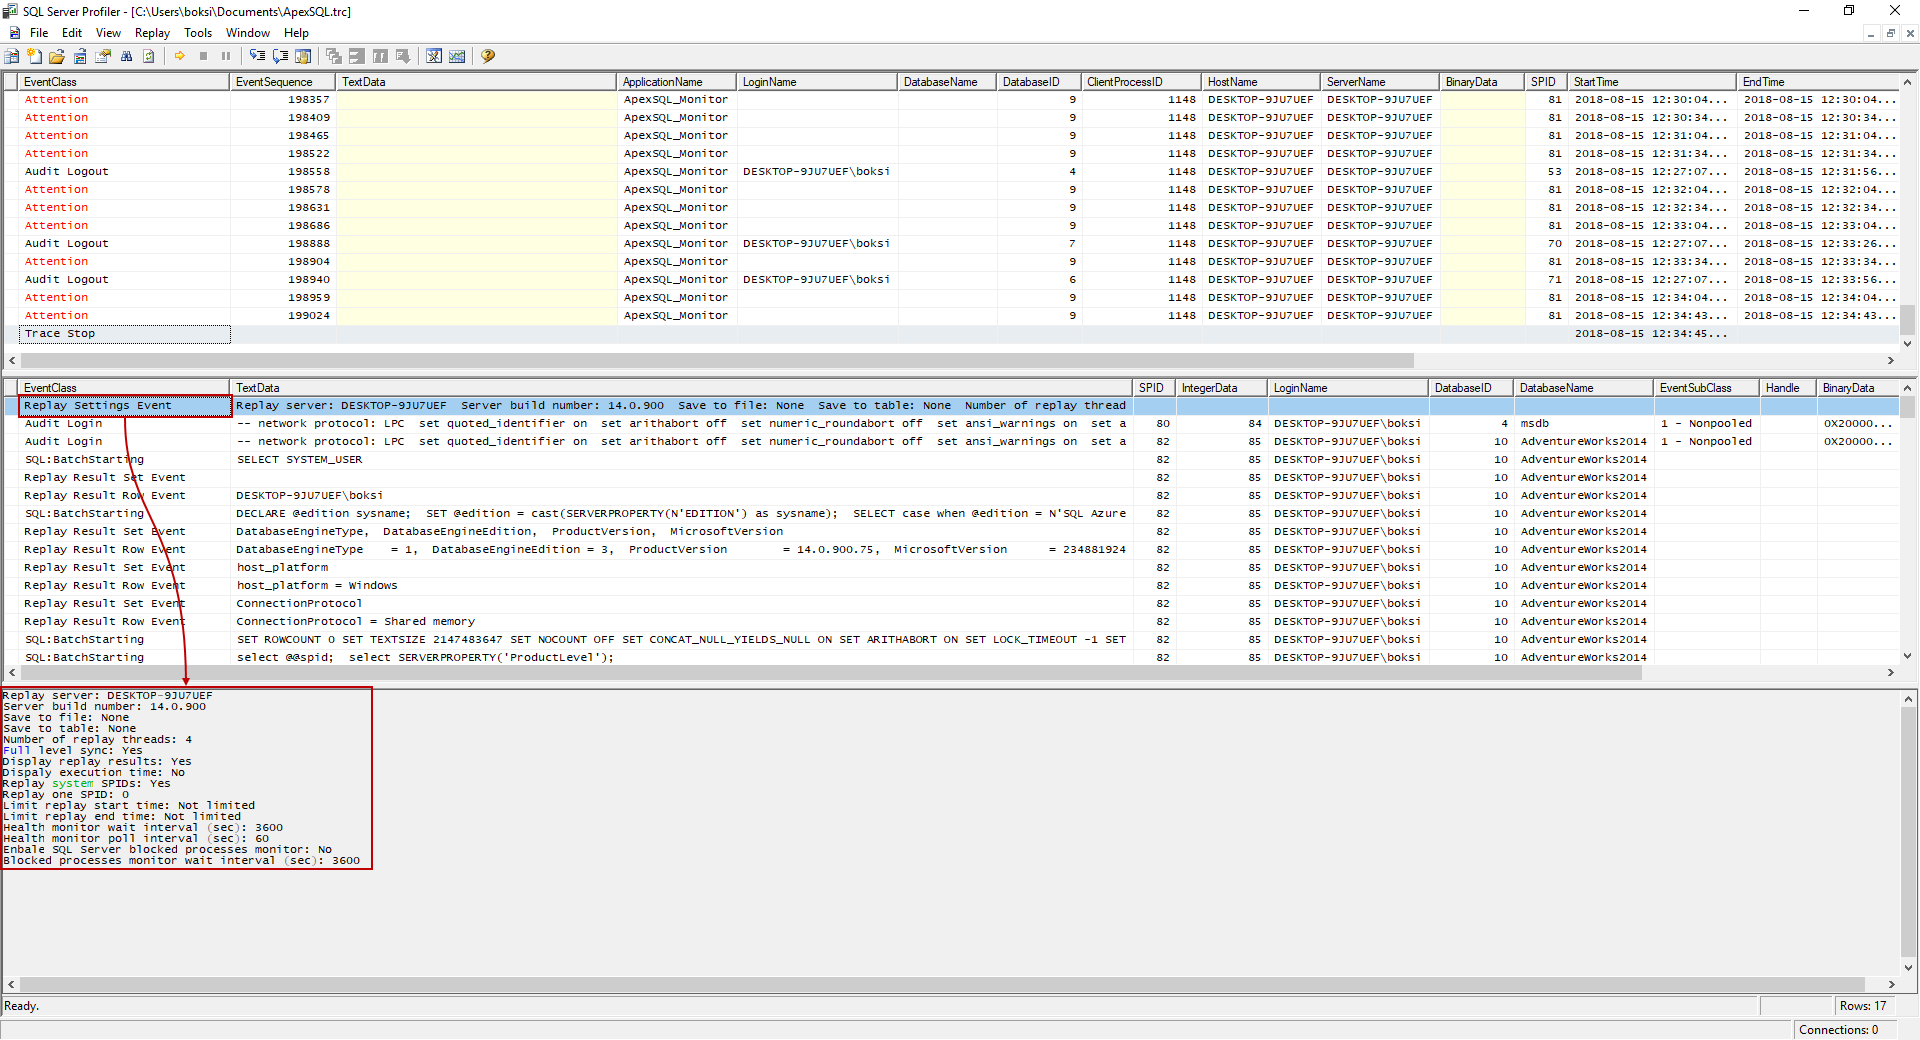
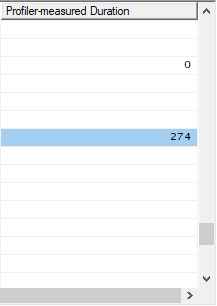
If we scroll to the right, any result set will have the profiler measured duration – how long it took to run an event:
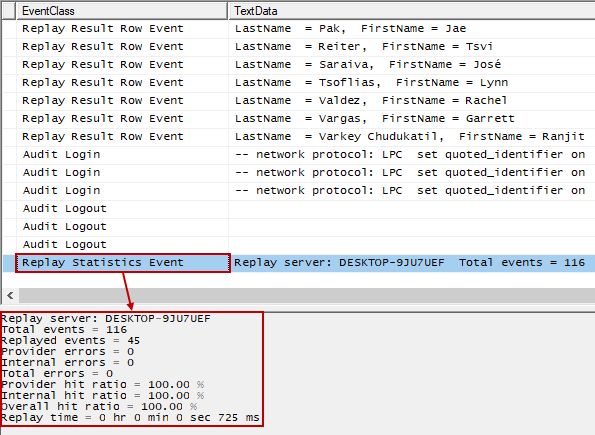
At the very end, you’ll find the Replay Statistics Event which shows the total events, provider/internal errors that occurred, hit ratio stats, and the total replay time:
Again, this is good for scenarios when there’s a problem with SQL Server performance and you want to recreate the problem. First of all, capture the problem which will then give us the workflow inside of a trace that we can do whatever it’s needed on SQL Server to troubleshoot and fix the SQL Server performance issue and then finally we can replay that trace, reproduce that issue to see if we have successfully fixed it.
Conclusion
In this article, we covered four tools for monitoring SQL Server performance. Hopefully, you’ll now be able to collect performance and system information using Database Reports for interactive visual insight on what SQL Server is doing. Then we looked at a real-time tool for monitoring SQL Server performance called Activity Monitor. We also looked at how to use DMVs and at the very end, we learned how to use SQL Server Profiler.

He has written extensively on both the SQL Shack and the ApexSQL Solution Center, on topics ranging from client technologies like 4K resolution and theming, error handling to index strategies, and performance monitoring.
Bojan works at ApexSQL in Nis, Serbia as an integral part of the team focusing on designing, developing, and testing the next generation of database tools including MySQL and SQL Server, and both stand-alone tools and integrations into Visual Studio, SSMS, and VSCode.
See more about Bojan at LinkedIn
View all posts by Bojan Petrovic
- Visual Studio Code for MySQL and MariaDB development - August 13, 2020
- SQL UPDATE syntax explained - July 10, 2020
- CREATE VIEW SQL: Working with indexed views in SQL Server - March 24, 2020