

Introduction
I had the opportunity to work and perform various tests with Database Experimentation Assistant (DEA) Technical Preview 1 (DEA v1) and also worked closely to DEA’s development team by reporting some issues and have their feedback on how to solve most of them. Some issues were really bugs and they had them fixed in this new release, the DEA Technical Preview 2 (DEA v2.0).
If you did not have a chance to read my previous articles about DEA v1, here are the links for them:
- How to download and install the SQL Server Database Experimentation Assistant (DEA)
- How to use the SQL Server Database Experimentation Assistant (DEA) tool
In those articles I have made a call for attention for how DEA v1 was only a Technical-Preview release and that things could change as they really changed for v2.0 and the goal of this article is to let you know about those changes and also the new introduced features.
NOTE: DEA v2.0 it is also a Technical-Preview release so still expecting changes for the final release.
Installation
Database Experimentation Assistant v2.0 supports migrating from SQL Server 2005 or higher versions to SQL Server 2012 and higher versions and has the following pre requisites and requirements.
Pre requisites
- SQL Server Distributed Replay (D-Replay) environment needs to exist prior to start working with DEA. If you do not have one, please read my articles about how to install, configure and use SQL Server Distributed Replay.
- The D-Replay client service account and the Windows user that will perform tasks in the DEA Application needs be configured to connect to the SQL Server instances using Windows authentication and also need to have sysadmin privileges in those SQL Server instances.
- The SQL Server service account needs to have write access to the specified trace file path.
- R components: please see the Required components section.
System Requirements
- Windows 7 or superior, Windows Server 2012 or superior
- The Microsoft .NET Framework version 4.5 or a later version.
Database Experimentation Assistant tool is available as an .exe file that can be downloaded from here: Microsoft® Database Experimentation Assistant Technical Preview 2 .
Elect a computer that respects the above system requirements (Microsoft recommends to install DEA on the same machine as Distributed Replay controller) and copy the downloaded DatabaseExperimentationAssistant.exe file into the computer and execute it and follow the below step-by-step install instructions.
NOTES:
- In this new release, SNAC 2012 and MS VC++ 20150 Redistributable will be installed during DEA’s installation if they were not installed previously.
- If you install DEA v2.0 in a computer different from where the Distributed Replay controller is then assured that you have SSMS installed so it can execute a remote call to the Distributed Replay controller with the DReplay.exe file.
-
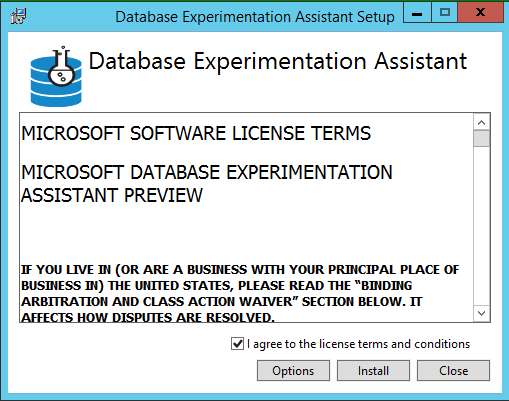
The first screen is the ‘End User License Agreement’ page. Select “I agree to the license terms and conditions” option and click Install. In case you want to provide and alternative installation path, click on Options:

- If SQL Server Native Client is not already installed, it will pop-up the respective installation wizard so it can be installed. Just accept the terms in the license agreement and keep clicking the Next button until the SNAC 2012 is installed.
- If MS VC++ 20150 Redistributable is not installed, it will pop-up the respective installation wizard so it can be installed. Just accept the terms in the license agreement and click the Install button to have it installed.
-
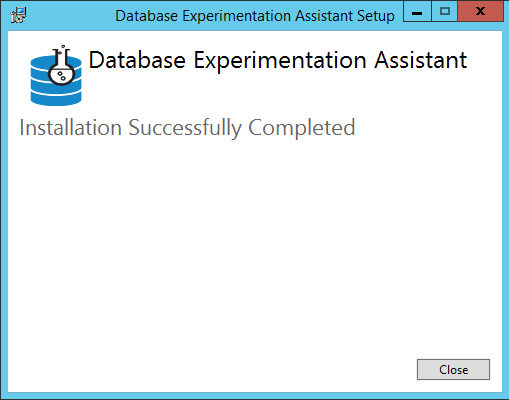
After the prerequisites were installed, DEA’s v2.0 installation will proceed automatically and when finished click Close to exit from the installation wizard:
-
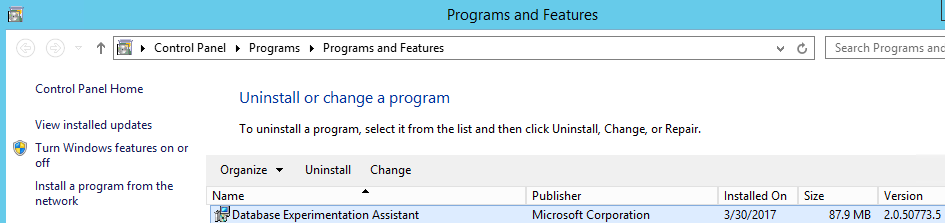
You can now confirm in Control Panel / Programs and Features that Database Experimentation Assistant is installed:
With these we have done with the DEA’s installation and it can be used immediately if the prerequisites have been fulfilled (see the next section).
Required components
Database Experimentation Assistant has three main features:
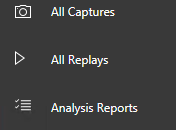
For the All Captures and All Replays options there is no need for extra components, but Analysis Reports has prerequisites that requires extra components to be installed in the same computer. When choosing this option without having one or more of those components installed a screen similar to the below one will be presented to you:
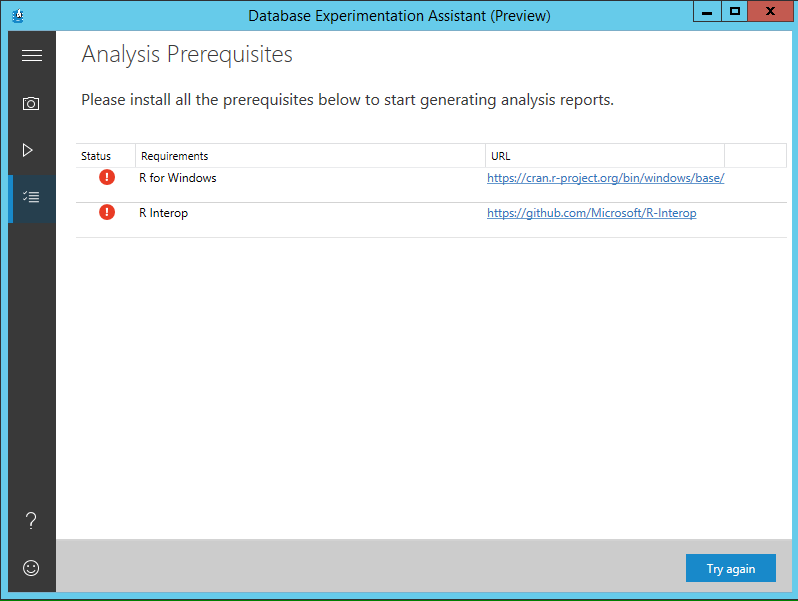
NOTE: If your computer already has those components installed, you won’t be able to see the above screen, meaning that you can immediately use the Analysis Reports option so no need to follow the below instructions.
For each of those necessary components there are, on the right side, direct links to download them.
R for Windows
R is a free open-source language for statistical computing and graphics and you can get the last version for Windows (is R-3.3.3 at the time I am writing this article) 32bit and 64bit, from R-3.3.3 for Windows (32/64 bit)
After downloaded and copied into the target machine, execute the installation file (R-3.3.3-win.exe).
It is a very straight forward wizard so just accept the defaults during the installation.
JSONLite library
Check in the R installation path (default is: C:\Program Files\R\R-3.3.3\library) for a library called jsonlite. If not present, then you will need to download it from jsonlite: A Robust, High Performance JSON Parser and Generator for R and manually copy or extract it into the R library subfolder. This will permit the generation of the reports for the Analysis Report option.
R Interop
It is a Microsoft .NET managed abstraction layer for communicating with R and can be downloaded from .NET managed abstraction layer for communicating with R
Download R Interop from the above link and copy the file into the target machine and run the RInteropSetup.msi file. It will then pop-up the license agreement screen. Check the “I accept the terms in the License Agreement” option and press the Install button and wait until is completed and then press the Finish button.
With this you should have all prerequisites fulfilled and you can start now working with the Database Experimentation Assistant.
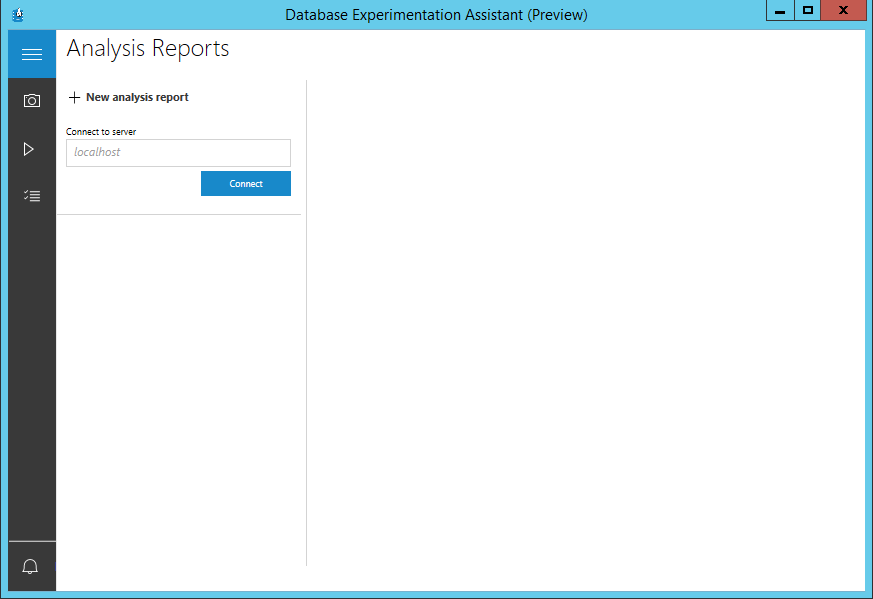
This can be confirmed in DEA tool by accessing the Analysis Reports option. You should see a screen similar to the following one (the Prerequisites screen should not appear anymore):
How to use
After installed, to start to use DEA v2.0 click on the respective icon in the desktop area:

And this will load DEA v2.0 welcome screen:
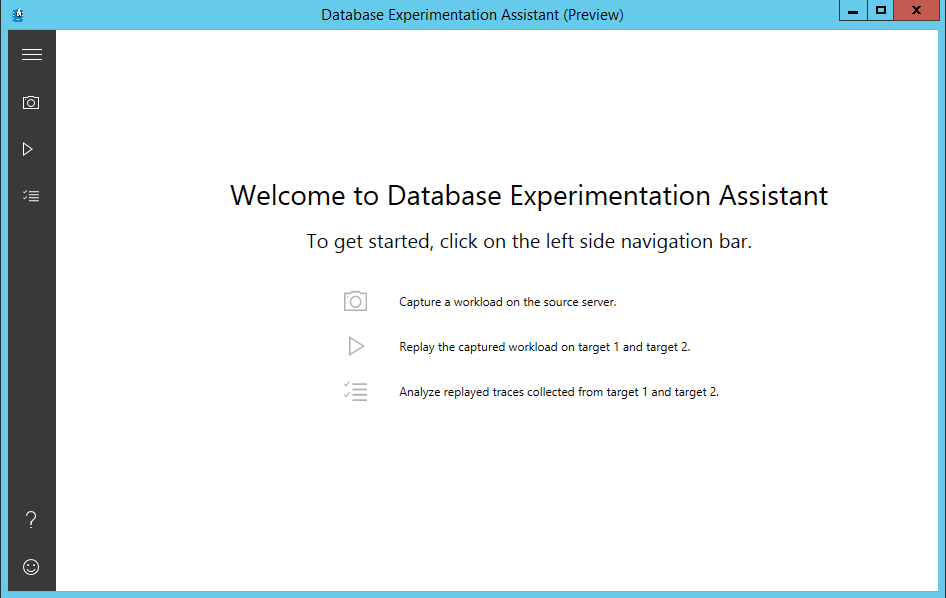
The tool has three main features that can be found on the left side of the navigation bar:
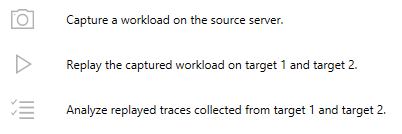
- Capture a workload: Start a trace to capture a workload from the source database(s).
- Replay captured workload: Replay the previous captured trace on target SQL Server instances.
- Analyze replayed traces: Generate and review generated reports which provide insight about the workload performance across the targeted SQL Server instances.
Capture a workload
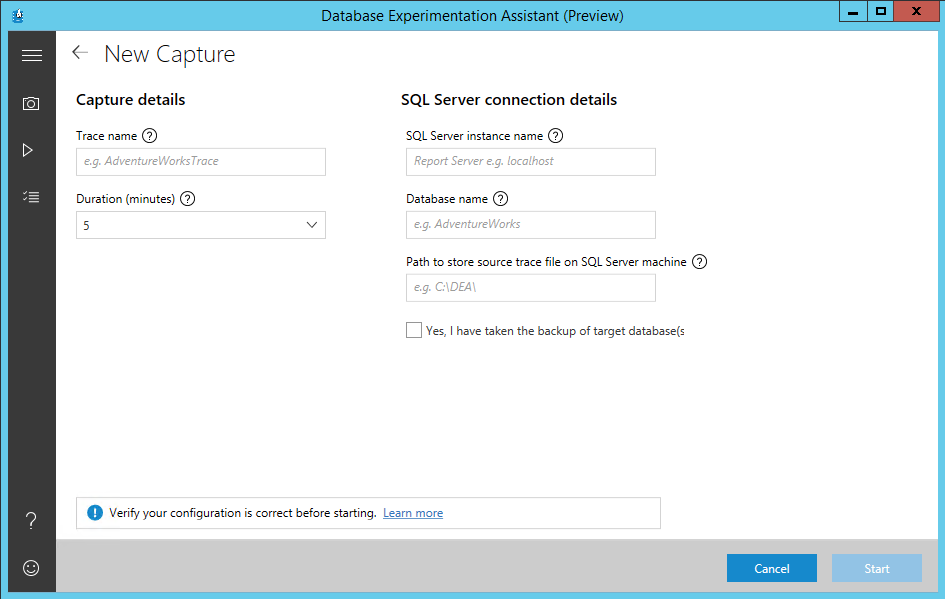
Important: Before starting any Capture, it is very important to back up the database or databases that will be traced. This will guarantee that captured trace will be replayed in the target databases (restored from the required backup) at the same state, so the experimentation results will be more reliable.
Use this option to capture a workload from the source SQL Server instance by producing a trace file (.trc) based on TSQL_Replay template and it will request the input of some necessary information to produce the necessary trace file as giving the Trace a name and the source SQL Server instance name where trace will run to capture the Database workload (if a database name is not provided the trace will capture the workload of all the databases on the source SQL Server instance), provide the destination path to store source trace file on SQL Server machine, set the duration for the trace running in minutes (default is 5 minutes) and check the box “Yes, I have taken the backup of target database(s)” and then the Start button will be enable. Click on it to start the new Capture:
You will be able to see the progress of a capture workflow:
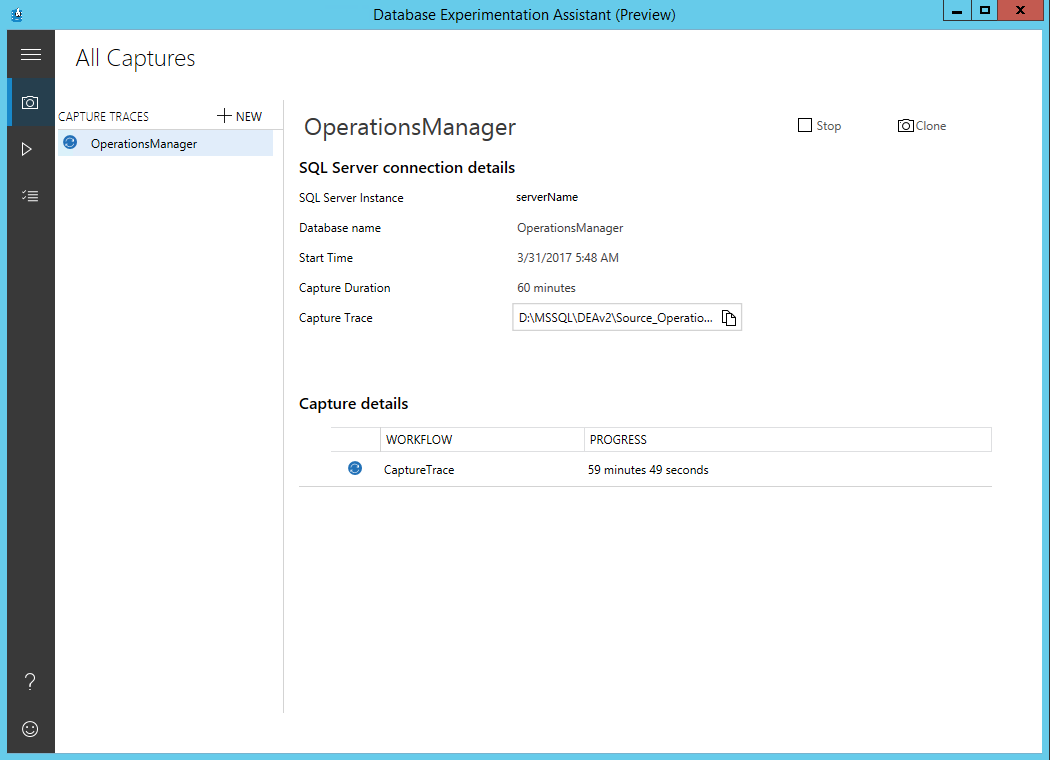
There are two new options relatively to DEA v1. Now you can stop the trace (Stop check box) so you do not need to wait until the end of it and Clone to create a new capture with the same information of the actual one (it will let you perform any change before starting the new capture).
Check this article to know what kind of information is being captured and how to solve known issues during the Capture phase: DEA 2.0 – Capture Trace FAQ
When the Capture process finish with success, copy the generated trace file(s) to the Distributed Replay Controller machine and into the target SQL Server instances machines. Those trace files will be used during the Replay phase.
Replay captured workload
Replay process will allow you to replay the trace files (.trc) created during the Capture process from the source database(s) on the target SQL Server instances.
This action must be performed twice:
- Once on the target SQL Server instance (A) that should have the same configuration as the source SQL Server instance where the trace has been captured from.
- Once on the target upgraded SQL Server instance (B) that should have the same configuration as the final SQL Server instance where the source database will be migrated to.
After the backup of the source database(s) have been restored in both target SQL Server instances and the D-Replay environment is up and running then the Replay can be configured and executed.
Start a new Replay by clicking in “+ New Replay”. This will load the page with the required fields to be filled up with the necessary information as given a name for the Replay (the name will be used to produce the target traces), the D-Replay Controller machine name and the Path to source trace file (include the trace file name in the path) previously Captured and copied into the D-Replay Controller server, the target SQL Server instance name and the path to store the target trace files (the path must exist in the target SQL Server instance and SQL Server service account must have write permission on it). With all those information provided, check the “Yes, I have restored the database(s)” option and the Start button will be enabled:
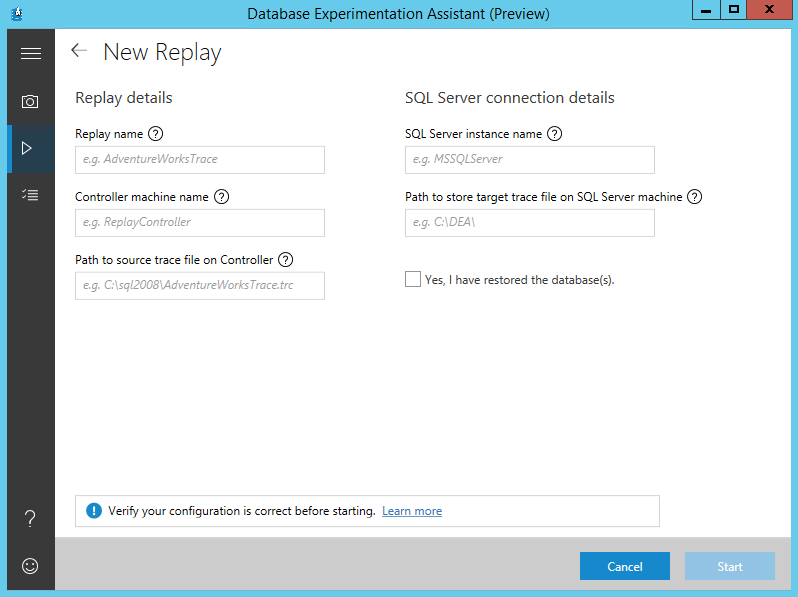
NOTE: As opposite from the previous version, in this new version there is no need to provide D-Replay Clients as it will use all registered clients in the Controller.
The Replay process will start and the Replay progress can be followed in the screen:
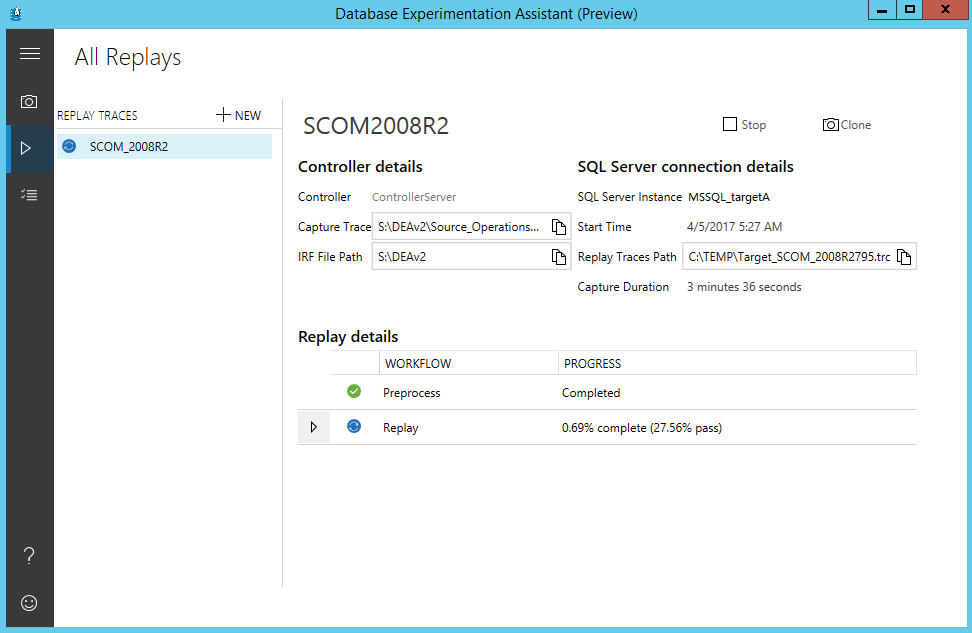
When the Replay finish to run for the target 1 SQL Server instance, repeat this process for the target 2 SQL Server instance.
NOTE: In case of facing errors during the Replay phase, check if your D-Replay environment is correctly configured as explained in this article. A DEA 2.0: Replay FAQ is also available for consultation.
Analysis Reports
This option allows the generation of an analysis report by using the replay traces generated by the Replay option. With that we will gain insights on performance implications of the proposed change.
Provide the SQL Server instance name where the Analysis Reports databases will be created and press the Connect button:
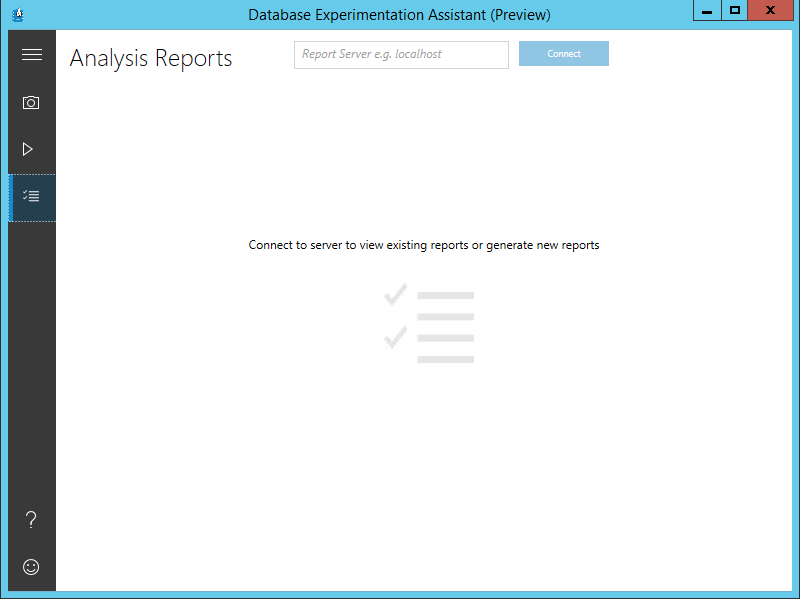
A + New analysis report option will appear. Click on that option to proceed.
NOTES:
- This option requires R components as prerequisite, so if you see a similar screen to the below one when choosing this option, please read the respective Required Components section in this article to see how to have them installed.
- With this option you can also review previous generated reports that are stored in the provided SQL Server instance.

After clicking on + New analysis report a screen similar to the below one will be presented and fields are required to be filled as a name for the Report and the SQL Server instance name where the Analysis databases will be created (the report name will be part of the database names). Provide also the path with the file name for the traces originated from the Replay option for Trace for Target 1 SQL Server and Trace for Target 2 SQL Server (if trace files are stored in different server then you must provide the full network path as \\servername\sharename$\tracefilename.trc):

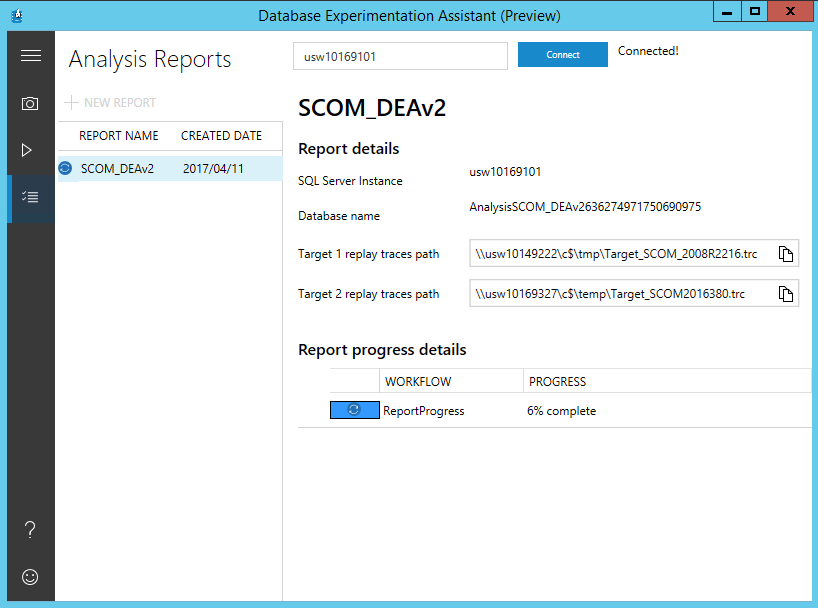
Click on the Start button and Analysis will process and respective Reports will be generated. A workflow progress is available to verify the details:
When completed successfully, a similar screen as the below one will be presented with the Analysis Report so you can compare the query executions against the Target SQL Server instances.
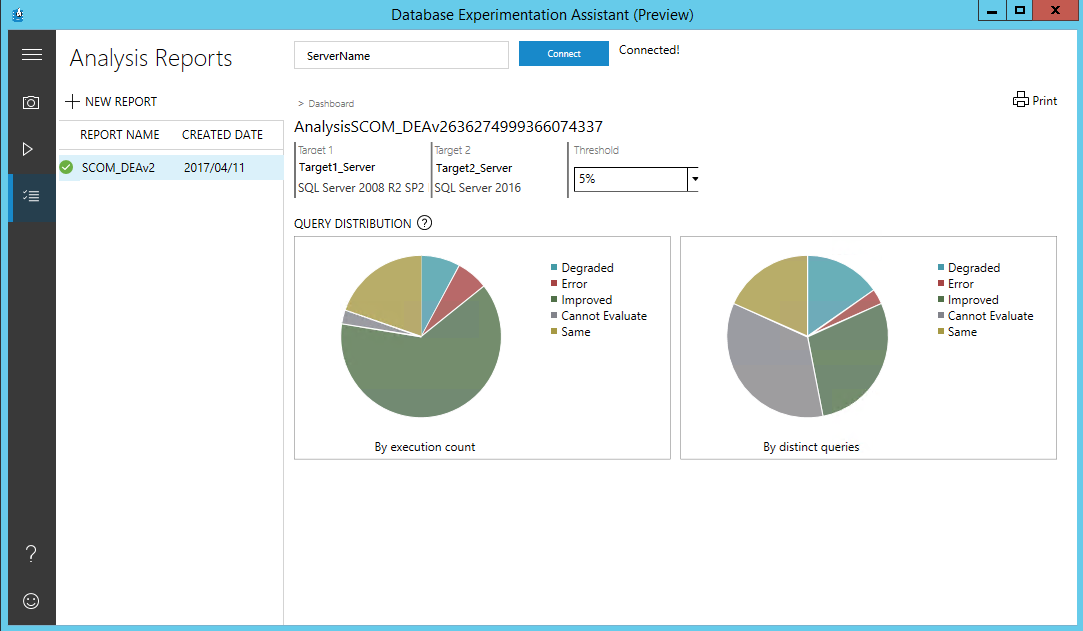
To Analyze the Report just drill down into each item where you can see which queries originated errors and identify which one were degraded, improved or just had the same performance.
The more you drill down, the more information you will have access to, including the query plan for each query execution so they can be compared.
If you have issues during this phase, check DEA 2.0: Analysis FAQ for how to resolve known issues.
This is a generic way to show how easy it is to evaluate the issues and have the necessary information to try to solve them before going forward with the migration.
Removing Database Experimentation Assistant
After finishing upgrading databases and if not needed anymore, you can uninstall the Database Experimentation Assistant (DEA).
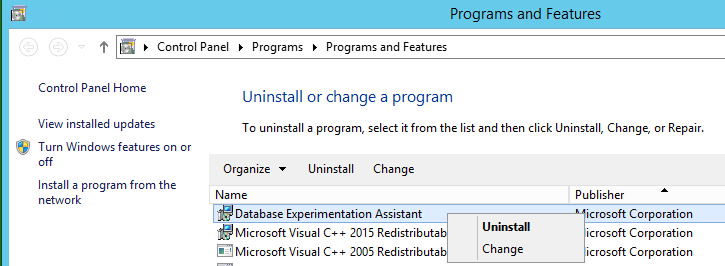
DEA can be uninstalled by using Add or Remove Programs feature following these steps:
- Go to Control Panel and open Add or Remove Programs.
-
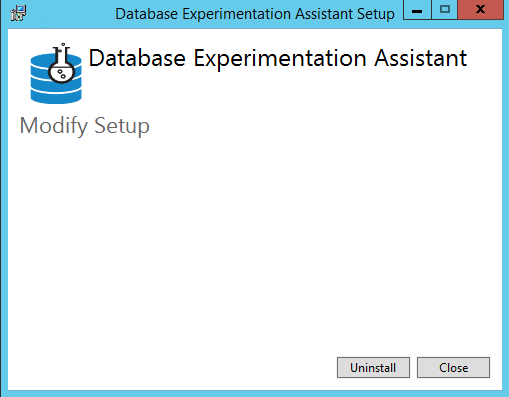
Find the Database Experimentation Assistant, right-click on it and then click Uninstall.
-
Click Uninstall to proceed:
-
Click Close to exit:
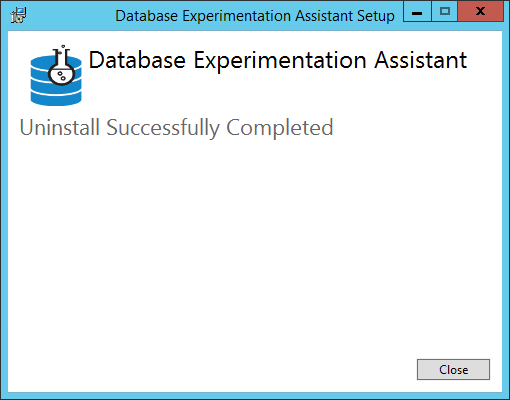
With that, DEA has just been uninstalled.
NOTE: Any required components that have been installed with DEA v2.0, as SNAC 2012 and MS VC++ 2015 Redistributable, will not be removed when uninstalling DEV v2.0. They should be uninstalled separately.
Previous articles in this series:
- How to download and install the SQL Server Database Experimentation Assistant (DEA)
- How to use the SQL Server Database Experimentation Assistant (DEA) tool

He participates in some SQL Server forums, helping other professionals solving SQL Server issues and acting as their mentor whenever is possible.
Vitor also has a website with some useful information about SQL Server: https://f1-sqlserver.wixsite.com/f1-sqlserver
View all posts by Vitor Montalvão
- An introduction to sp_MSforeachtable; run commands iteratively through all tables in a database - August 18, 2017
- SQL Server system databases – the model database - August 9, 2017
- SQL Server system databases – the msdb database - July 14, 2017