
Microsoft Power BI supports two different languages, M language and DAX (Data Analysis Expression) that can be used to filter, manage, and visualize data.
M can be considered as a query formula language and it can be used in the Power BI Query Editor in order to prepare data before it can be loaded into the Power BI model.
On the flip side, DAX is an analytical data calculation language which can be used for in-depth data analysis during the Data View phase.
M and DAX are not dependent upon each other and follow totally different structures and logics, and have different underlying codes. M and DAX cannot be used simultaneously since the M language is used in Query Editor while DAX is mostly used in the Data View model.
This blog post will show you how M and DAX differ from each other in Power BI, with the help of examples. See this article for a quick introduction to DAX.
Importing the Dataset
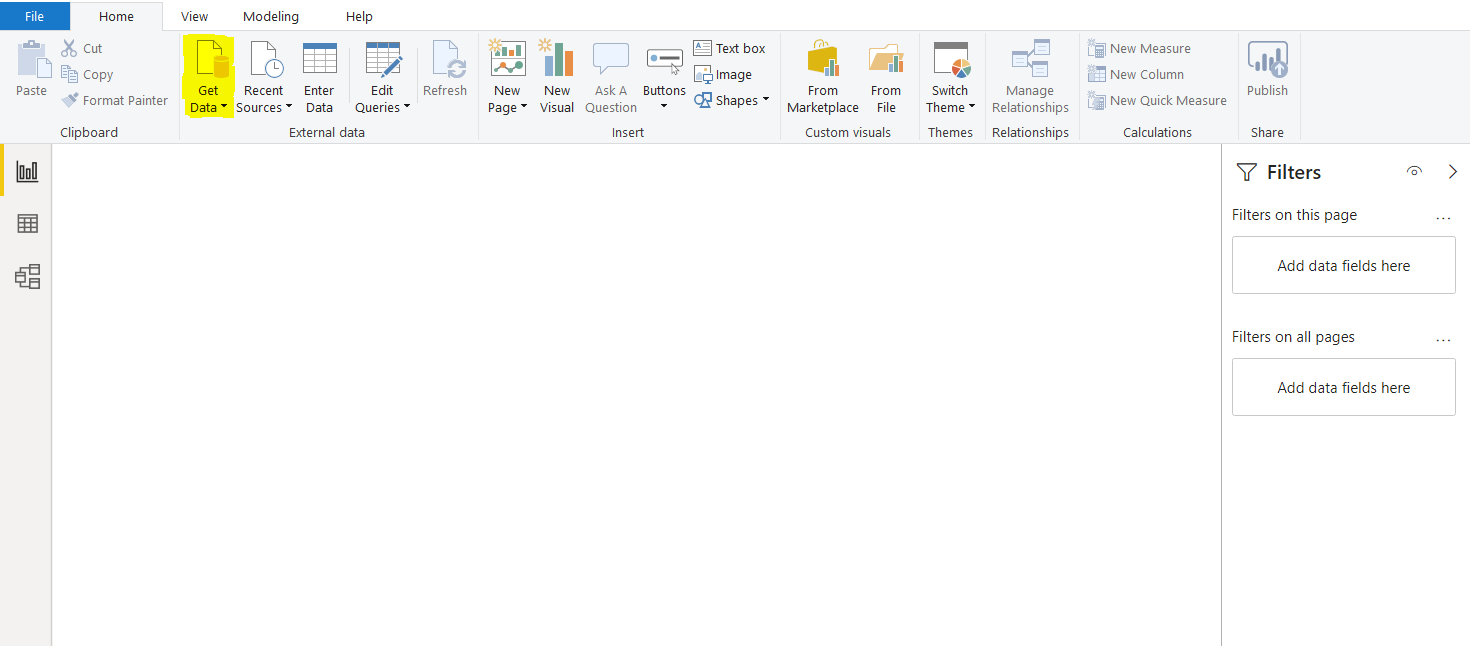
In this section, we will import a dummy dataset that we will use to execute our M Language and DAX queries. To do this start by clicking the “Get data” button in the top menu as shown in the following screenshot.
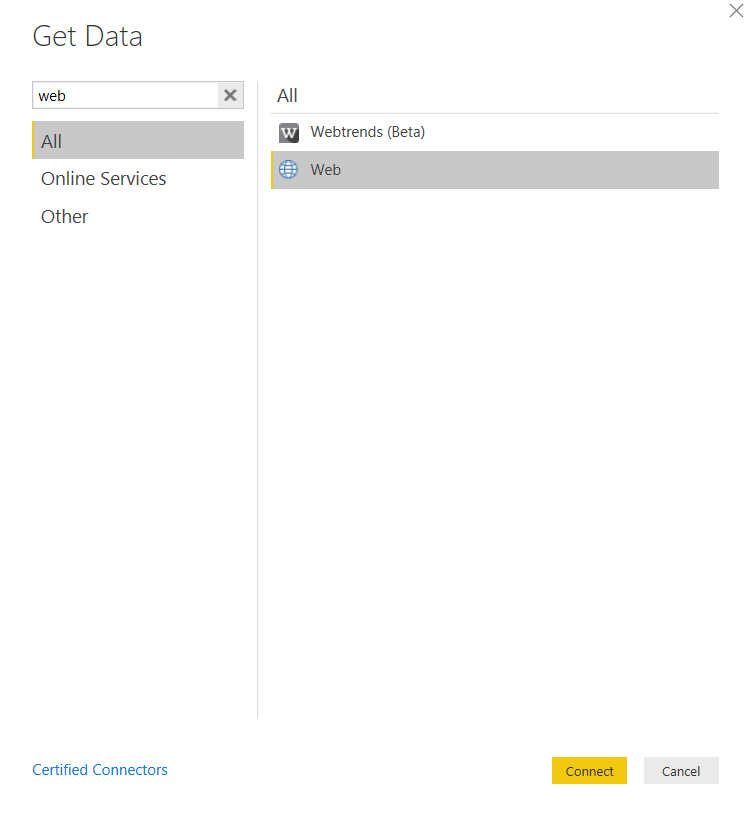
A new dialogue will list all the data links open to Power BI.
Insert web” into the search section, and very shortly a Web” data option will appear and also an icon will show in the All data source options. Select the Web” option and then click “connect” at the bottom. This is clear in the screenshot below.
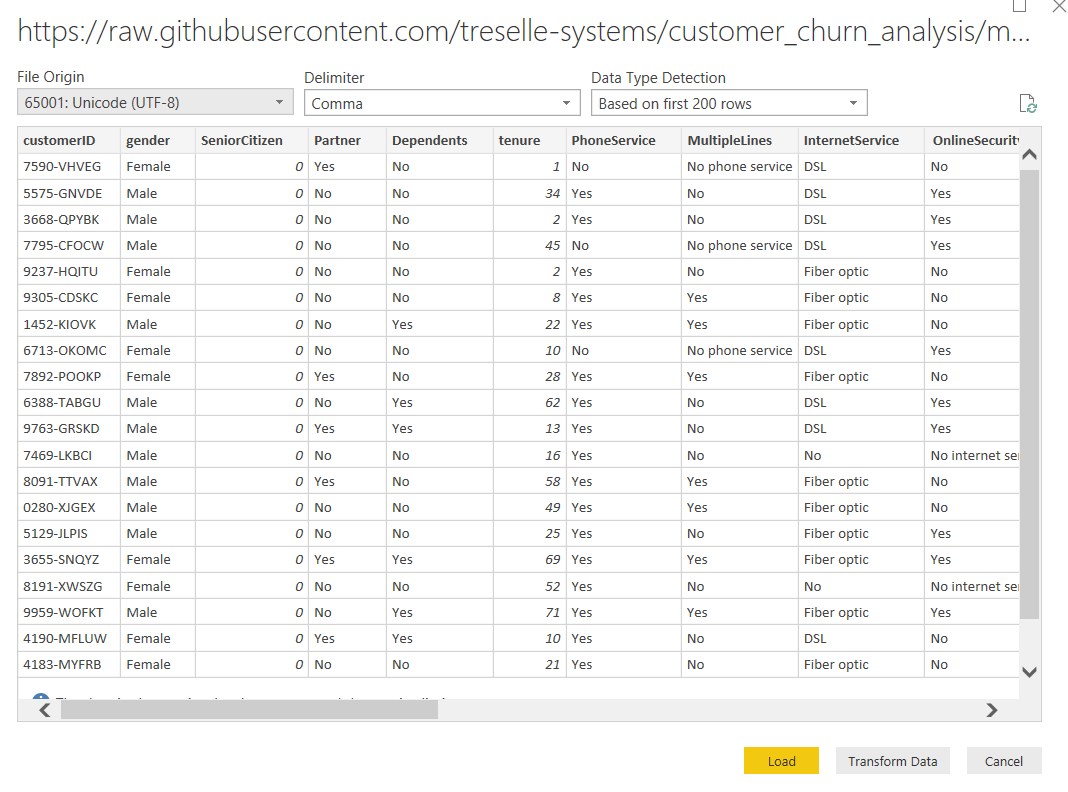
The dialogue window you can see in the screenshot below will appear. You now need to insert the URL below into the field labelled URL:
Click “OK” to confirm when this is done.
Here is a screenshot for your reference:
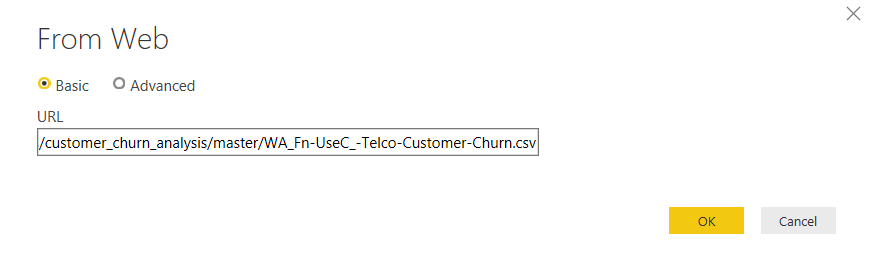
This URL takes Power BI to Github which holds the CSV data file that we need. The data file details a telecom customer churn dataset. It contains data about the customers of a telecom company, that left the company after a certain period.
Depending upon the size of the file, it might take a while to download the data from the remote site.
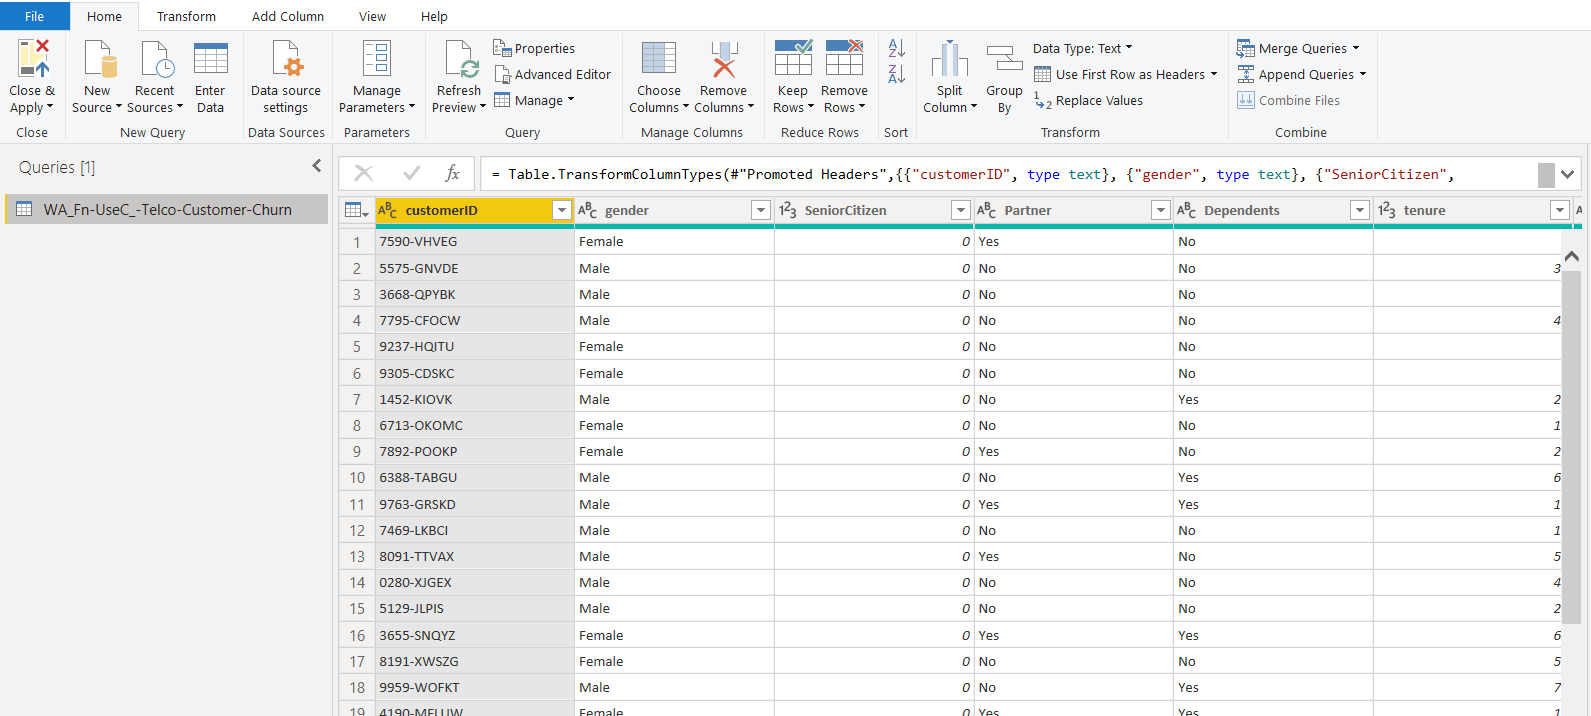
Once the data is downloaded, you have two options: either you can directly import the data to Data/Report View, or you can first load the data into Query Editor. Since the M Language works in the Query Editor, we will first load the data into the Query Editor by clicking “Transform Data” as shown in the following screenshot:
You will see that the dataset contains information about a customer, such as a gender, tenure, phone service, internet service, dependents etc.
Once you click the Transform button, you should see the following Query Editor.
Differences between M Language and DAX
In the previous section, we connected Power BI to a dummy dataset on GitHub. In this section, you will see with the help of examples, the differences between M Language and DAX.
M Language
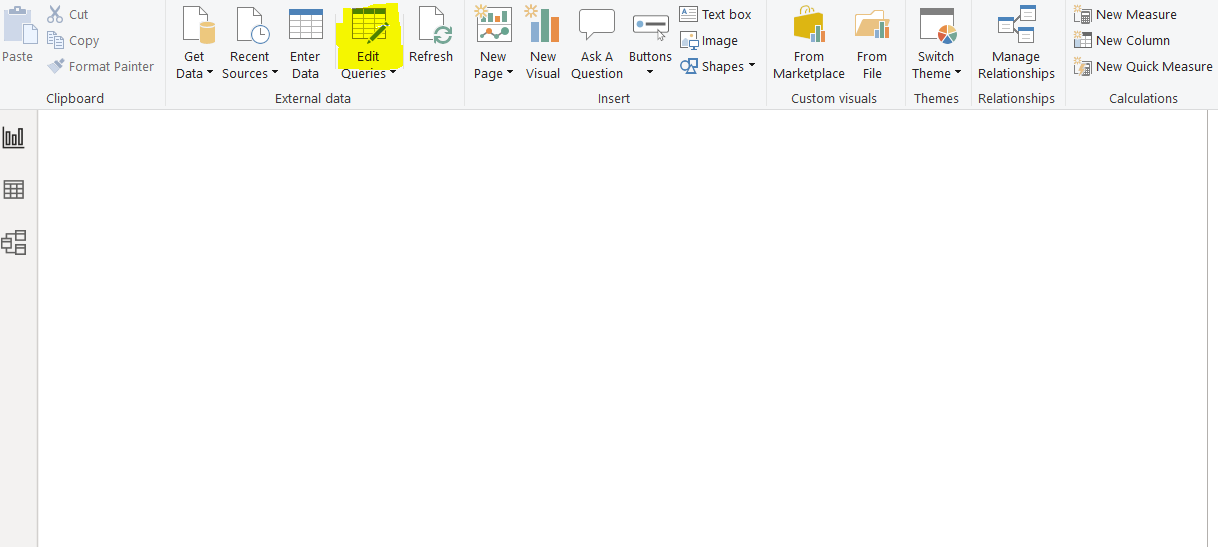
First, we will see what M is and how it is used in Power BI. As I said earlier, the M Language is used to manage and filter data in the Query Editor. If you have closed the Query Editor, you can open it by clicking the “Edit Queries” option from the top menu.
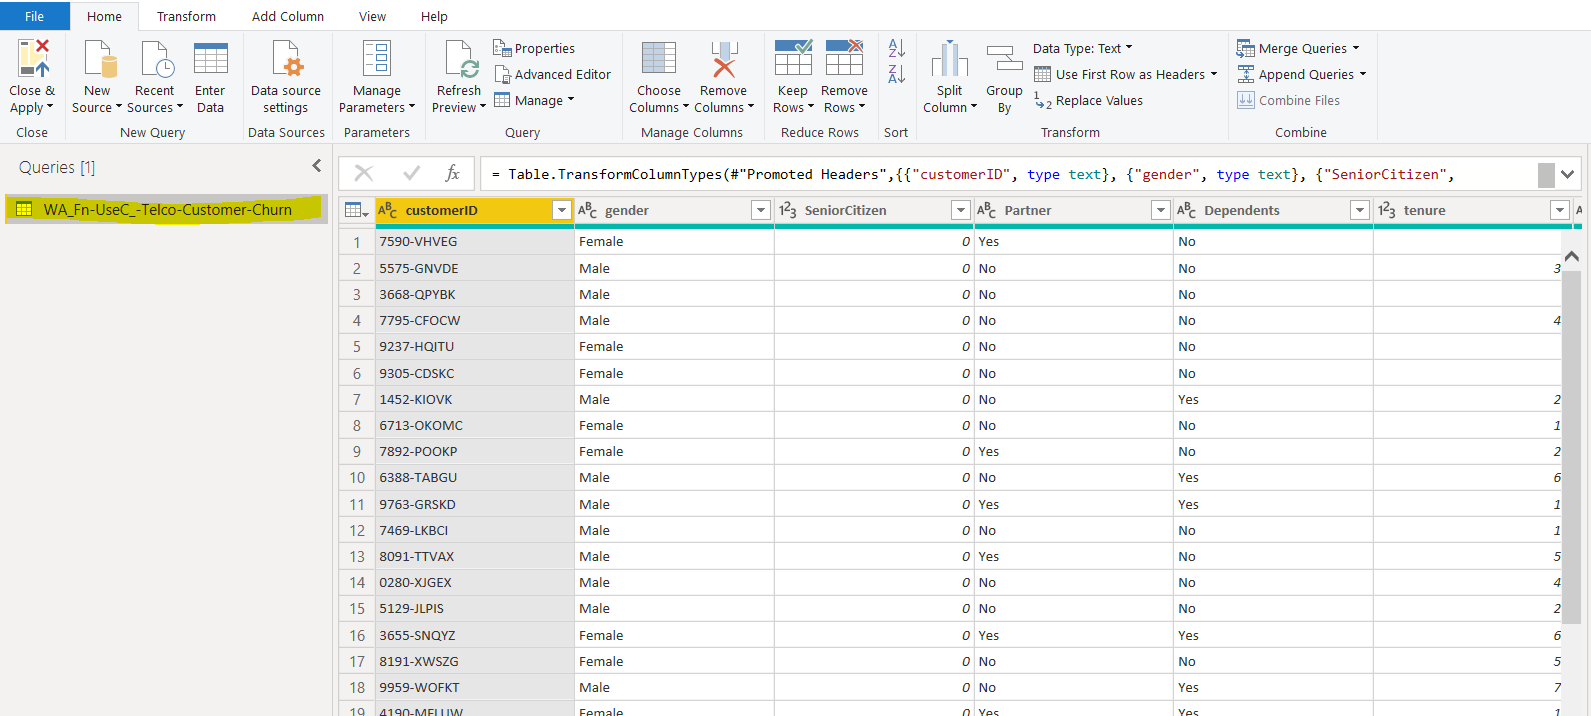
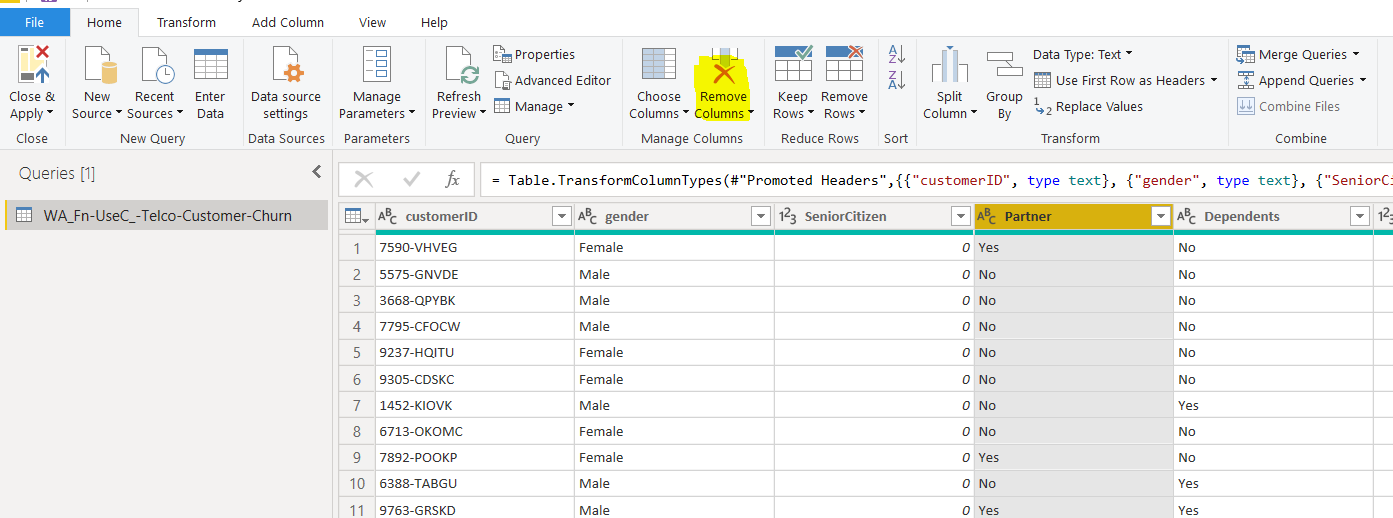
In the Query editor, the only table name on the left panel of the screen will be your table, as shown below. Click on the “WA_Fn-UseC_-Telco-Customer-Churn” data table from the left panel of the query editor as shown below:
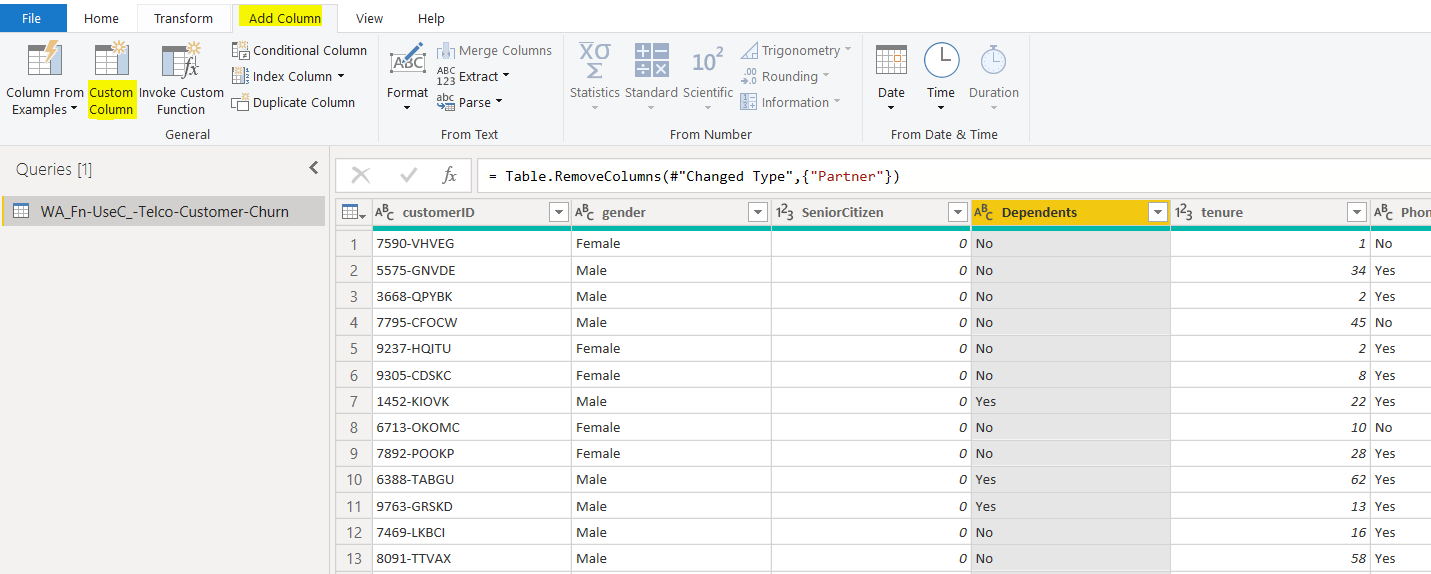
To see the queries in M. Select any column, for example, “Partner” and then click the “Remove Columns” button from the top menu. It will remove the “Partner” column from the table as shown below:
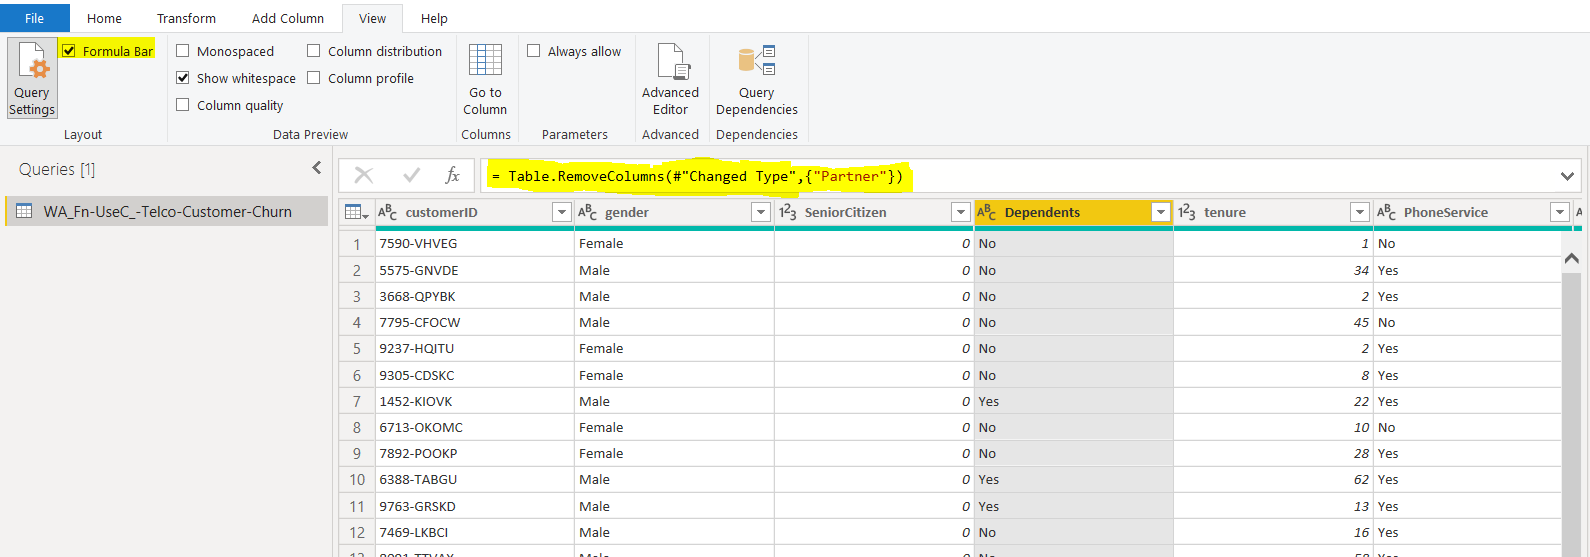
Next, click on the “View” option from the top menu as highlighted in the following screenshot.
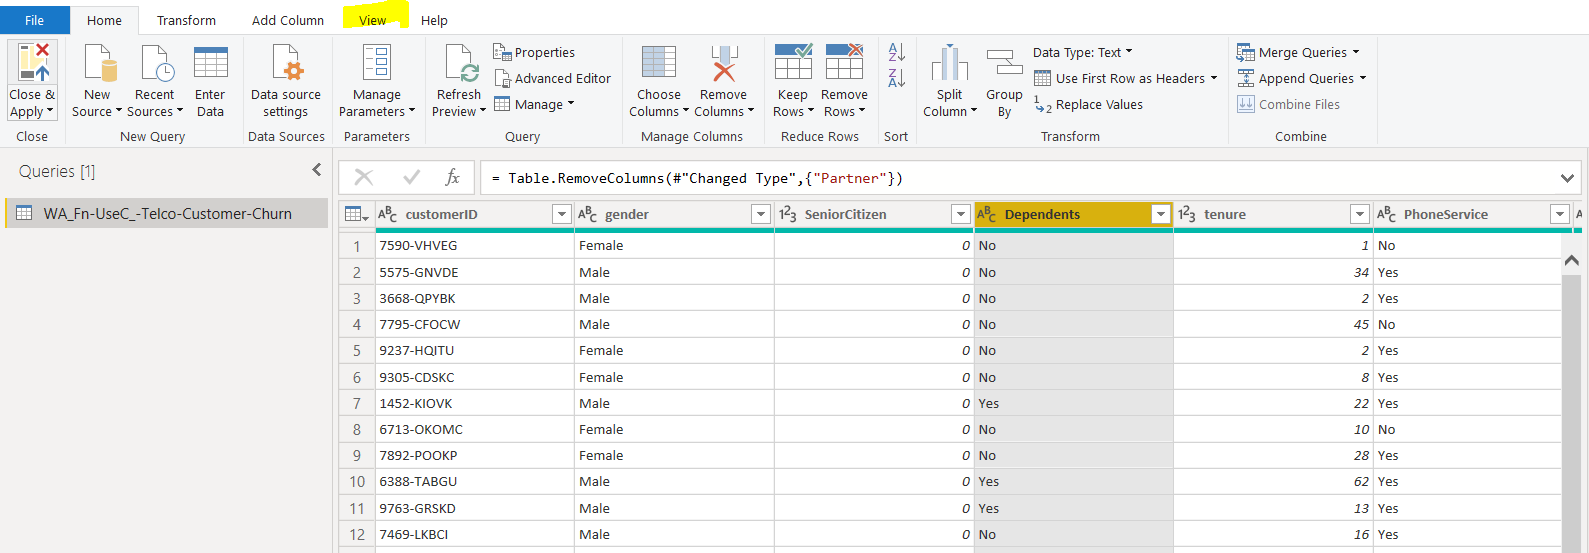
Click the “Formula Bar” checkbox. You should now see a query in the formula bar as highlighted in the following screenshot. The query here is “= Table.RemoveColumns(#”Changed Type”,{“Partner”}). This query is an M language query used to remove the “Partner” column from the selected table. You can see that the M Language query is more similar to an SQL or LINQ (Language Integrated Query) command in C#.
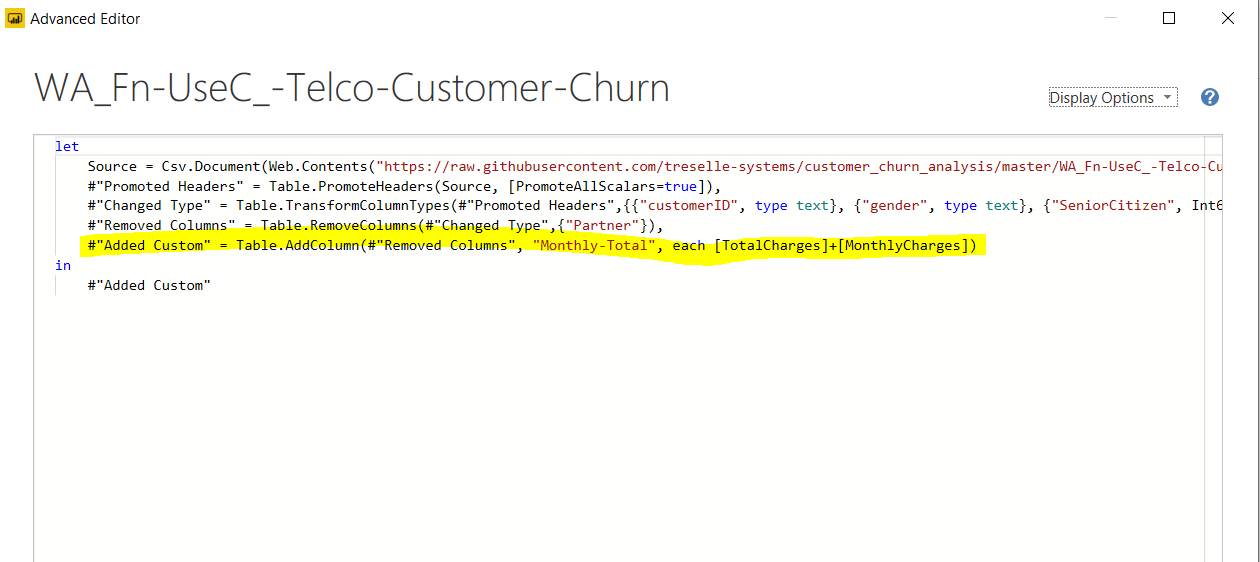
To see all the previously executed M queries in your dataset, you can click on “View – Advanced Editor” as shown in the following screenshot.
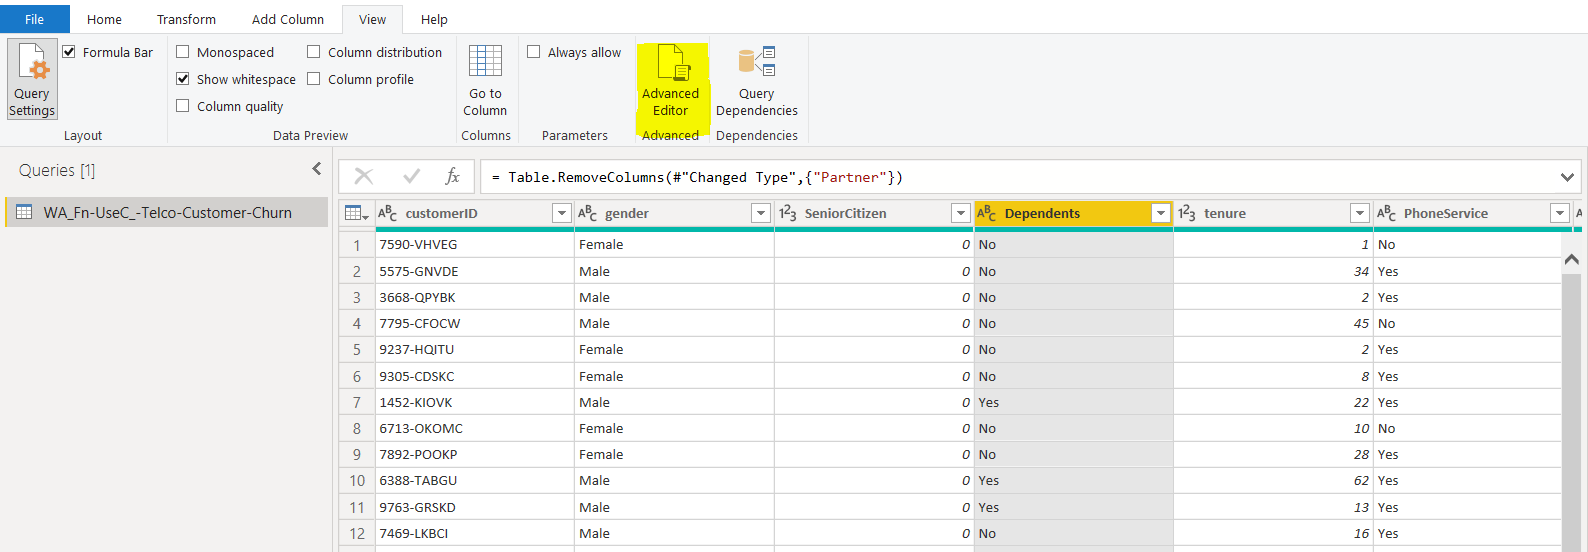
Once you click on the “Advanced Editor” option from the top menu, you should see the Advanced Editor window as shown below. The Advanced Editor window contains all the M language queries that you have executed till now in the current session.
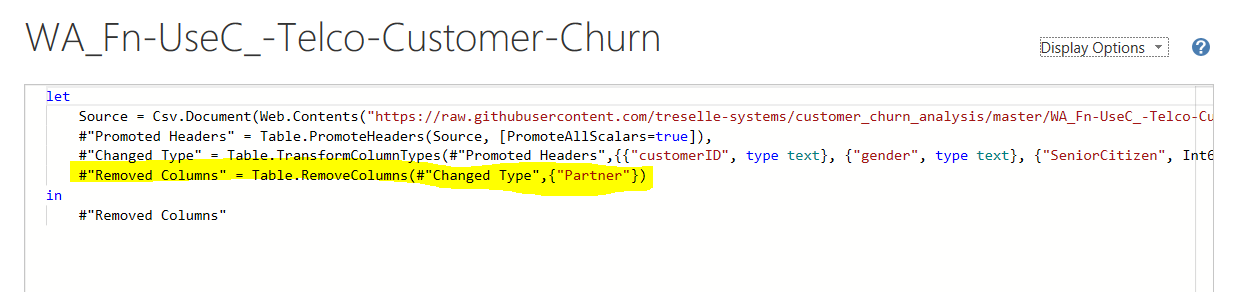
You can see that the last query is the one that removed the “Partner” column from the table. Before that, the “Change Type” query is used to assign the data types to different columns in the dataset. And previous to that, the “Promoted Headers” query is used to set the header columns. If you execute another query, that will appear at the bottom in the query list in the “Advance Editor”.
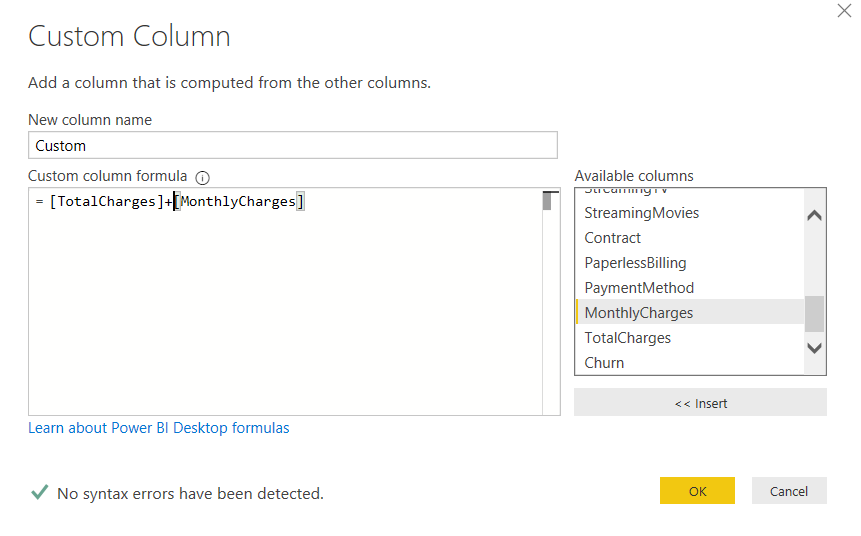
Let us try to add a simple column in the books table and see the M query for that. Click on the “Add Column -> Custom Column” option in the menu at the top of the window, as you can see below:
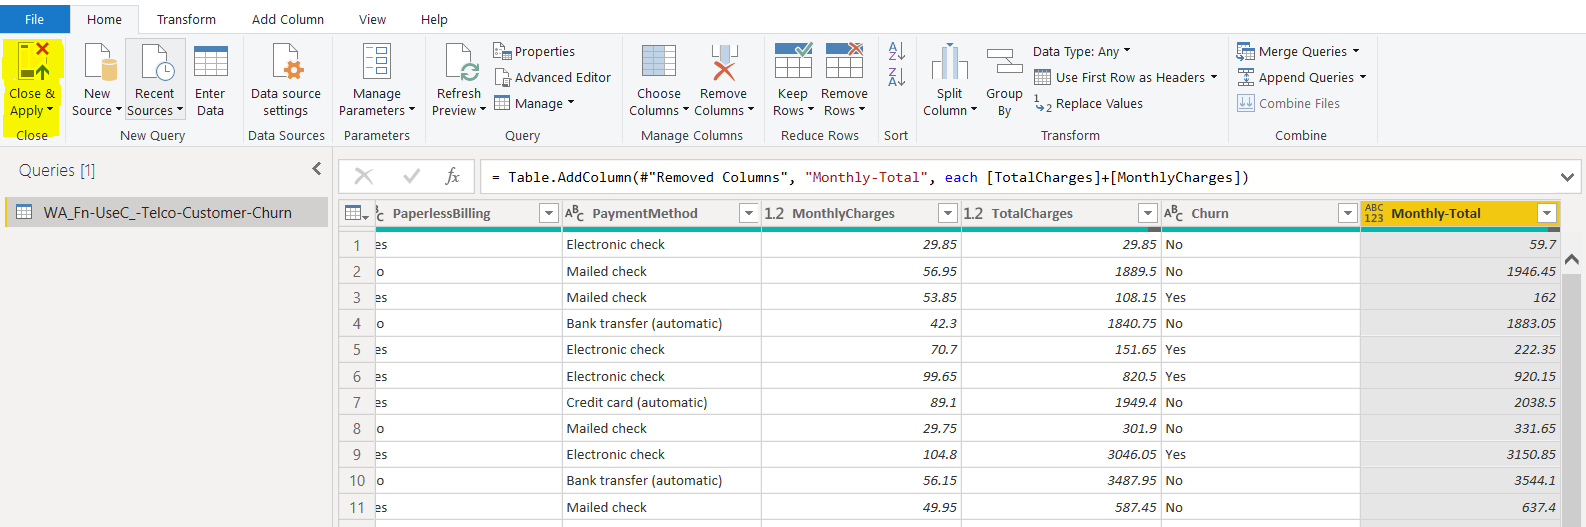
You should see the window below. Click on the “TotalCharges” and “MonthlyCharges” columns one by one and then click the “Insert” button to insert them on the query editor window. In the query editor window, add a “+” sign between the two-column names and click the “OK” button.
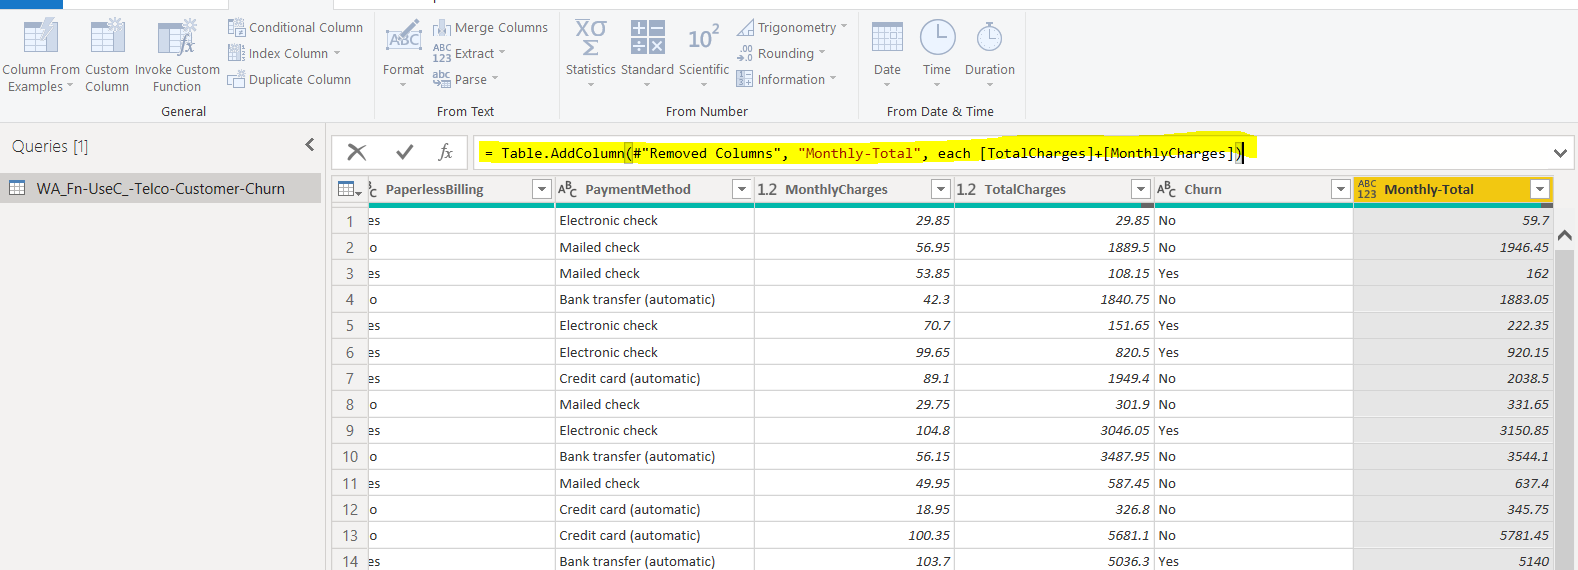
You should see a new column “Monthly-Total” added to the table as shown below. In the formula bar, you can also see the M query generated to create the “Monthly-Total” column. The “Monthly-Total” column basically displays the sum of values in the “TotalCharges” and “MonthlyCharges” columns.
Now if you again open the “Advanced Editor” window, you will see the query used to add the “Monthly-Total” column at the bottom of the queries in the advanced editor.
Now we know how the M Language works and how it looks like. In the next section, we will try to create the same “Monthly-Total 2” column via DAX (Data Analysis Expression).
DAX queries are executed in the Data View; therefore, we have to move the data from the Query Editor to the data view. To do so, in the Query Editor, click on the “Close & Apply” option from the top menu as shown below:
Once you click the “Close & Apply” button, the Data View will be opened.
DAX (Data Analysis Expression)
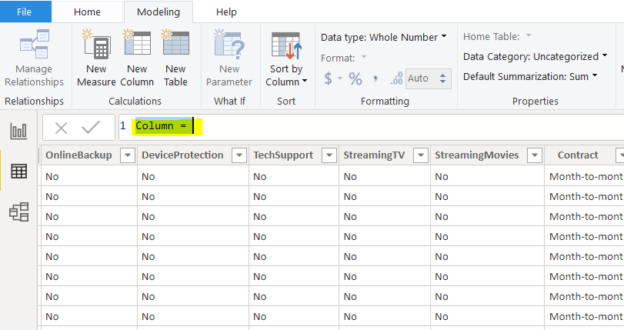
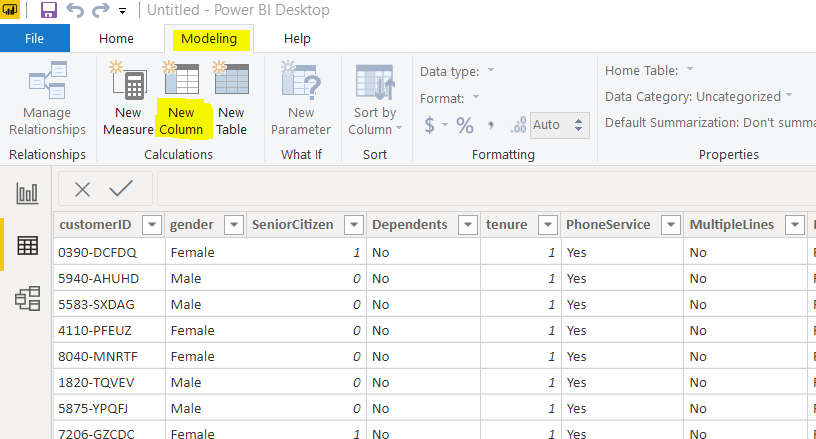
In this section, we will see how to add a new column to the Books table using DAX. In the Data View, click on “Modeling -> New Column” option from the top menu as shown below:
You should see the following window once you click the “New Column” option. In the formula bar, you can see the default column name. You can execute the DAX queries in this formula bar.
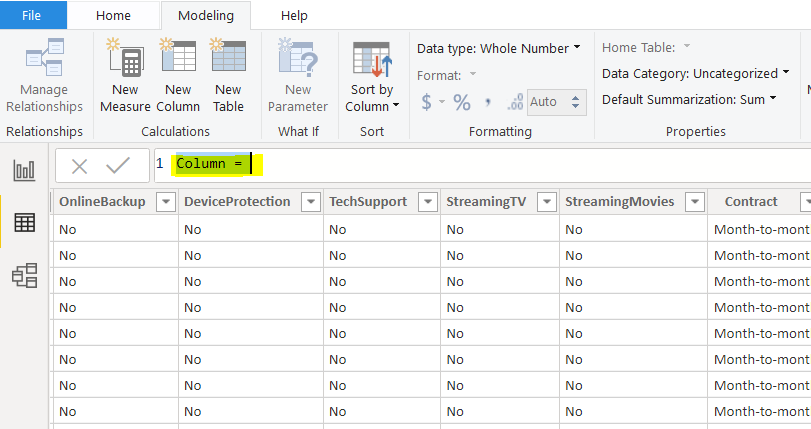
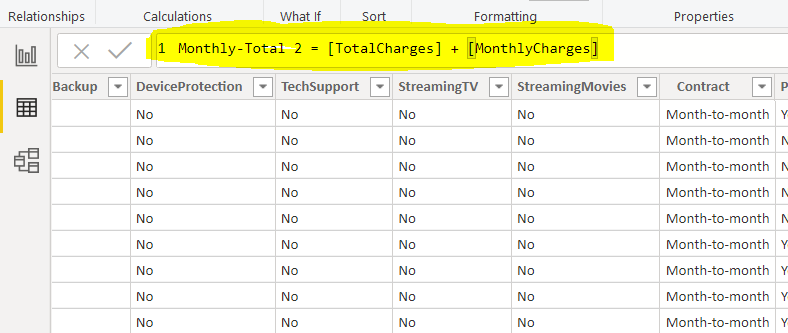
Enter the query “Monthly-Total 2 = [TotalCharges] + [MonthlyCharges]” in the formula bar and hit the “Enter” key. Once you hit enter, you will see a new column “Monthly-Total 2” which displays the sum of values in the “TotalCharges” and “MonthlyCharges” columns.
You can see that the DAX queries are more similar to MS Excel.
Conclusion
M Language and DAX are the two languages supported by Power BI to manipulate, filter and analyse the data. Though both languages have similar functionalities, they operate independently of each other. M is used to pre-process the data inside the Query Editor whereas DAX is used to analyse the data after the data is loaded into the Data View Model.

View all posts by Ben Richardson
- Working with the SQL MIN function in SQL Server - May 12, 2022
- SQL percentage calculation examples in SQL Server - January 19, 2022
- Working with Power BI report themes - February 25, 2021