
In this article, I’m going to talk in detail about the moving average in SQL and how to find out the same in Power BI and Excel. This might be a new topic for many newbies who have started out in this field, but I’m sure this will help anyone who is trying to work on smoothing averages in SQL or in Power BI.
Moving Average in SQL or Power BI, as it goes by the name, is a type of average function that is moving; in other words, it is calculated over a period. This is an important scenario while dealing in finance where often analysts tend to work on smoothing the stock prices, for example, over a period and find out the trend of the prices. This trend then aids in defining whether the average is an upward or downward moving trend. This article will focus on how to calculate the moving average in SQL and then we will look at an example to implement the same in Power BI and Excel as well. It is also known by Rolling Average or Running Average.
For the sake of this article, we will try to analyze the share price of Facebook, the data of which is easily available to download from yahoo finance website. I have downloaded the data for the last 5 years and saved it in a CSV file.
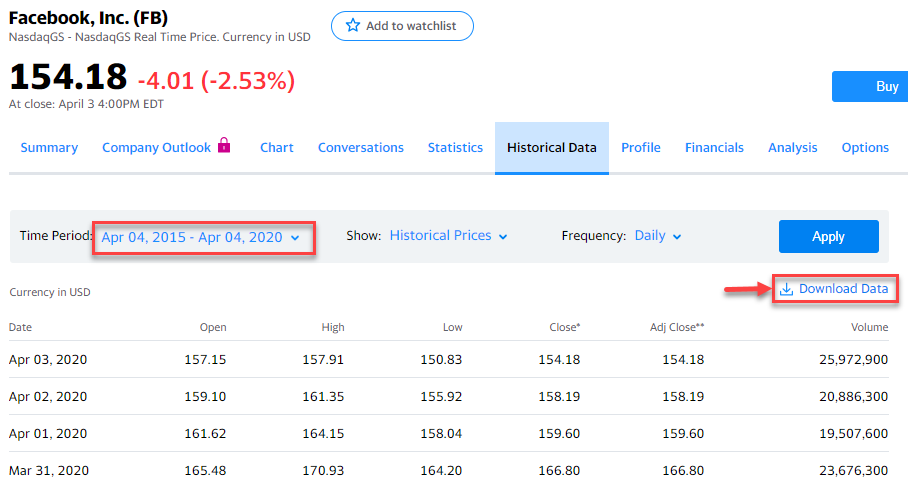
Figure 1 – Facebook Stock Data (Yahoo Finance)
Moving Average in SQL
To begin with, let us first import the CSV file into SQL Server so that we can execute our queries accordingly.
Right-click on the Database on which you wish to import the data and select Tasks and then select Import Flat File. Proceed through the dialog boxes and get it imported into the database.
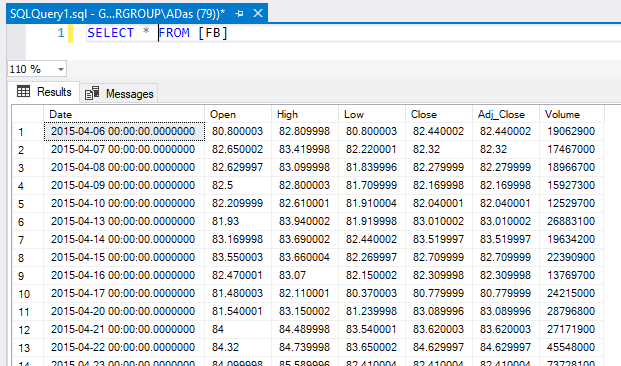
Figure 2 – Import Flat File into SQL Server
Once the data is imported into a table in SQL, we can go ahead and execute our queries. In this article, I’m going to use the WINDOW function in SQL – the OVER clause to calculate the average of every row with consideration of the values from the records before and after that specific row.
Now that our data is ready, let us try to calculate a moving average in SQL of 5 days on the closing prices. This means each row will consider 2 rows both before and after the current record, calculate the sum of the price and then divide it by 5. For the first row, since there are no rows before that, the logic remains the same, but only the 2 later records are calculated. Similar is the case for the last record where only the 2 previous records will be calculated since there are no records after that.
|
1 2 3 4 5 6 7 8 |
SELECT [Date] ,[Close] ,AVG([Close]) OVER ( ORDER BY [Date] ROWS BETWEEN 2 PRECEDING AND 2 FOLLOWING ) MovingAverageFiveDay FROM [FB] |
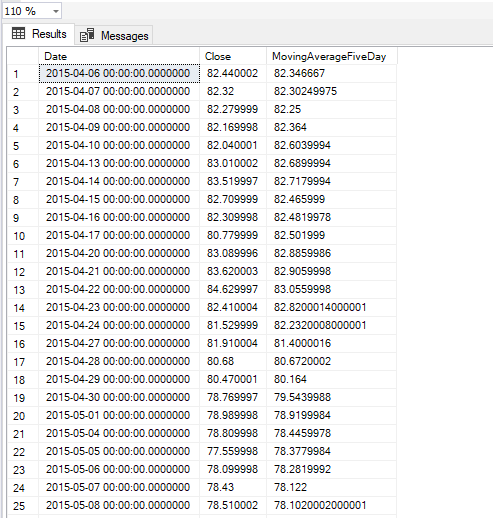
Figure 3 – Five Day MA
This is not all. This technique can be applied to calculate the moving average in SQL for different periods based on the requirement. If we want to calculate the moving average of 15 days, such that it can include 7 previous and 7 next days, we can just rewrite the query as follows.
|
1 2 3 4 5 6 7 8 |
SELECT [Date] ,[Close] ,AVG([Close]) OVER ( ORDER BY [Date] ROWS BETWEEN 7 PRECEDING AND 7 FOLLOWING ) MovingAverageFifteenDay FROM [FB] |
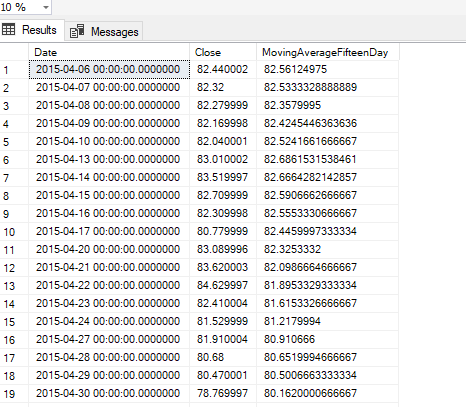
Figure 4 – Fifteen Day MA
As you can see in the figure above, the average is now based upon 7 previous and 7 next records, including the current one.
Moving Average in Power BI
Power BI as we all know is one of the most fantastic tools in the visualization world. One of the main advantages of using Power BI is that it helps us with some pre-defined calculations, which we can create just with a few clicks without writing a single line of DAX. Of course, you can write your own DAX in case you want to customize; however, the New Quick Measure really does the tough job.
Let us first fetch the data into the Power BI data model. Select Get Data and then from SQL Server. Provide the necessary details and get the data imported into the data model. Click Load once completed and the data will be imported.
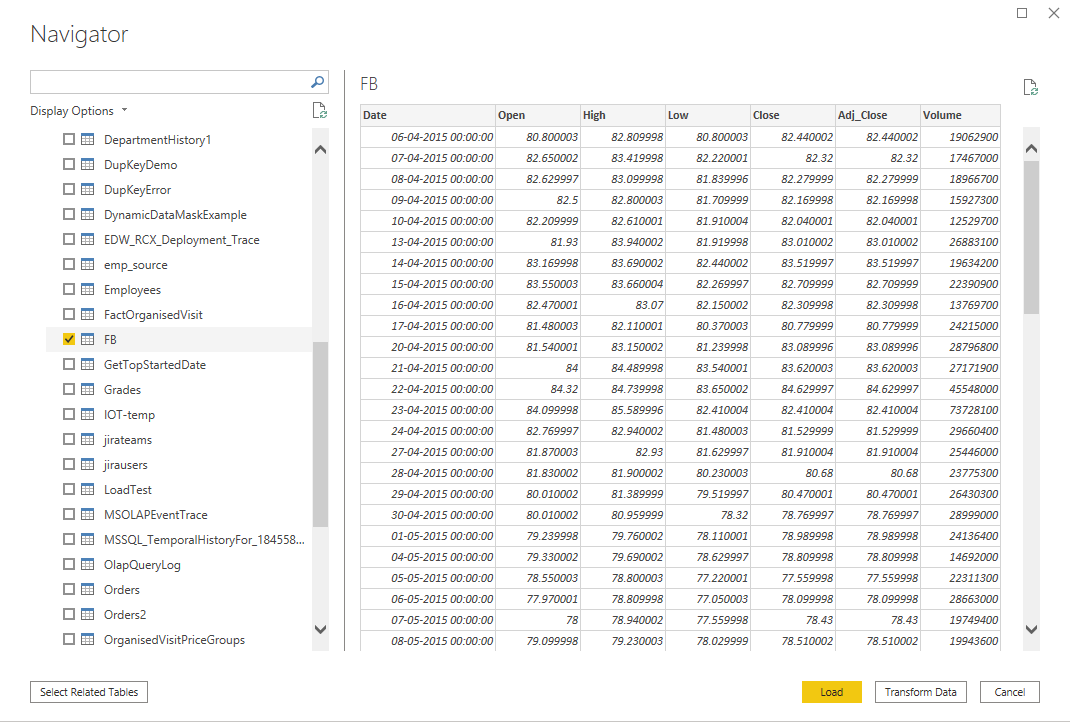
Figure 5 – Importing Data into Power BI
Once the data is imported, click on the “Line and Clustered Column Chart” and drag and drop the Date to the Axis and the Close to the Column Values pane. Also, an important thing to note here is that since the dataset has five years of data, we will only visualize it by months and remove the Day from the hierarchy.
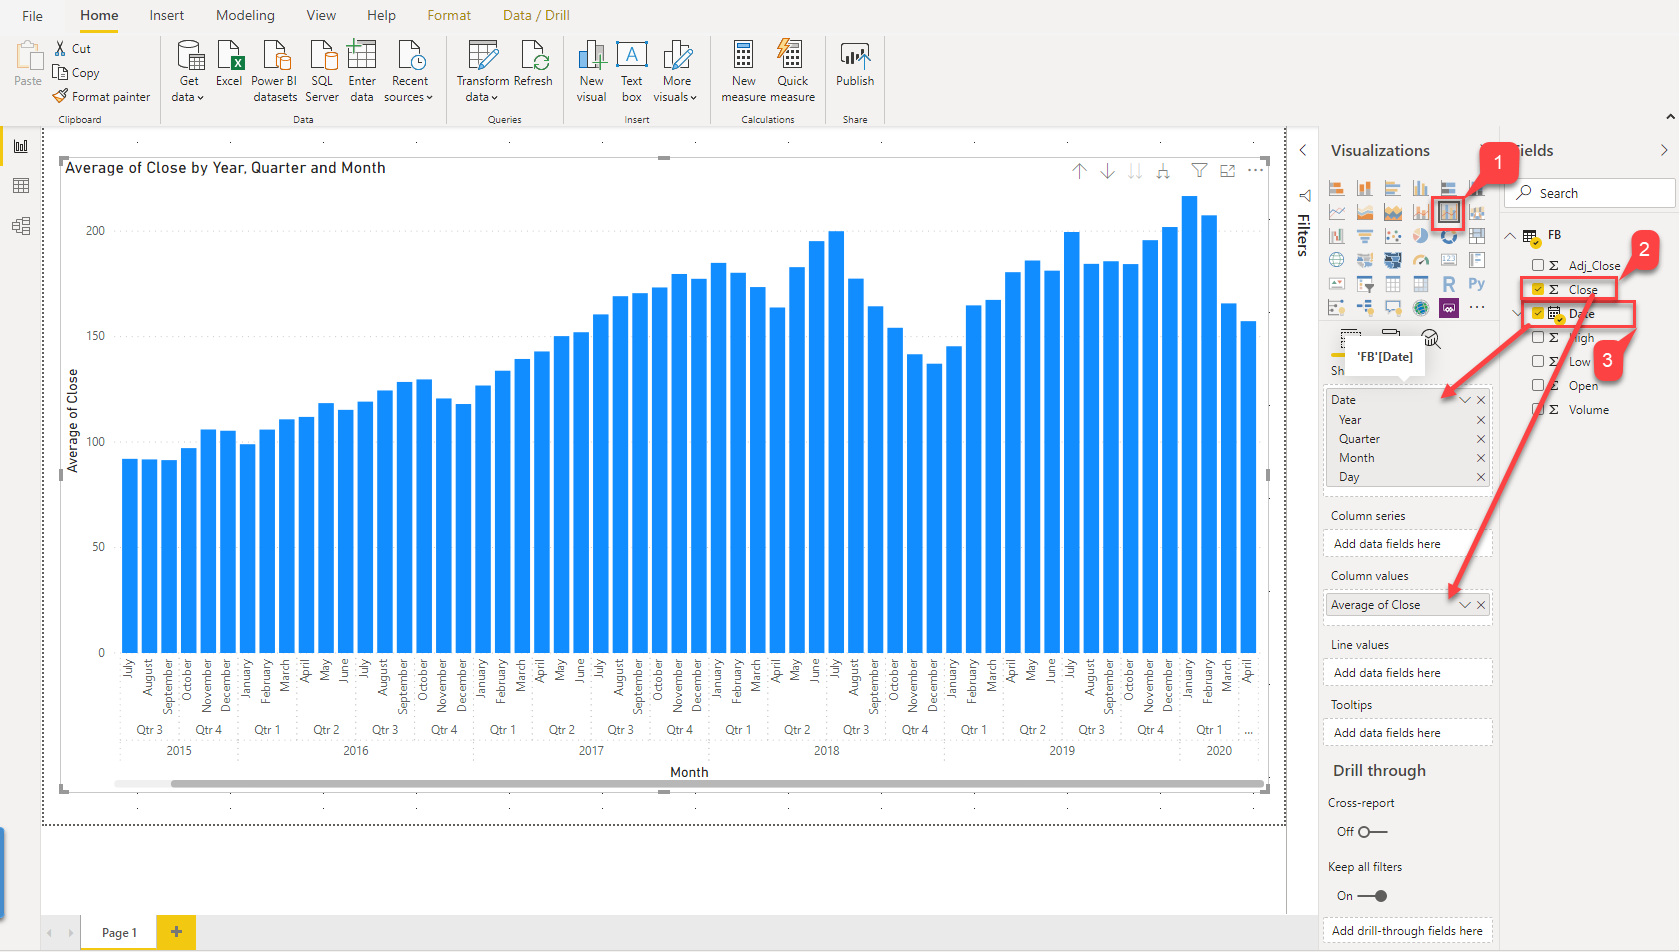
Figure 6 – Building the chart
Once the visualization is ready, the next step is to create the new calculated measure that will store the moving average. Right-click the Date hierarchy and select New Quick Measure from the context menu.
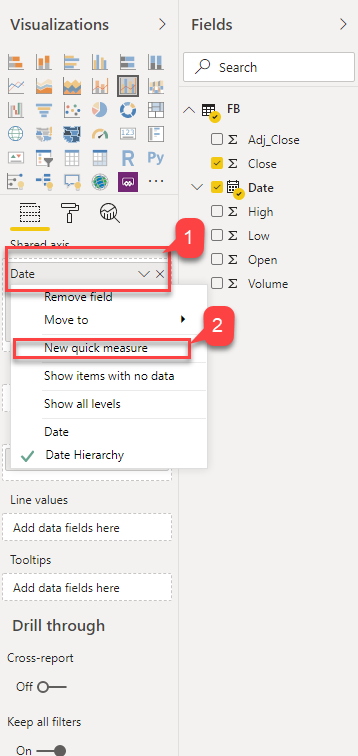
Figure 7 – New Quick Measure
In the new dialog box that appears, select the Calculation as Rolling Average and the Base Value as Average of Close (since we want to calculate the MA based on the closing price). Select the period for which the rolling average is to be calculated. In this example, I’m going to calculate it based on 7 months before and after the actual month, basically a fifteen-month moving average. Click OK once done.
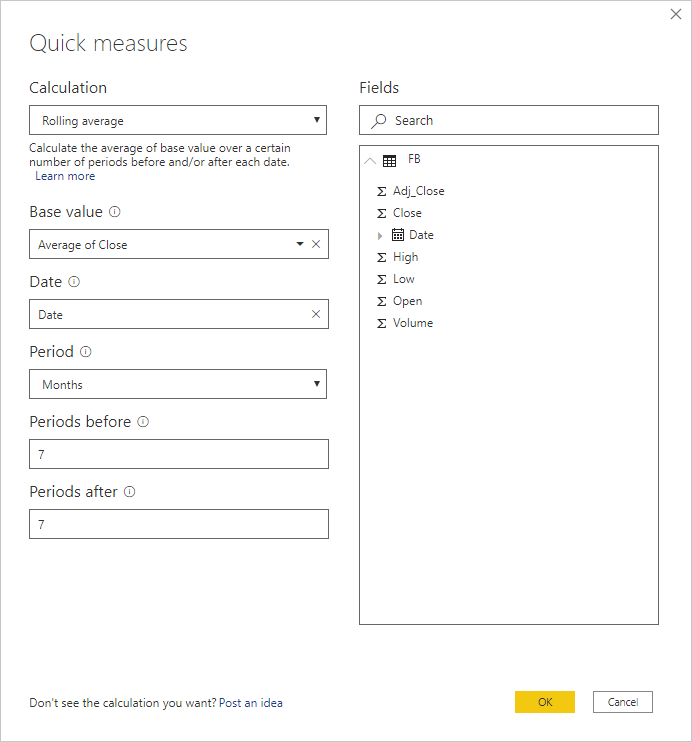
Figure 8 – Configuring Rolling Average
Once you finish defining the configuration, a new measure will be created by the name “Average of Close Rolling Average”. You can also see the underlying DAX formula that the Power BI engine automatically generates for us.
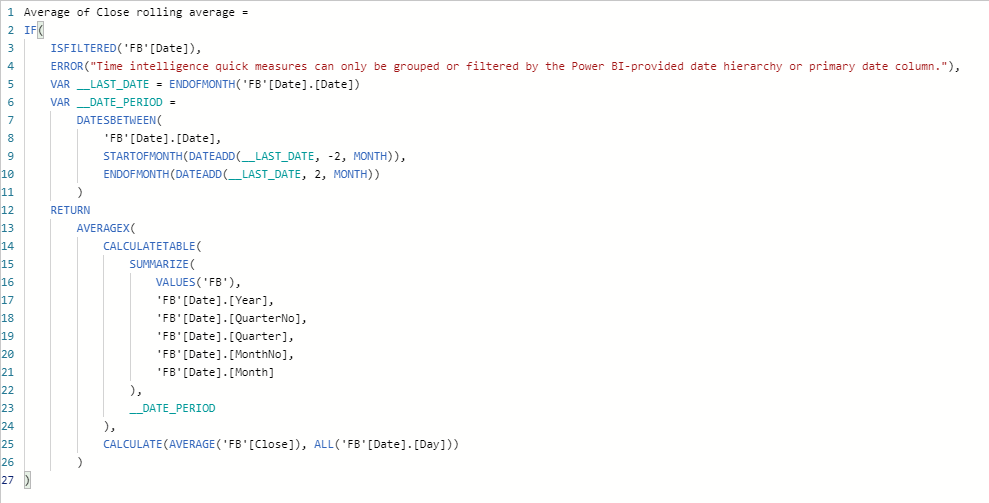
Figure 9 – Rolling Average Formula in DAX
Once the new measure is created, just drag and drop it into the Line Values pane. You can see a new line will be displayed on the chart which will give us the running average of the fifteen months.
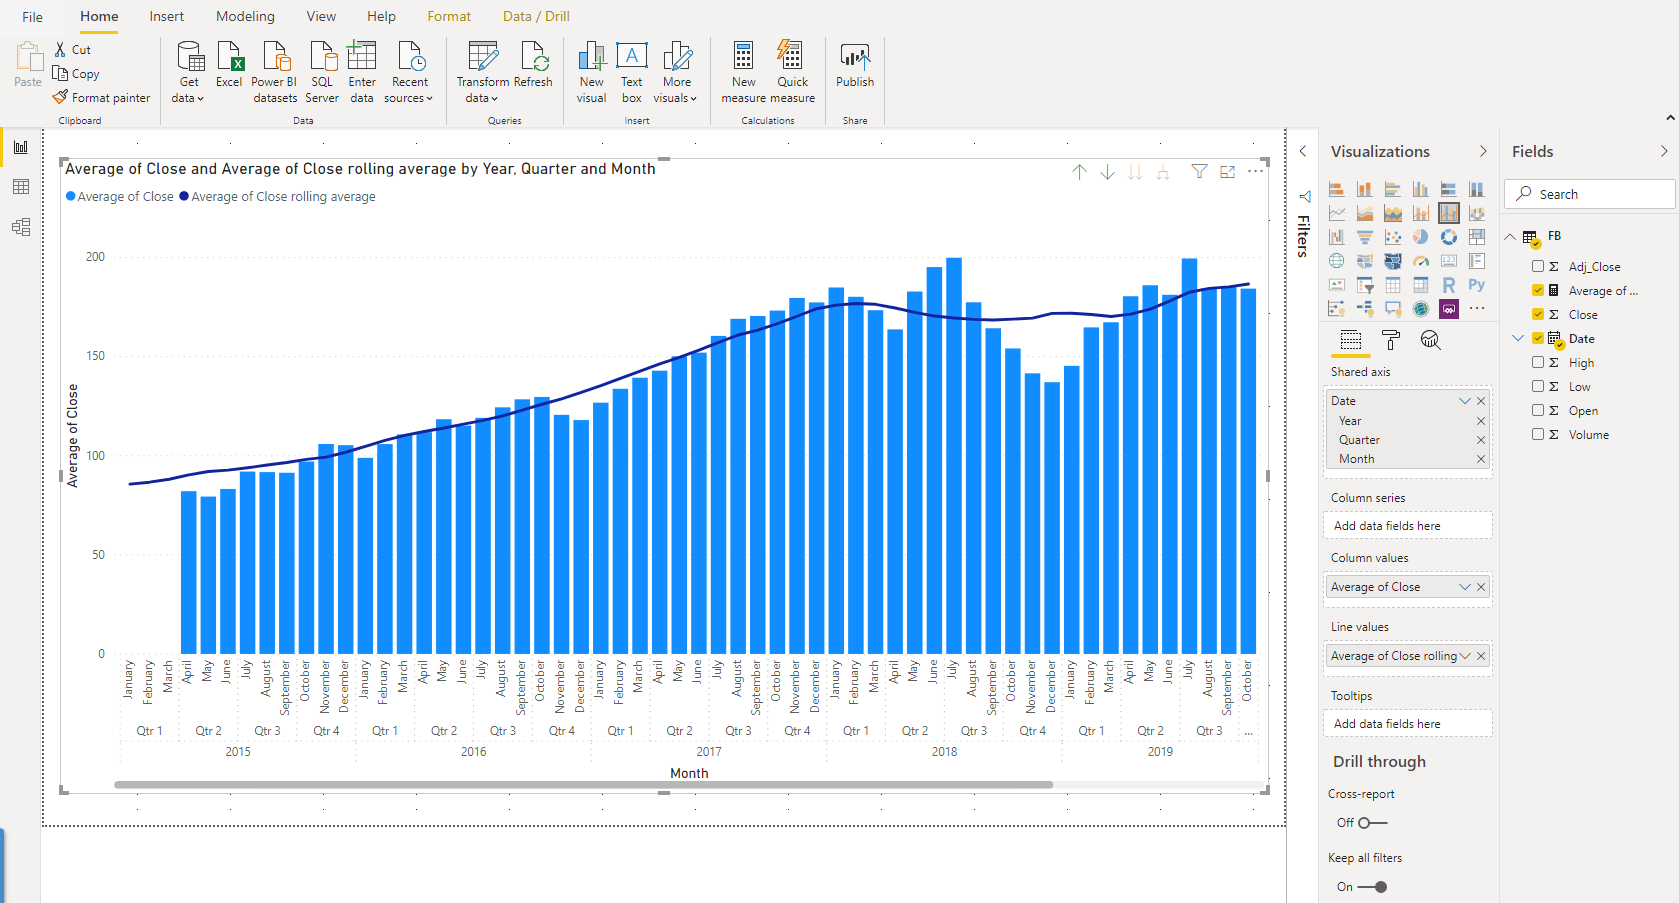
Figure 10 – Fifteen Months Rolling Average
Moving Average in Excel
Excel has always been a go-to tool for many people for a long time now, and hence, it is also extremely important to be able to perform such kind of calculations with ease. Excel provides an add-in for Data Analysis purposes, which needs to be imported into Excel before performing the analysis.
Open the CSV file that you have downloaded earlier from the yahoo portal and save it as an excel file. Click on Home on the ribbon bar and then select Options.
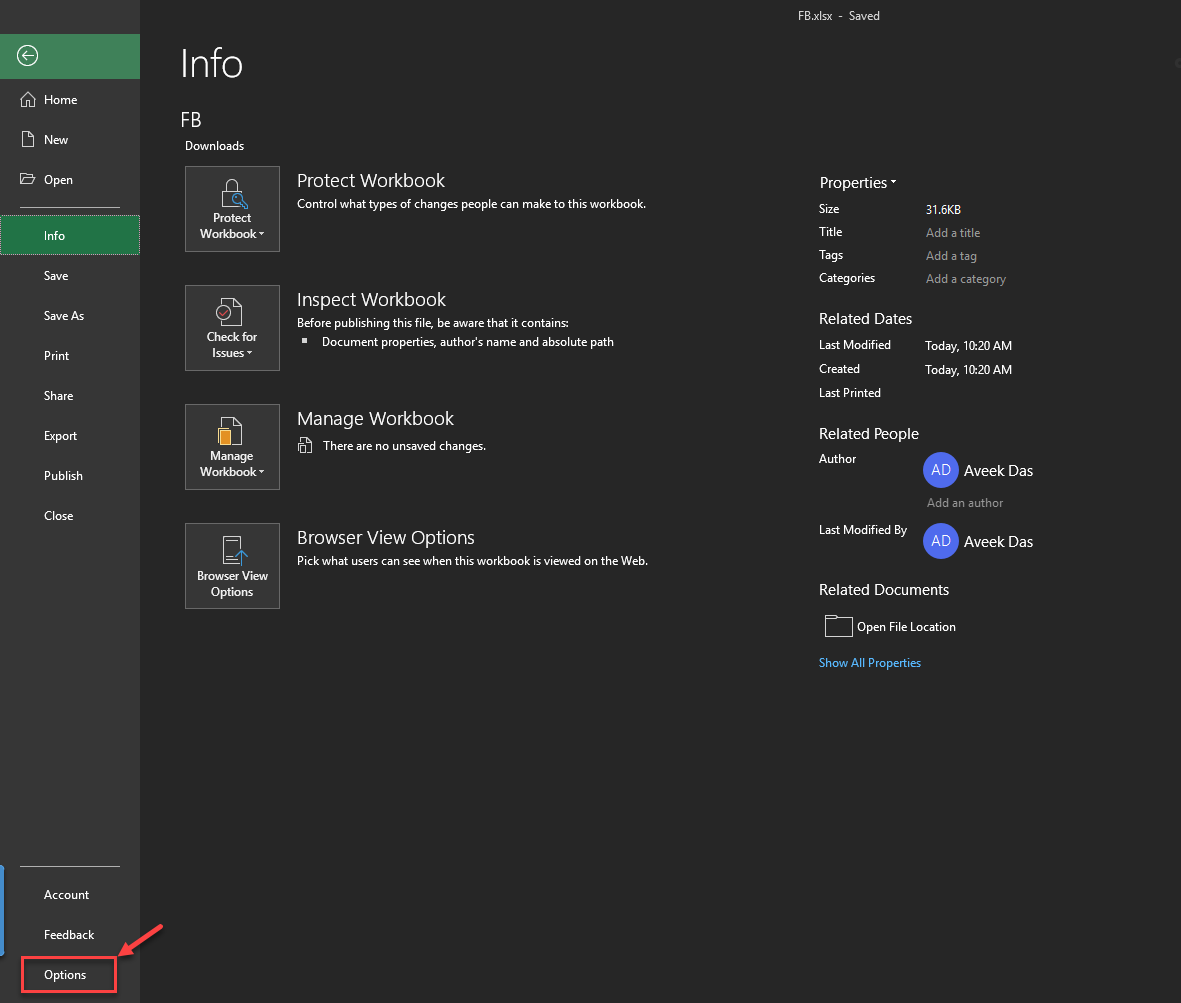
Figure 11 – Select Options in Excel
In the Excel Options dialog box that opens, select Excel Add-ins against Manage and click on Go.
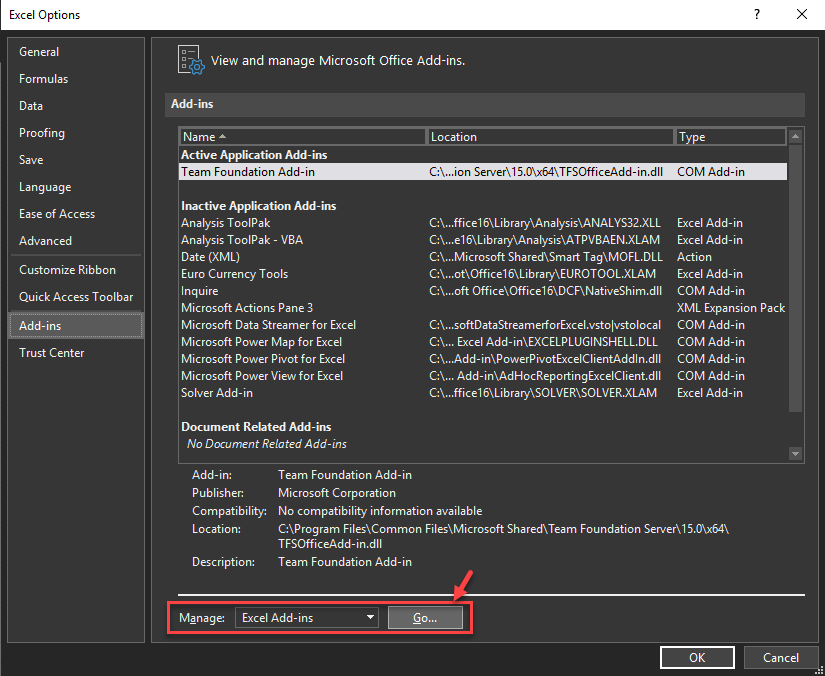
Figure 12 – Excel Plugins
In the Add-ins dialog box, select the Analysis ToolPak and click OK.
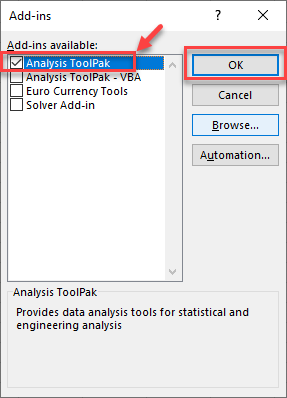
Figure 13 – Analysis ToolPak
From the Data tab, click on the Data Analysis button under the Analysis pane in the ribbon.
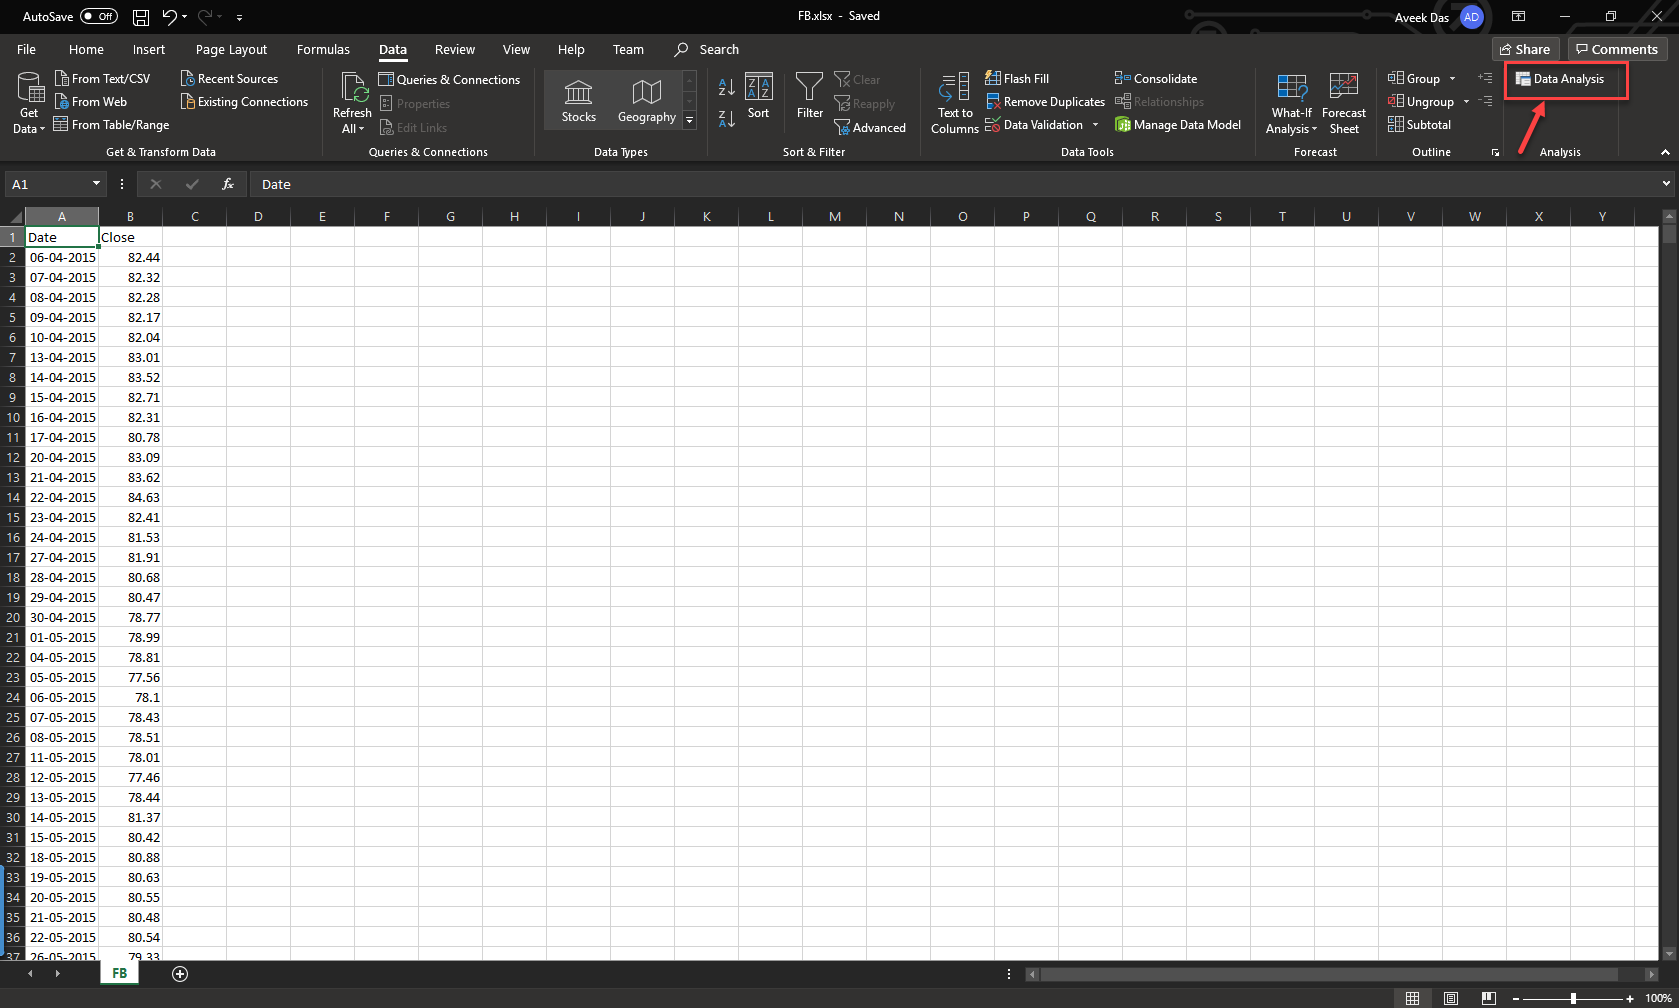
Figure 14 – Data Analysis Tab
Select Moving Average and click OK.
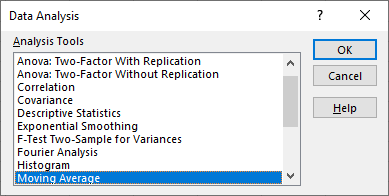
Figure 15 – Data Analysis Options
In the next dialog box that appears, select the Input Range from the column values in the Excel sheet. Define how many intervals should the rolling average has to be calculated. For this example, I want to smooth the average for 60 intervals. Click OK once done. This will add a new column, which is defined by the Output Range cells. Let the name for this column be MovingAverage.
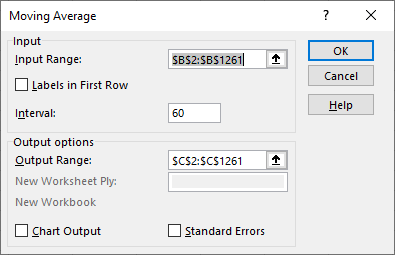
Figure 16 – Defining Options
Once the new field is added, select the entire dataset and click on the Insert tab. Select the Line Chart, as shown in the figure below and plot it on the sheet.
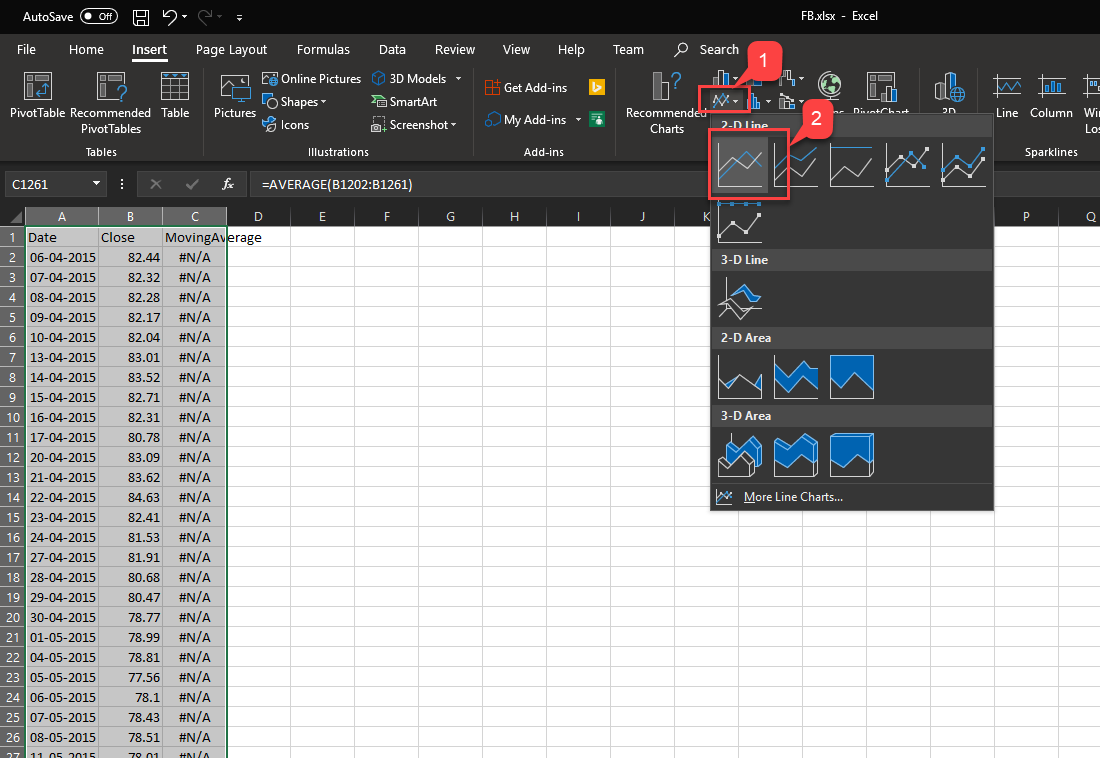
Figure 17 – Selecting the Line Chart
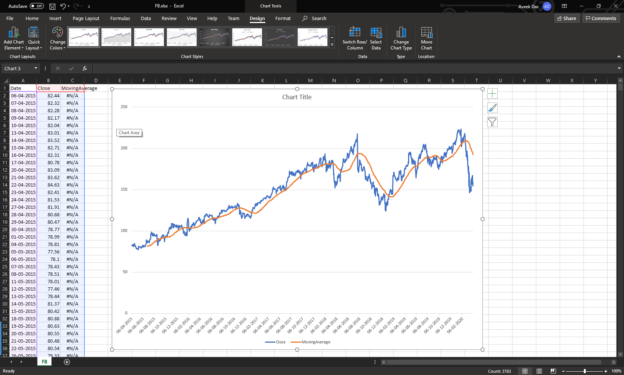
Two lines will be displayed in the chart, as shown in the figure below. The blue line represents the original value from the dataset, whereas the orange line represents the rolling average of the selected periods. In this way, we can easily smooth out the original curve and plot a rolling average calculation in Excel.
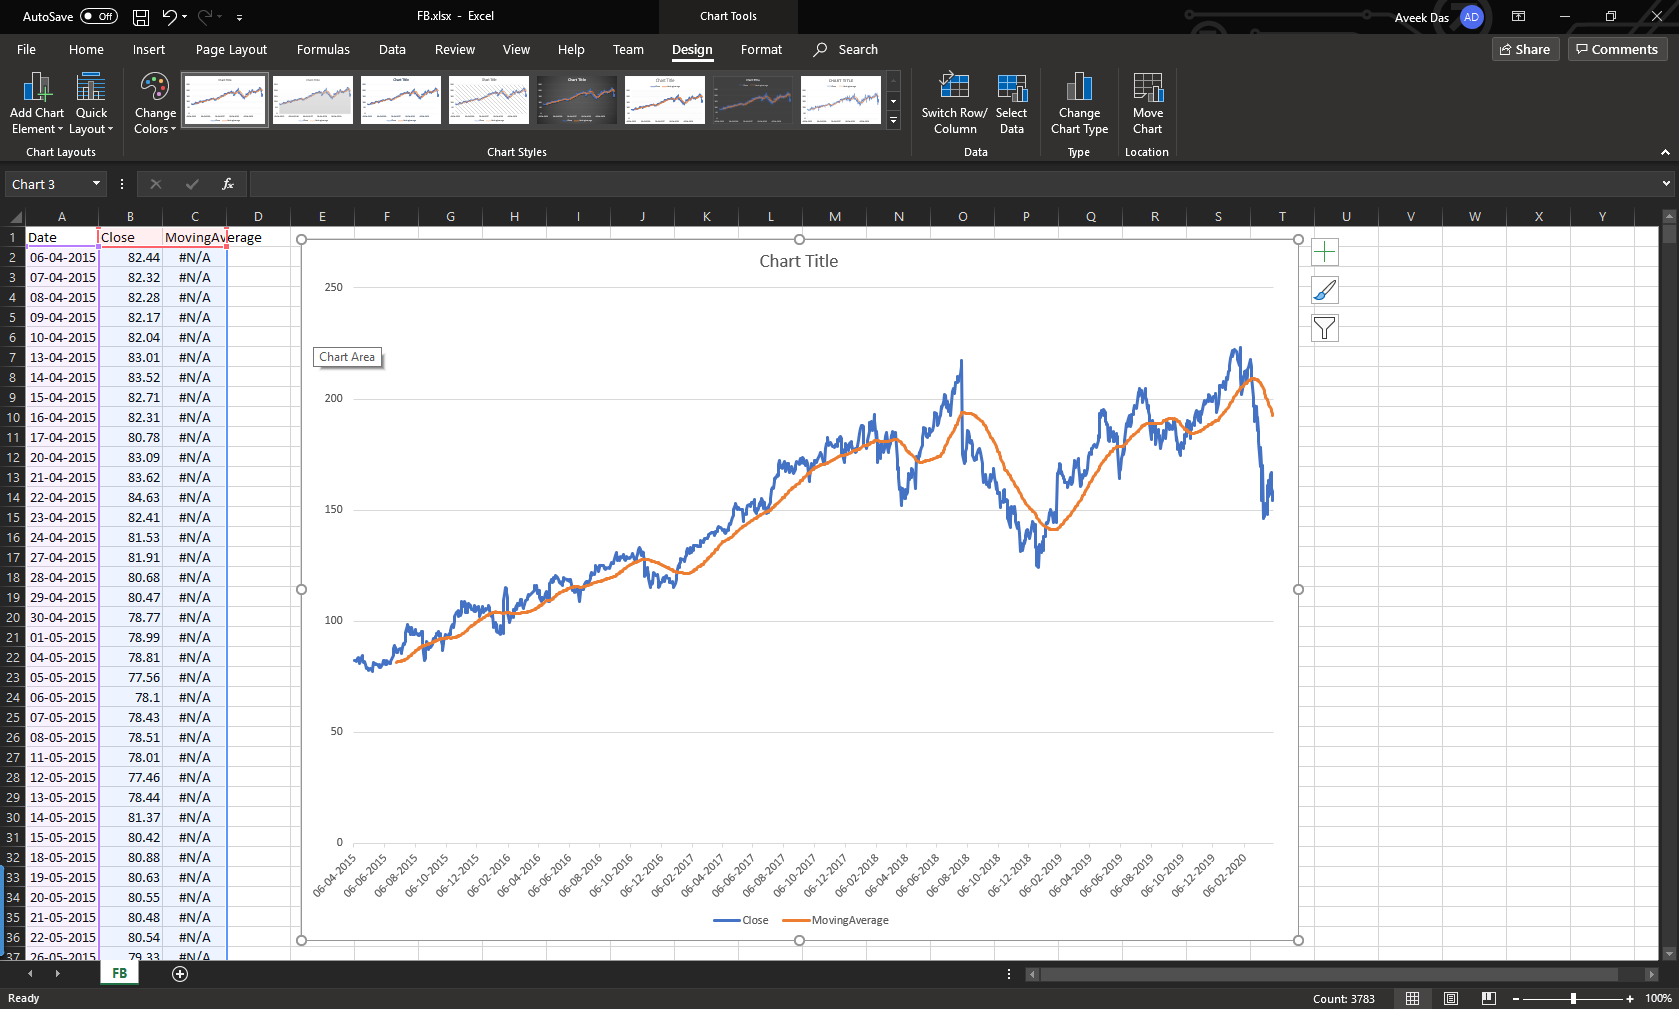
Figure 18 – Rolling Average in Excel
Conclusion
In this article, we have seen what a moving average in SQL is and how to calculate one. I have also explained how to implement the same with examples in Power BI and Excel.

He is a prolific author, with over 100 articles published on various technical blogs, including his own blog, and a frequent contributor to different technical forums.
In his leisure time, he enjoys amateur photography mostly street imagery and still life. Some glimpses of his work can be found on Instagram. You can also find him on LinkedIn
View all posts by Aveek Das
- Getting started with PostgreSQL on Docker - August 12, 2022
- Getting started with Spatial Data in PostgreSQL - January 13, 2022
- An overview of Power BI Incremental Refresh - December 6, 2021