
This article prepares a handy SQL Notebook for DBAs. You can use this notebook to troubleshoot performance issues and for getting SQL Server instance details.
Introduction
SQL Notebook is an exciting and useful feature introduced in Azure Data Studio. In the article, SQL Notebooks introduction and overview, we took an overview of the notebook feature along with the introduction to markdown language.
Prerequisites and important points
-
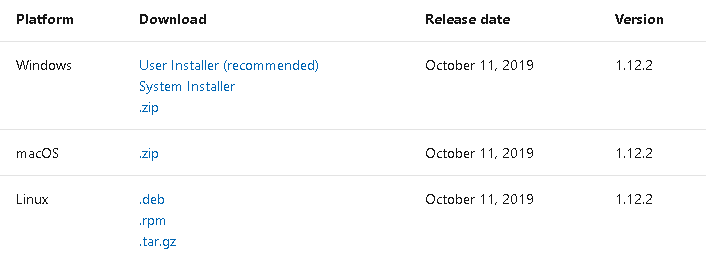
Download and install Azure Data Studio using the link on a suitable platform such as Windows, macOS, and Linux. Current release – v1.2.2:

- SQL Notebook is a technique for preparing human-readable scripts embedded document. You can also execute the t-SQL scripts, PowerShell, python codes inside the notebook
- Understand the basics of SQL Notebook, different methods of launching it using the link mentioned above
- This article combines the DBATools PowerShell command for preparing a troubleshooting guide in Azure Data Studio
- This article uses open-source PowerShell module DBATools for SQL Notebook. You can download and install DBATools using the link. You can also follow the SQLShack article DBATools PowerShell Module for SQL Server for more information regarding DBATools
-
If you have already installed it, upgrade it to the latest version using the following command in an administrative console of Azure Data Studio:
1Install-Module dbatools -force - This article uses the SQL Server Diagnostic Information Queries by Glenn Berry in the SQL Notebook. We will cover the useful queries in this article.
New-DbaDiagnosticAdsNotebook DBATools command
DBATools version 1.0 introduces a new command New-DbaDiagnosticAdsNotebook for preparing the notebook with the diagnostic queries.
It is always good to check the syntax, description, and examples of the DBATools command using the Get-help command:
|
1 |
Get-help New-DbaDiagnosticAdsNotebook |
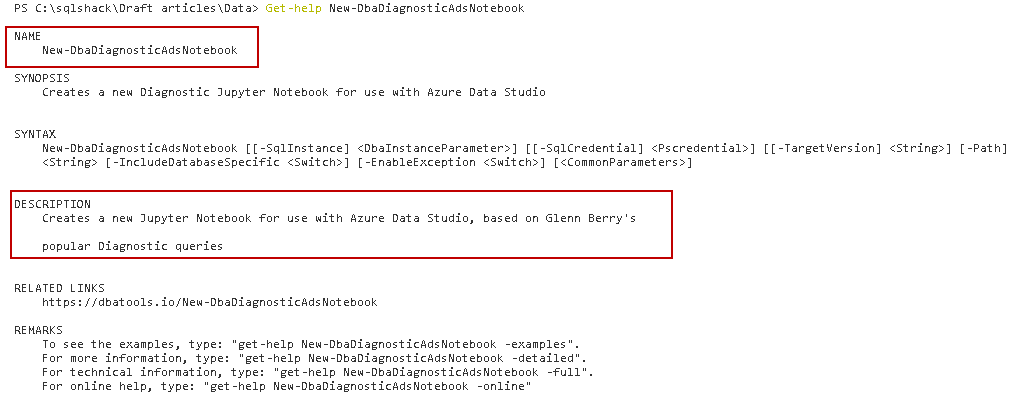
Syntax
|
1 |
New-DbaDiagnosticAdsNotebook - SqlInstance -SqlCredential -TargetVersion -IncludeDatabaseSpecific - EnableException |
- SqlInstance: In this argument, specify the SQL instance name (default or named)
- TargetVersion: By default, it installs the diagnostic queries for the SQL instance specified in the above argument. We can also specify a target SQL instance version. This version should be SQL Server 2005 and greater
- SqlCredential: By default, it uses Windows authentication for connecting to SQL Server instance. We can specify alternate credentials using this argument
- IncludeDatabaseSpecific: We can enable this argument for including database-specific queries in the notebook
- EnableException: If there is an error, the command uses a mechanism using the try-catch block and displays a friendly message. We can disable this behavior, but we should avoid any specifying this switch in the command
In the Azure Data Studio, execute the following query in an integrated PowerShell terminal for the SQL Server 2017 version. It automatically fetches all the diagnostic queries and imports them in the notebook with the corresponding heading on each section. We do not need to specify or import queries manually in this notebook:
|
1 |
New-DbaDiagnosticAdsNotebook -SqlInstance .\SQL2017 -Path C:\sqlshack\SQLNoteBook\DiagnosticSQLNotebook.ipynb |
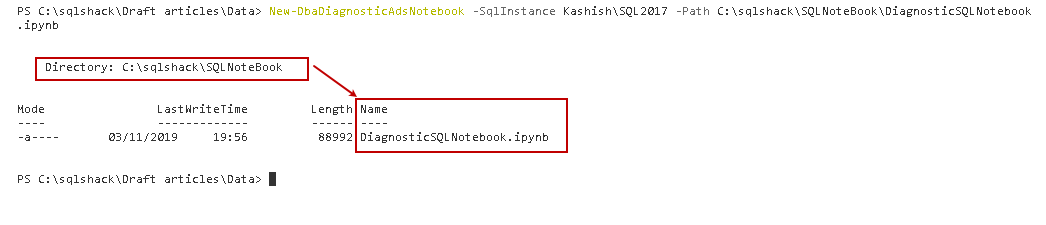
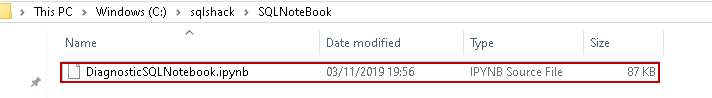
In the above screenshot, we can see it creates the SQL NoteBook in the specified directory. The extension of the notebook is ipynb.
You can browse the destination directory and verify the notebook file:
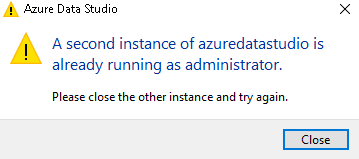
Double-click on this file to open it in the Azure Data Studio. If the tool is already opened, you get the following warning message. You can close the data studio to skip this warning message:
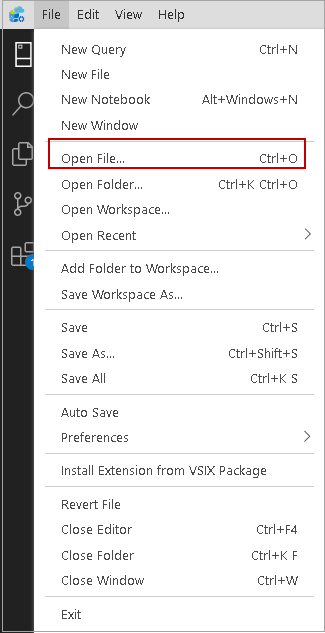
We can also open it from the File | Open file menu option:
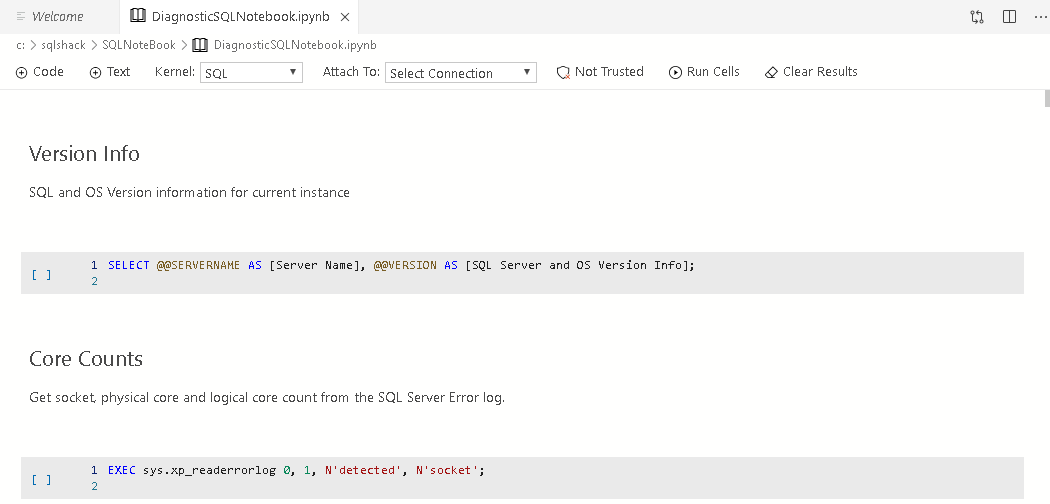
Specify the file path, and it opens the newly created notebook, as shown in the following image:
Explore SQL Notebook diagnostic queries
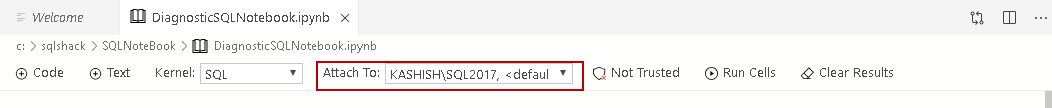
Firstly, let’s attach this notebook to a SQL Instance connection so that we do not need to specify a connection for executing each query:

In the Attach To section, click on New Connection. Specify the SQL instance, authentication mode (Windows, SQL):
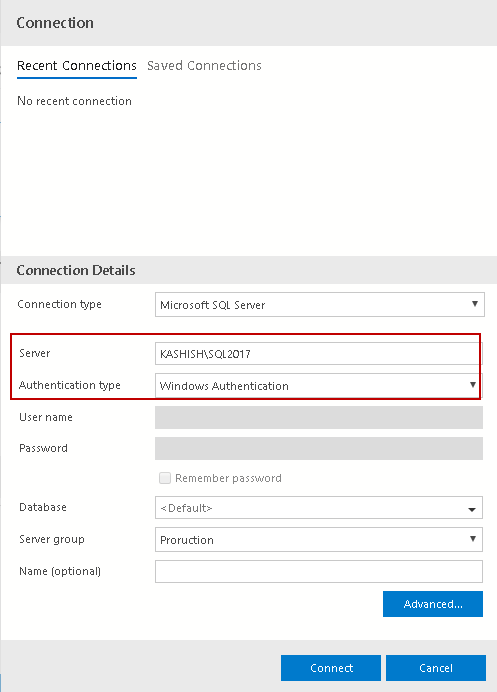
Click on Connect, and it shows the SQL connection as shown below:
Let’s explore queries specified in the diagnostic SQL Notebook.
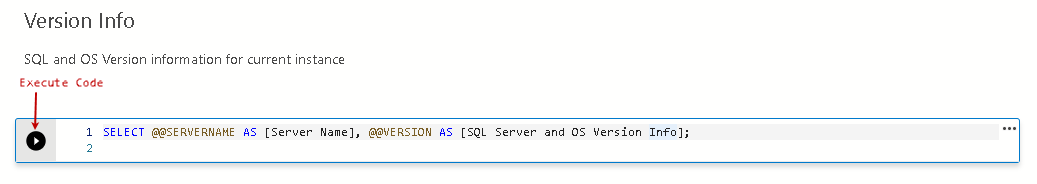
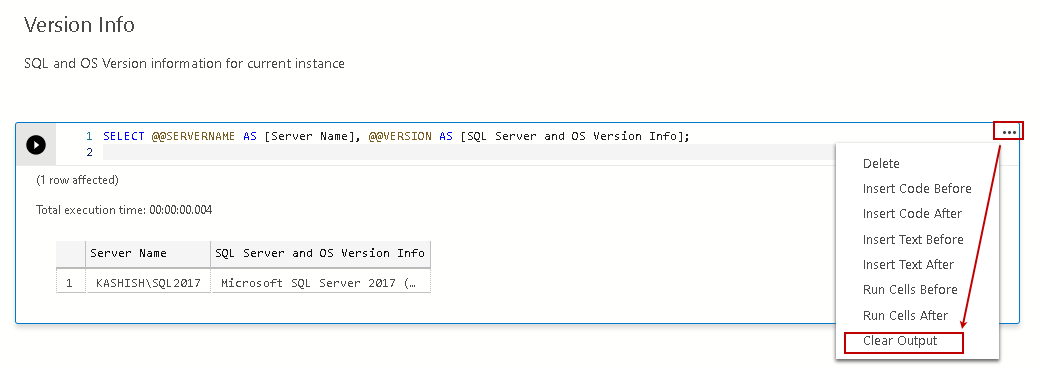
Version Info
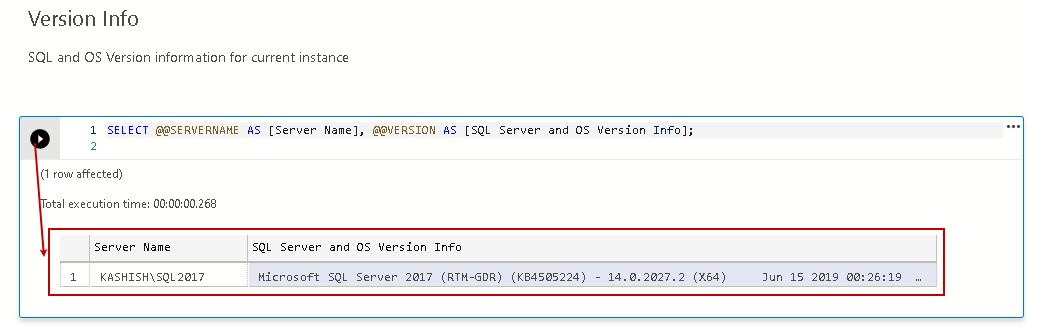
It returns the SQL instance and OS versions in this section. Click on the code, and you get a play icon for executing this query in the connection we specified earlier:
SQL Notebook displays the result in the notebook itself. We do not require copying the code in another client tool and execute it. We can view, copy and clear the results if required:
Click on eclipse, and it gives you the option to clear output, as shown below:
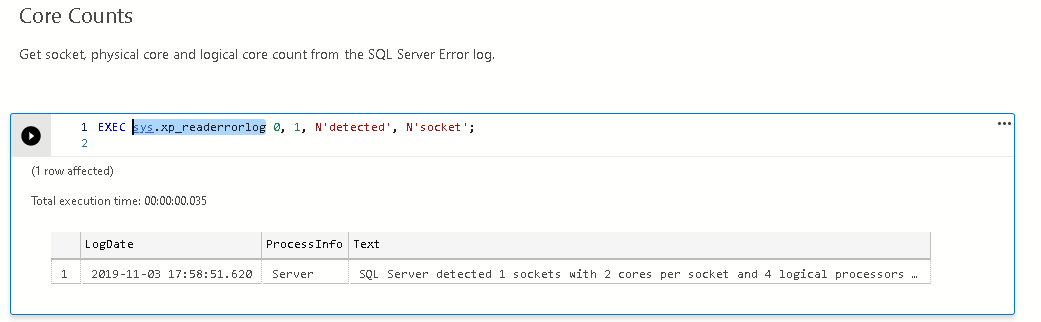
Core Counts
It reads the SQL Server error logs using the sys.xp_readerrorlog and filter results for getting socket, physical and logical core counts:
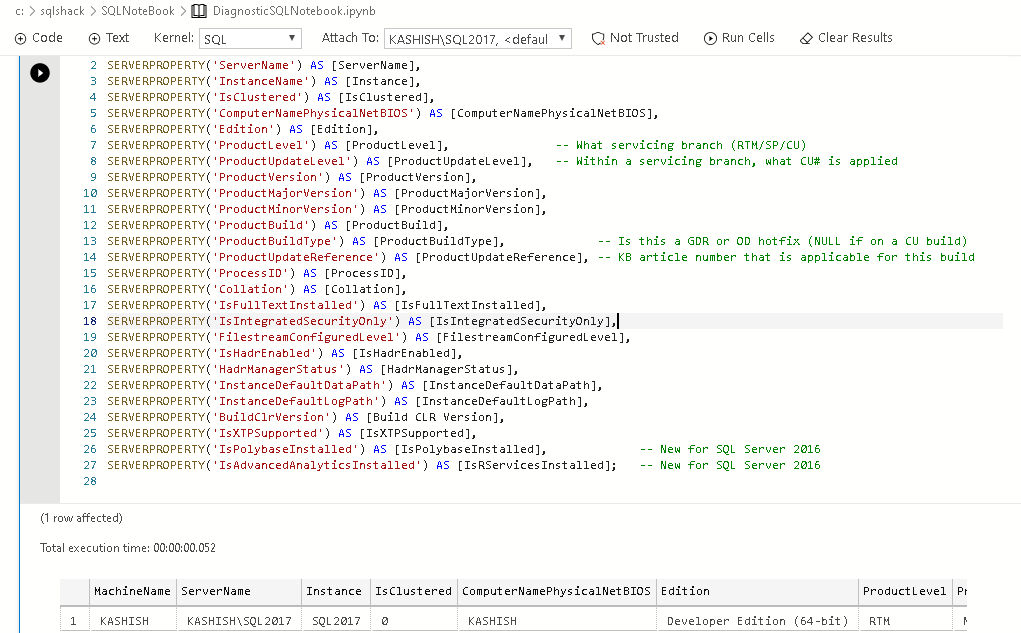
Server Properties
This section queries the SQL instance using the system defined function SERVERPROPERTY() and gives us useful information such as build, collation, edition, version, physical hostname, cluster property, instance default data, log path, etc. You can refer to Microsoft docs for more information about this function:
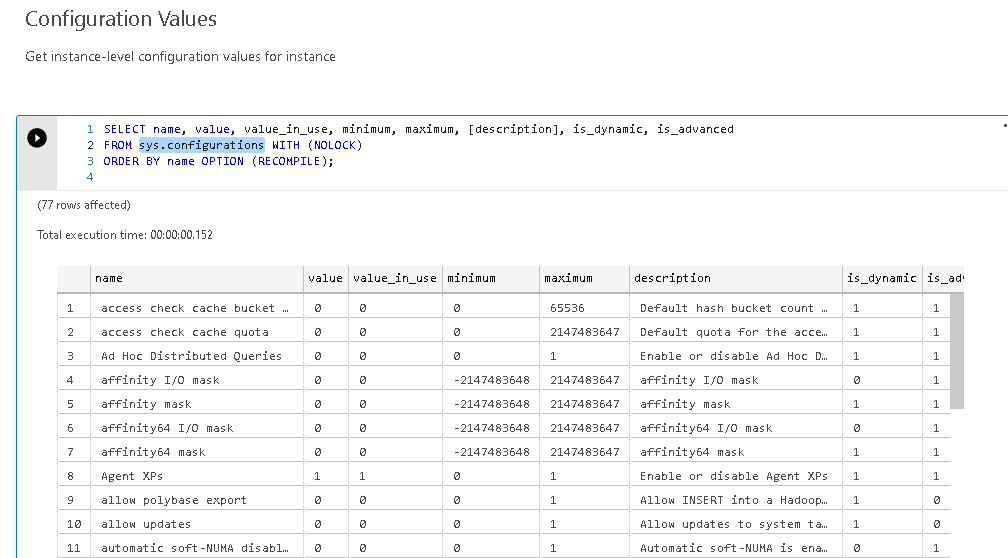
Configuration Values
It gives you various configuration options along with their minimum, maximum, in use-value for server-wide options. You can refer to the following link for reference:
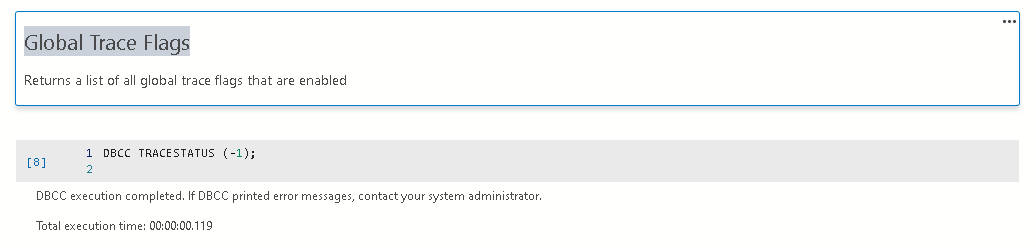
Global Trace Flags
If you have enabled any trace flags globally, you can use the query in this section to get the details. In my instance, I do not have any such trace flag. Therefore, you do not get any output trace flag:
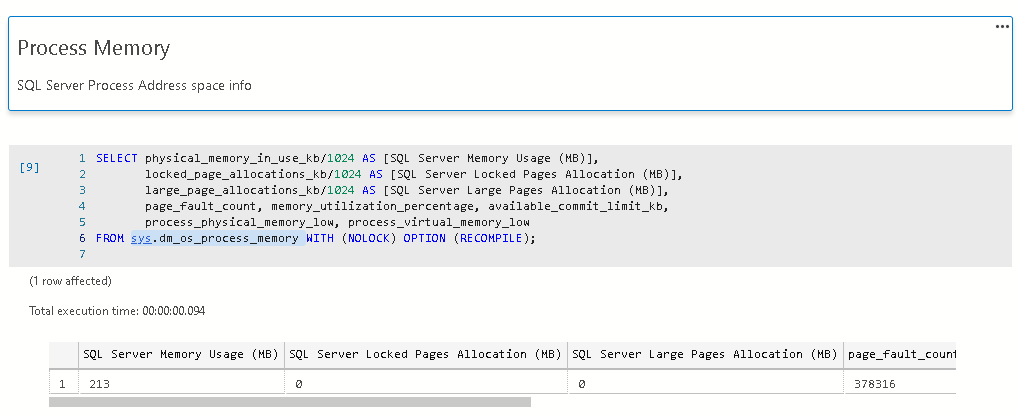
Process Memory
You can query dynamic management view sys.dm_os_process_memory for getting details of SQL Server memory allocations. You can refer Microsoft docs to learn about this DMV:
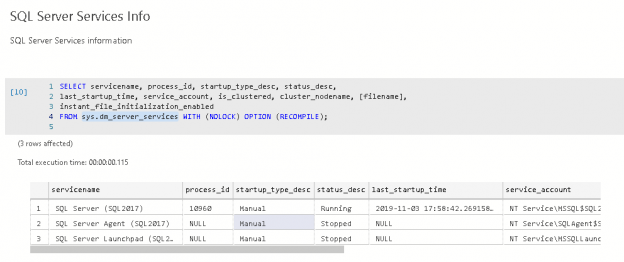
SQL Server Services Info
We can use sys.dm_server_services Dynamic management view for getting status of SQL Server, SQL Agent, and full-text services. It also shows service startup type, last start timestamp, service account, instant file initialization, and clustered status:

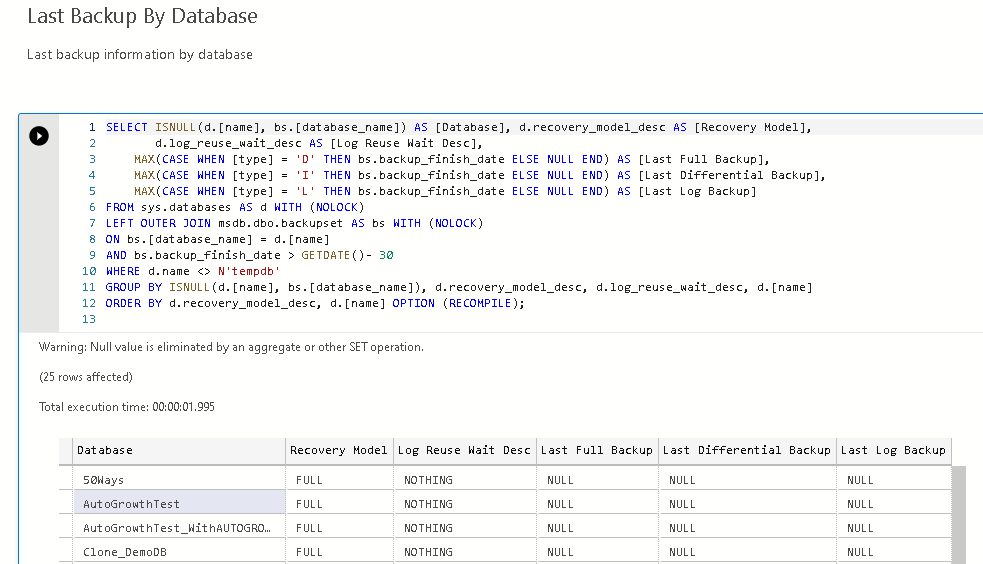
Last Backup by Database
Backup information is a vital monitoring aspect for any DBA. We can use this section for fetching the following information about the last database backups. SQL Notebook query fetches the information from the system Database MSDB:
- Database recovery model
- Log use wait status
- Last full, differential and log backup timestamp
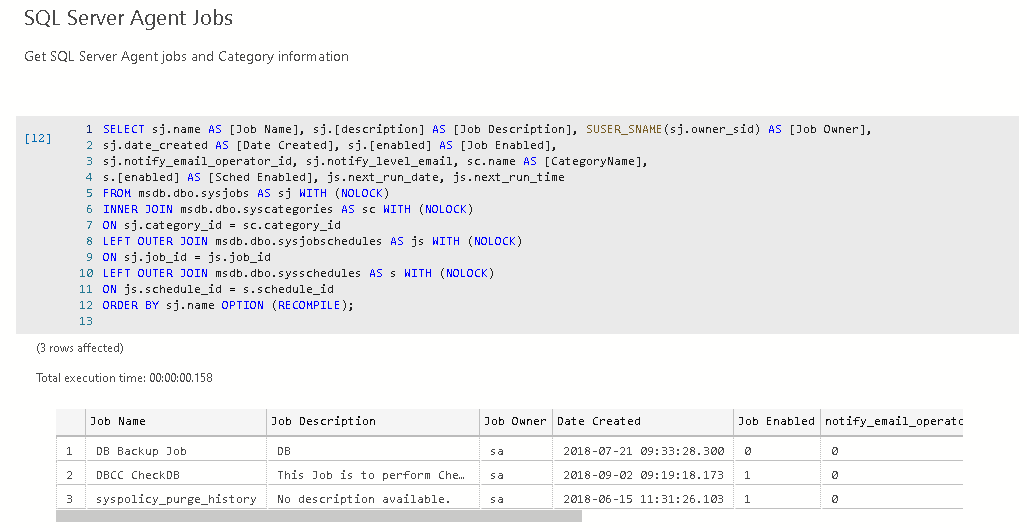
SQL Server Agent Jobs
This section queries the MSDB jobs for fetching SQL agent jobs information such as created date, owner, job status (enabled\disabled), and next run schedule:
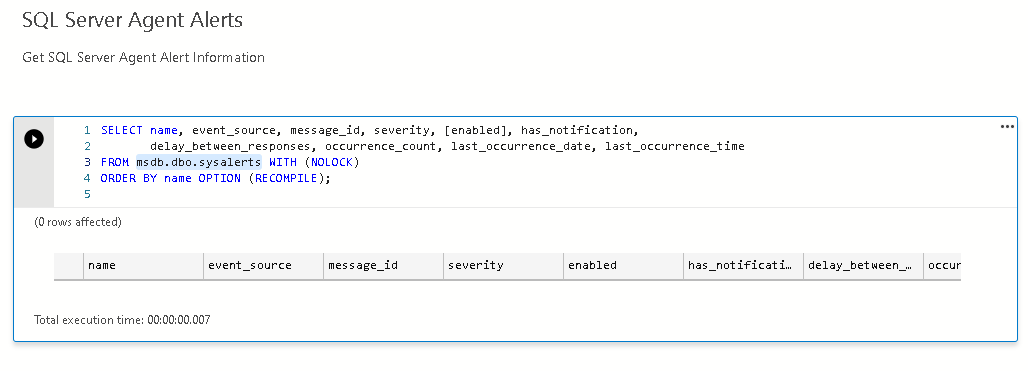
SQL Server Agent Alerts
If we have specified SQL Server agent alerts, we get the details in this section query. It queries the msdb.dbo.sysalerts system table for fetching the required details. I do not have any agent alerts for my SQL instance; therefore, the result is blank:
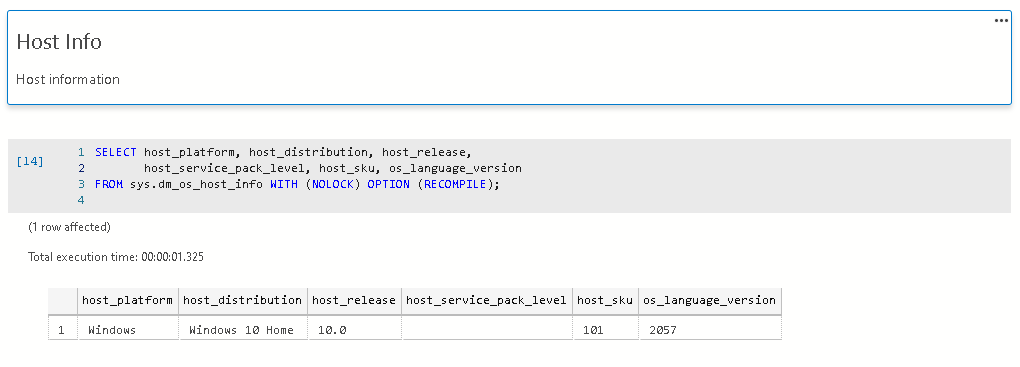
Host Info
It uses the sys.dm_os_host_info DMV for fetching underlying operating system information for the SQL instance:
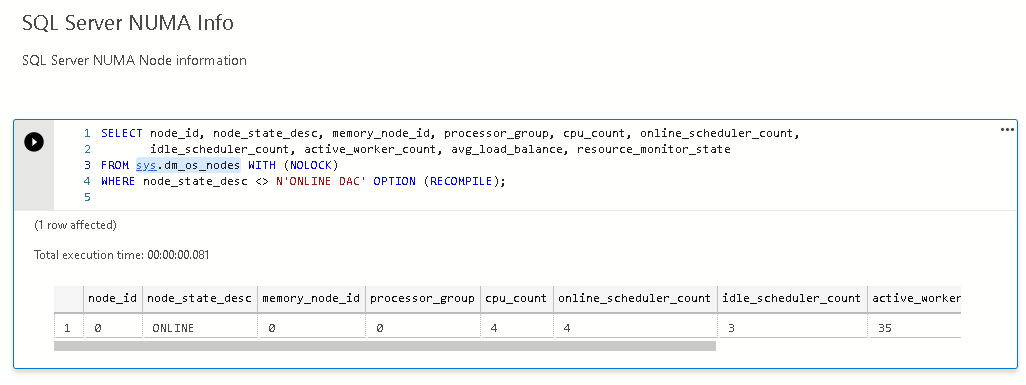
SQL Server NUMA Info
It is useful to know the SQL Server Numa information. We can get the information using the DMV sys.dm_os_nodes:
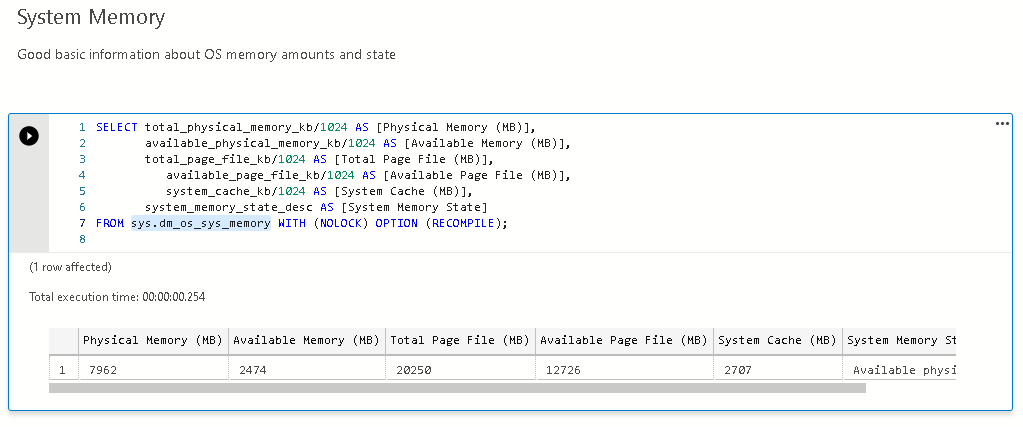
System Memory
It is important to know the system memory information such as total physical memory, available physical memory, page file information, and system memory state. It runs DMV sys.dm_os_sys_memory for this data:
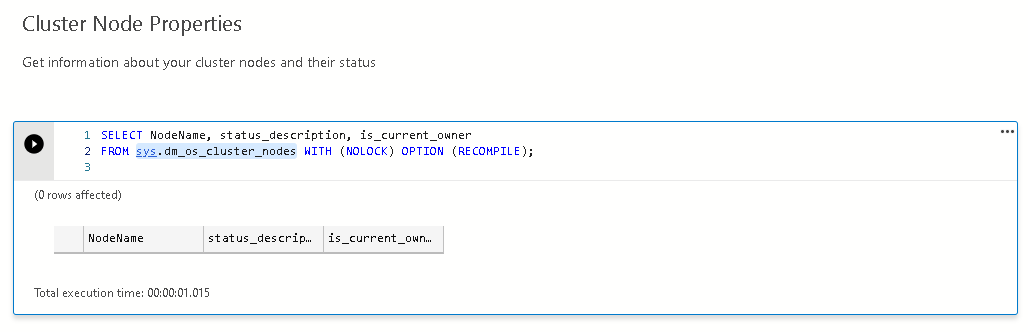
Cluster Node Properties
If SQL instance is part of the Windows failover cluster, we get run DMV sys.dm_os_cluster_nodes to get cluster owner and status description. I am connected to a standalone instance; therefore, you do not get any output row:
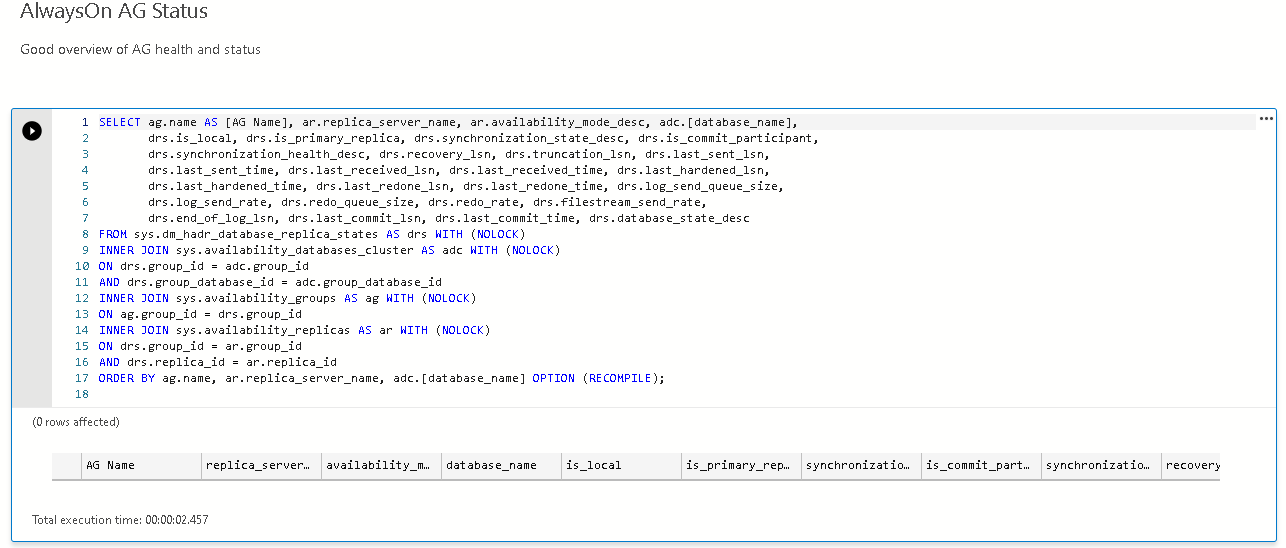
AlwaysOn AG Status
If you are using AlwaysOn Availability Groups, this section helps you in executing a query to find the AG health and synchronization status with LSN information:
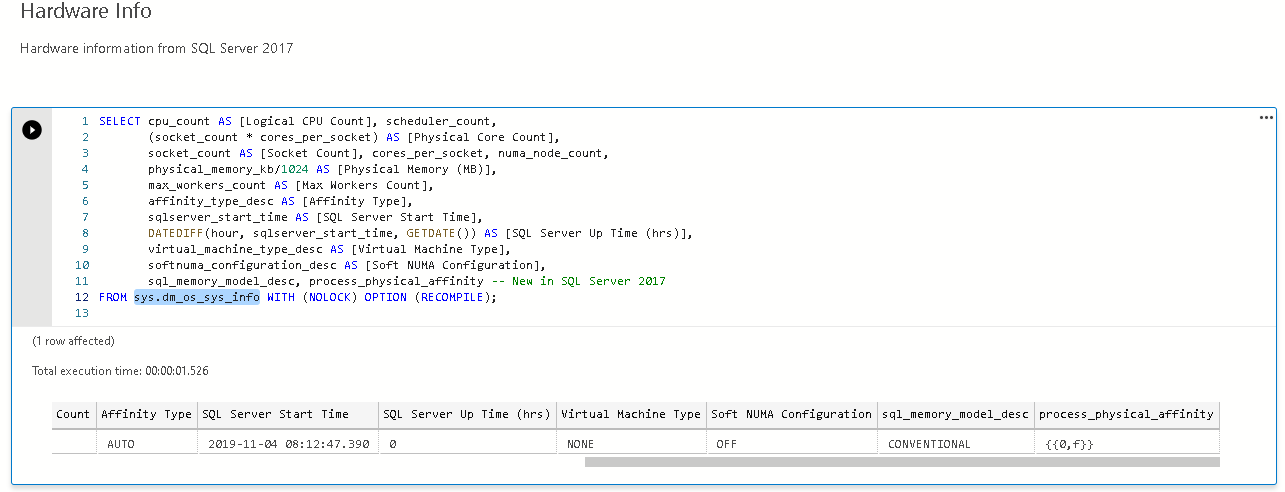
Hardware Info
It is good to know the hardware configuration of SQL Server 2017 underlying hardware. You can query sys.dm_os_sys_info to fetch these details:
There are many sections in this diagnostic book to retrieve useful information about SQL Server. You can execute these queries and etch the information in the SQL Notebook.
Let’s explore few useful diagnostic queries.
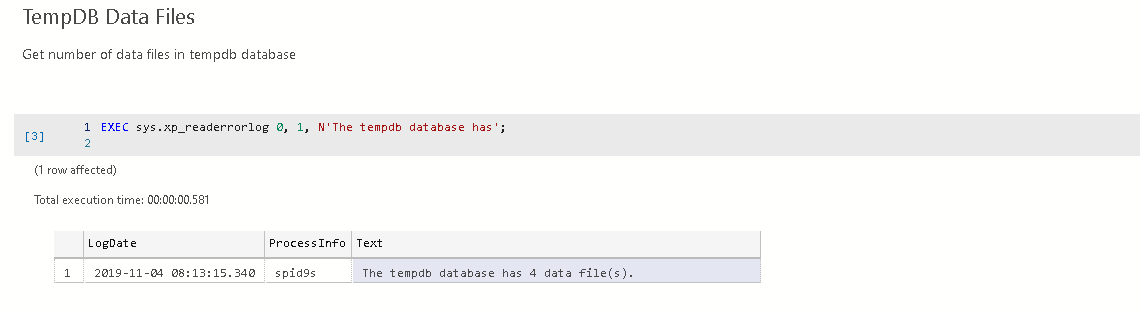
TempDB Data Files
It is essential to know a number of data files for the system database TempDB. This section fetches the information from the error log:
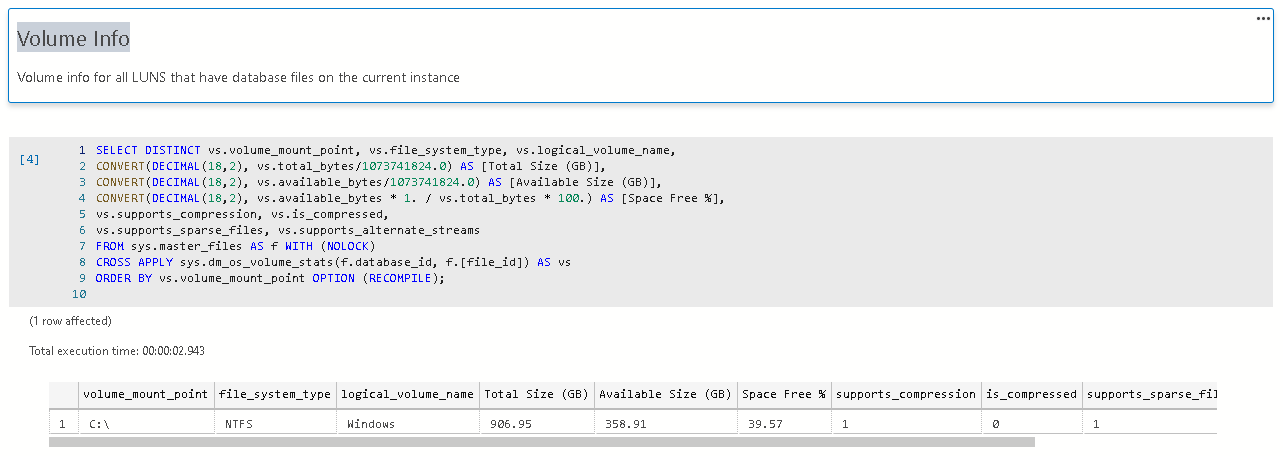
Volume Info (Monitor Disk Space)
You can monitor the disk space for the disk that holds the database files. We should take proactive actions if the free disk space is getting low. You get total disk space, available size, space free (%) as shown below:
Drive Level Latency
You should monitor the disk latency for the underlying storage system. A slow disk drive can cause performance
issues for the workload:
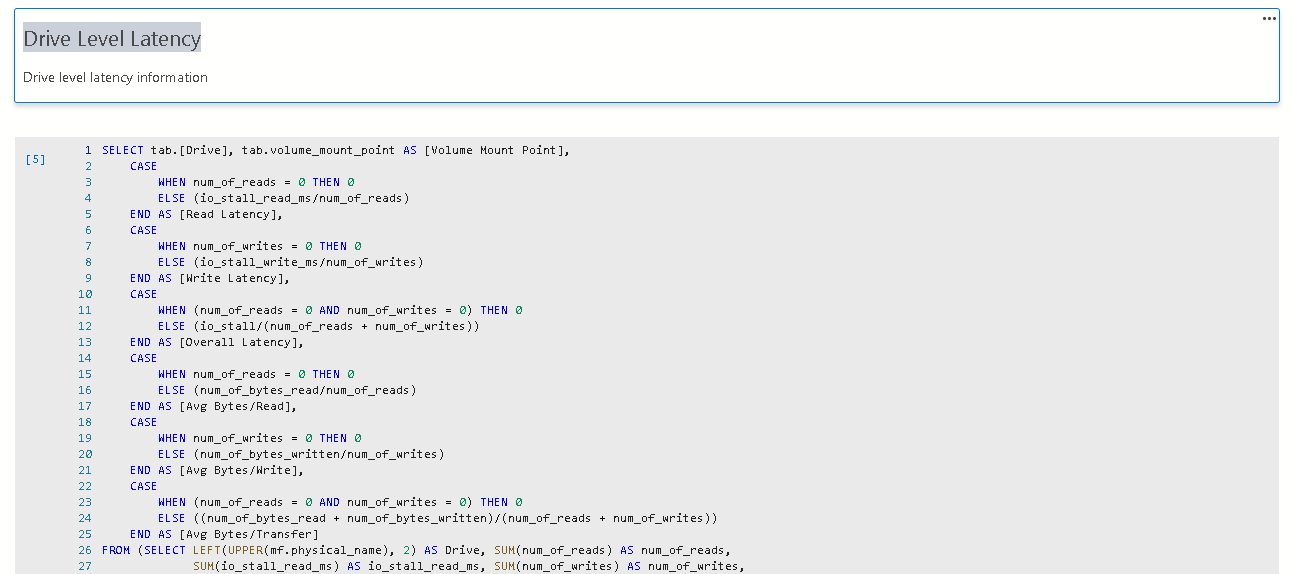
In the output, you can note read, write, overall latency for the disk. You also get Avg Bytes/Read, Avg Bytes/write, and Avg Bytes/Transfer useful performance monitor counters as well:
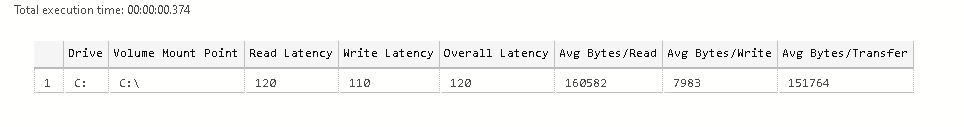
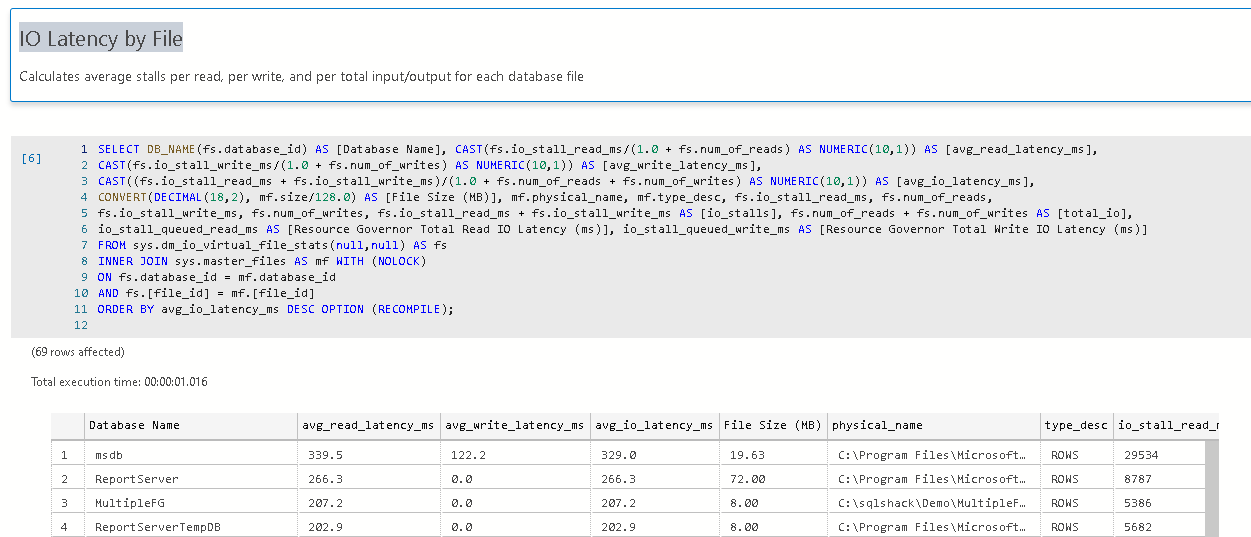
IO Latency by File
We might have multiple databases in a single SQL instance. We are interested in knowing which data files causing IO latency. It is an instrumental section in monitoring the latency for the data files:
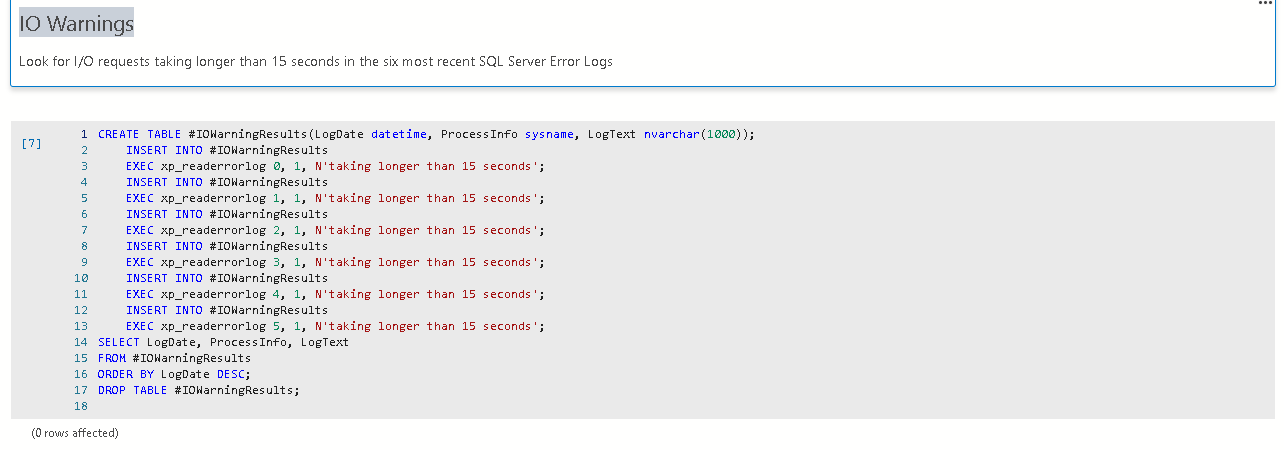
IO Warnings
SQL Server logs an entry in the error log if the IO request takes longer than 15 seconds to complete. This section fetches all such occurrence from the error log:
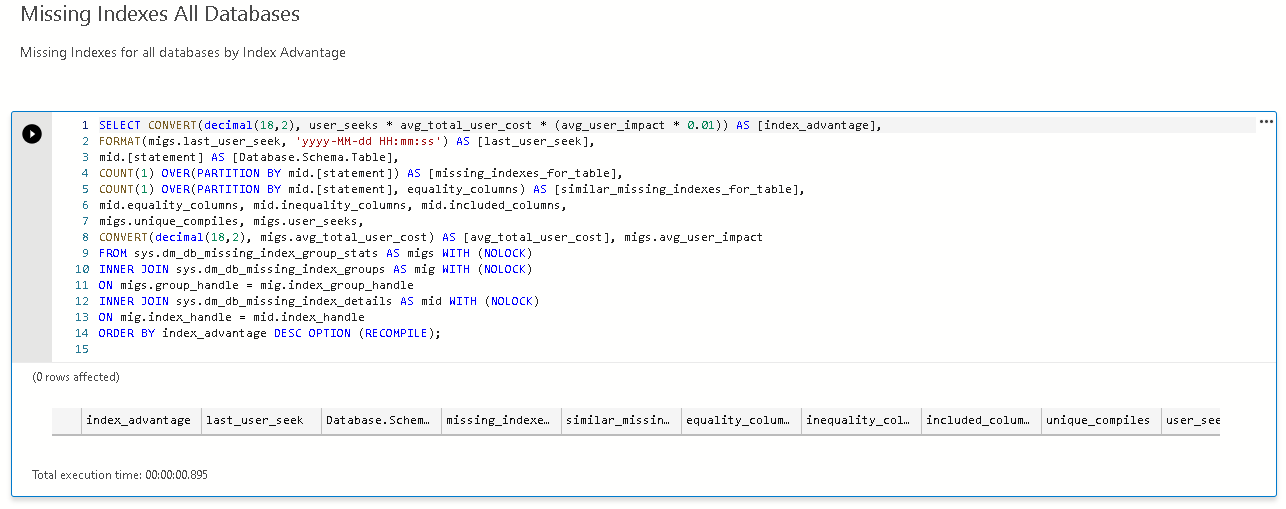
Missing Indexes All Databases
We should evaluate the missing index recommendation by the SQL Server. We should implement them if we find them suitable:
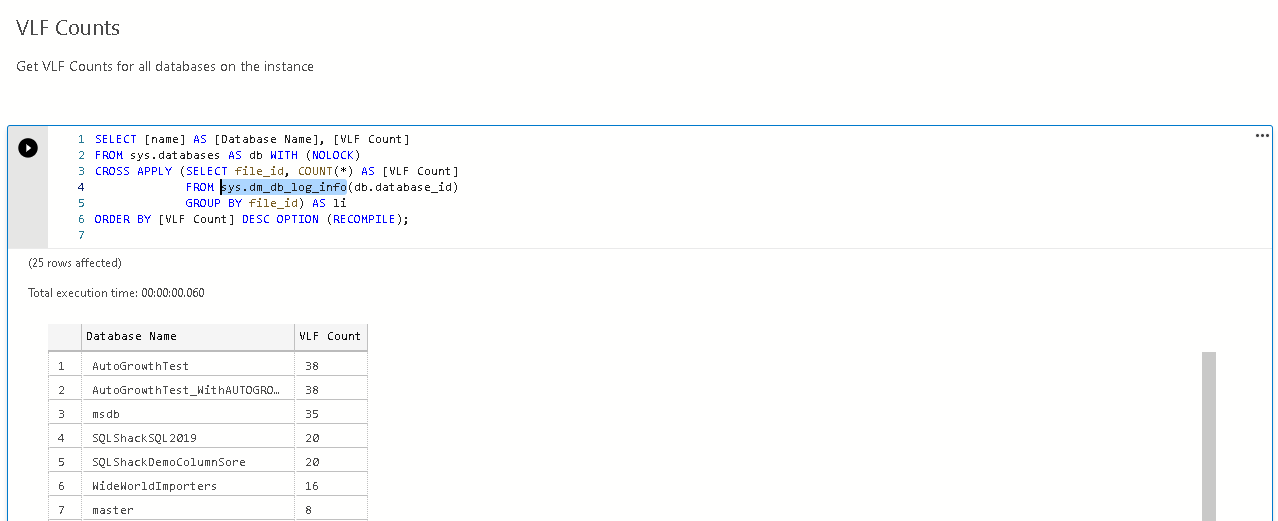
VLF Counts
We should also monitor the virtual log files (VLF) count and take appropriate actions if the VLF count is large. This section queries the sys.dm_db_log_info DMV and retrieves the information for each database in the instance:
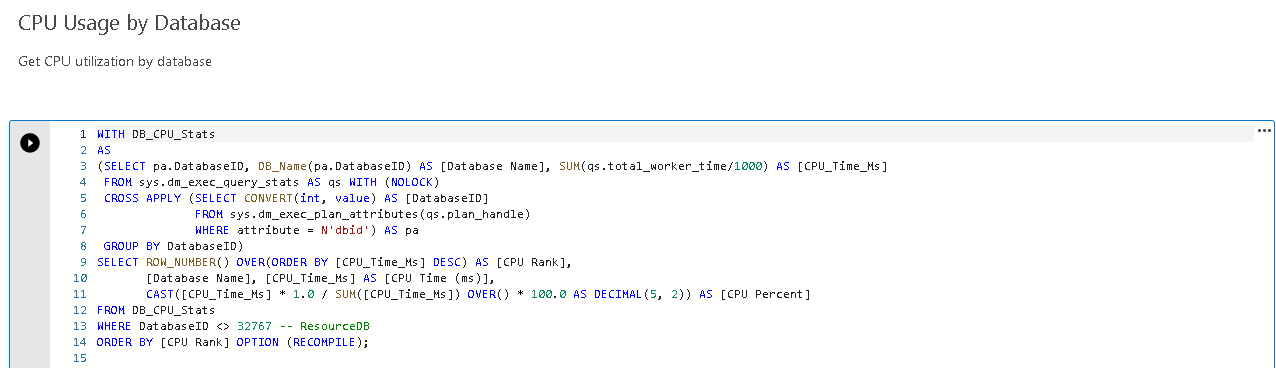
CPU Usage by Database
We can use this section to get a CPU usage breakdown for each database. We can identify the pattern of CPU usage and focus on the queries for the specific database for reducing the CPU usage:
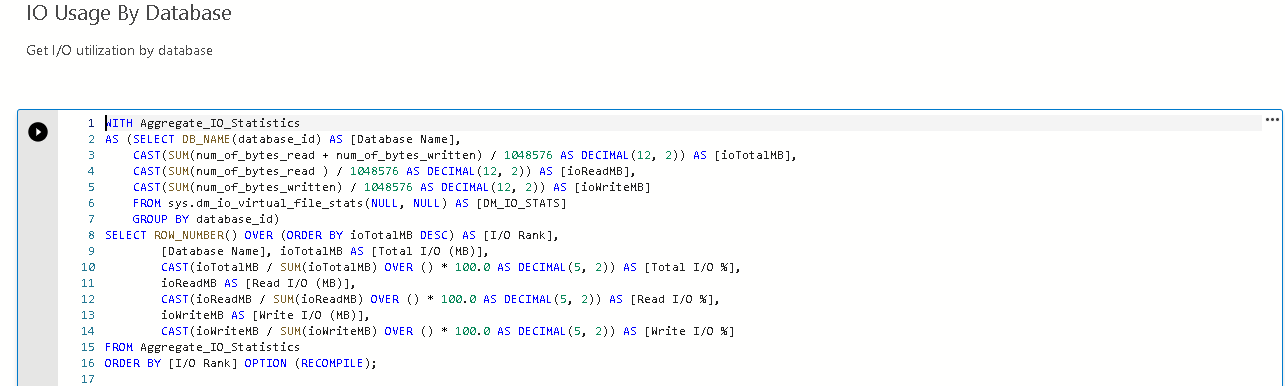
IO Usage by Database
We can use this section for knowing IO usage information for the individual database. It provides handy information for each database to troubleshoot performance issues:
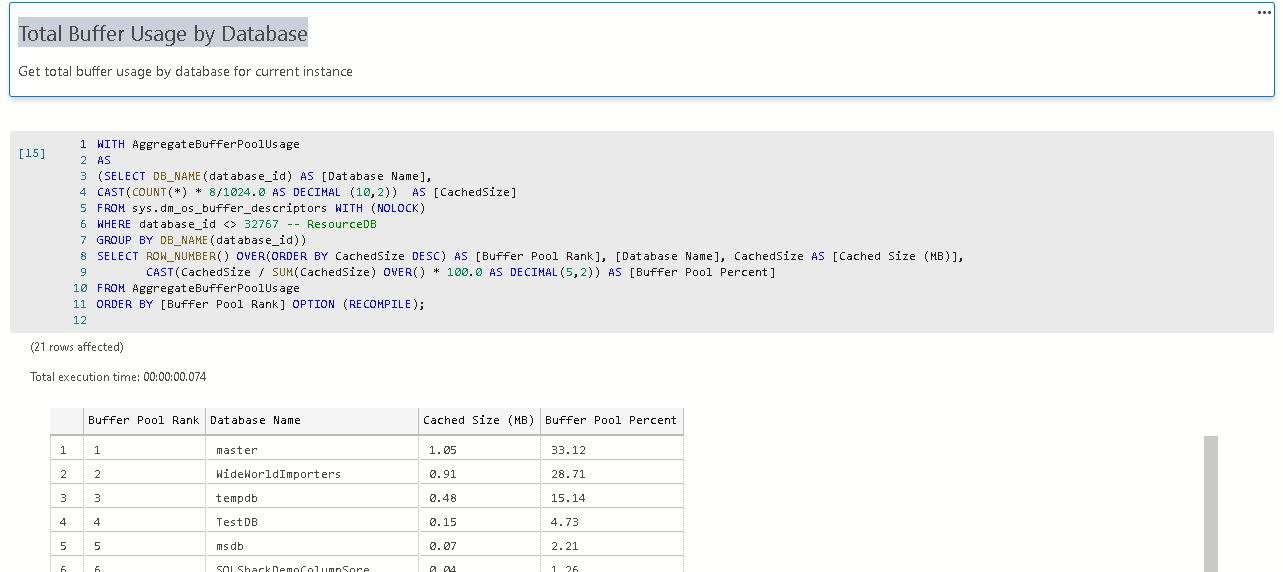
Total Buffer Usage by Database
We can execute the query specified here to know the contribution of each database in the buffer utilization. We might see an issue where a database is using most of the buffer space and the other databases see a performance issue due to this. Get the data and investigate:
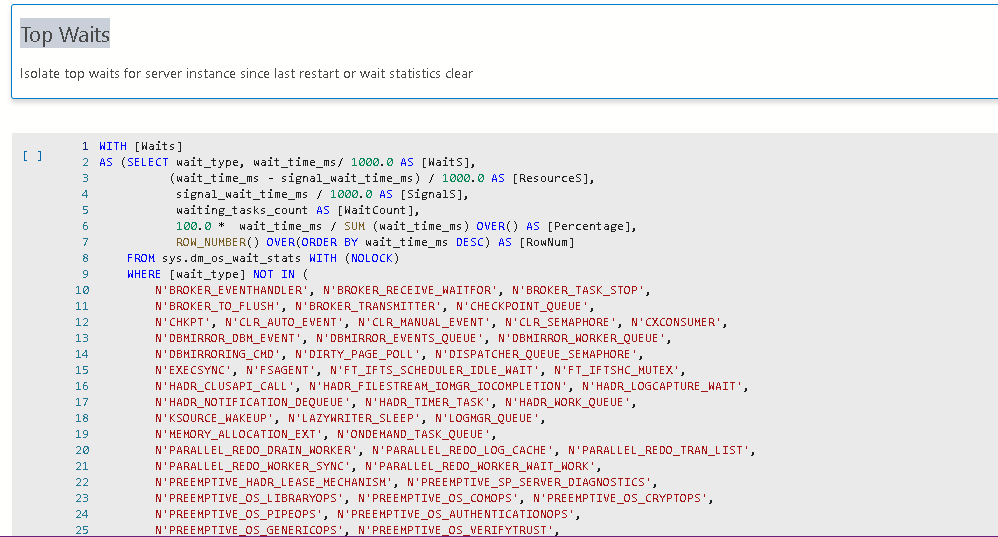
Top Waits
Waits provide internal information of query execution in SQL Server. We can find the bottleneck on which query is waiting for its execution. This section fetches the information from the DMV’s and displays the top consuming wait resources:
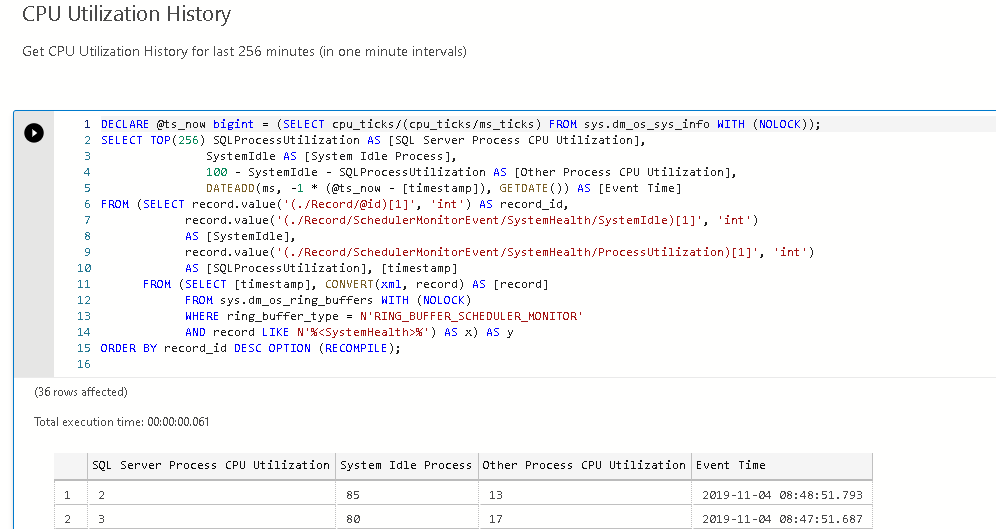
CPU Utilization History
We can get the CPU utilization of the SQL Server and OS processes using the ring buffer. Suppose you get high CPU utilization alerts and we can get a history of CPU utilization that whether SQL or OS process is causing this issue:
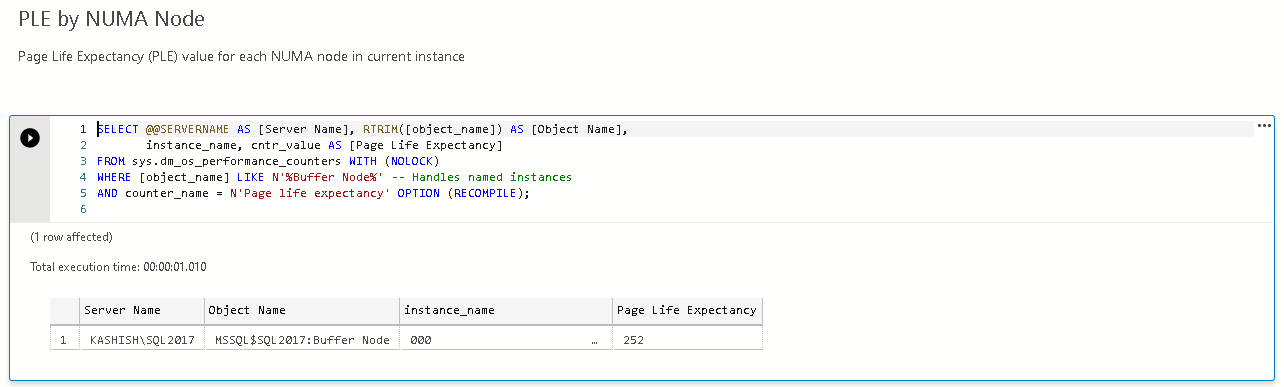
PLE by NUMA Node
Page life expectancy is a useful monitoring parameter in troubleshooting performance issues. You should monitor the PLE value and investigate if the PLE value is continuously low:
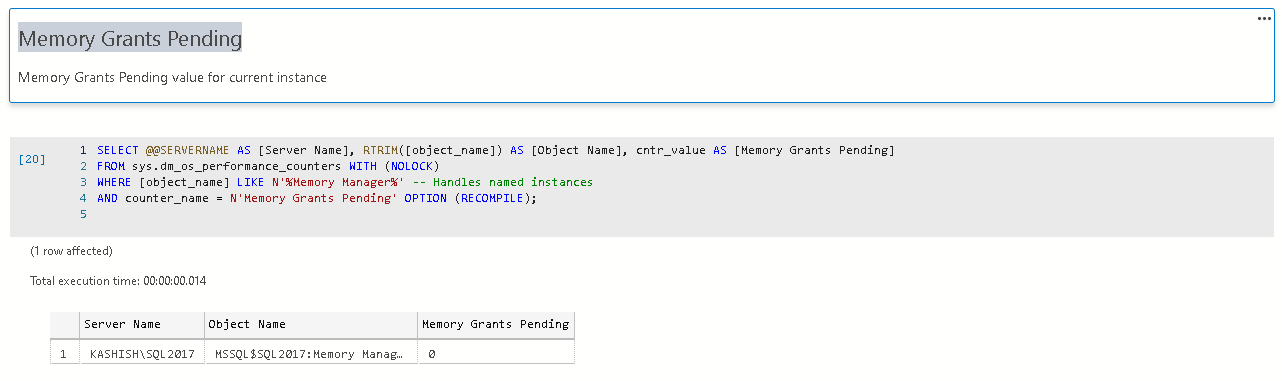
Memory Grants Pending
We should not have memory grants pending in SQL Server. If you have pending memory grants, queries will wait until memory is not allocated:
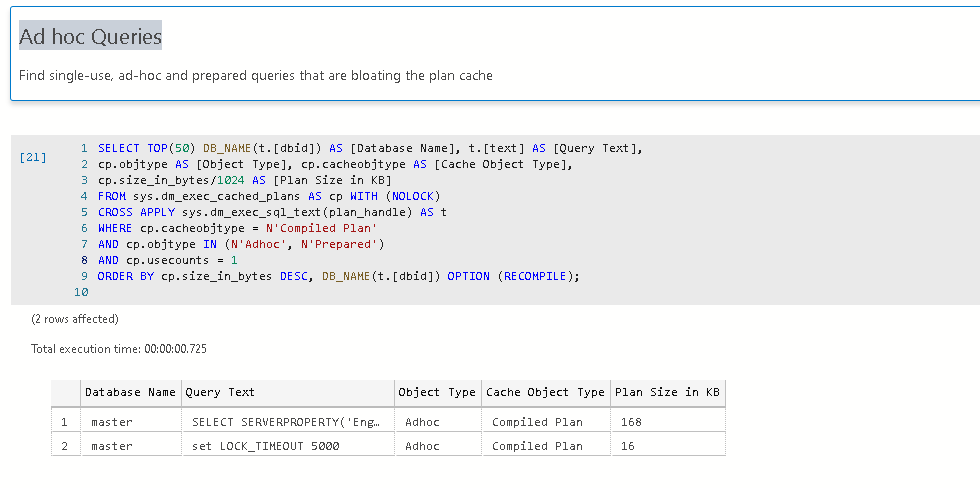
Ad hoc Queries
We should minimize ad-hoc queries in SQL Server. An ad-hoc query causes SQL Server to prepare an execution plan for each query. It might bloat plan cache and cause performance issues if we have a large number of ad-hoc queries:
Execute query in this section to get ad-hoc queries
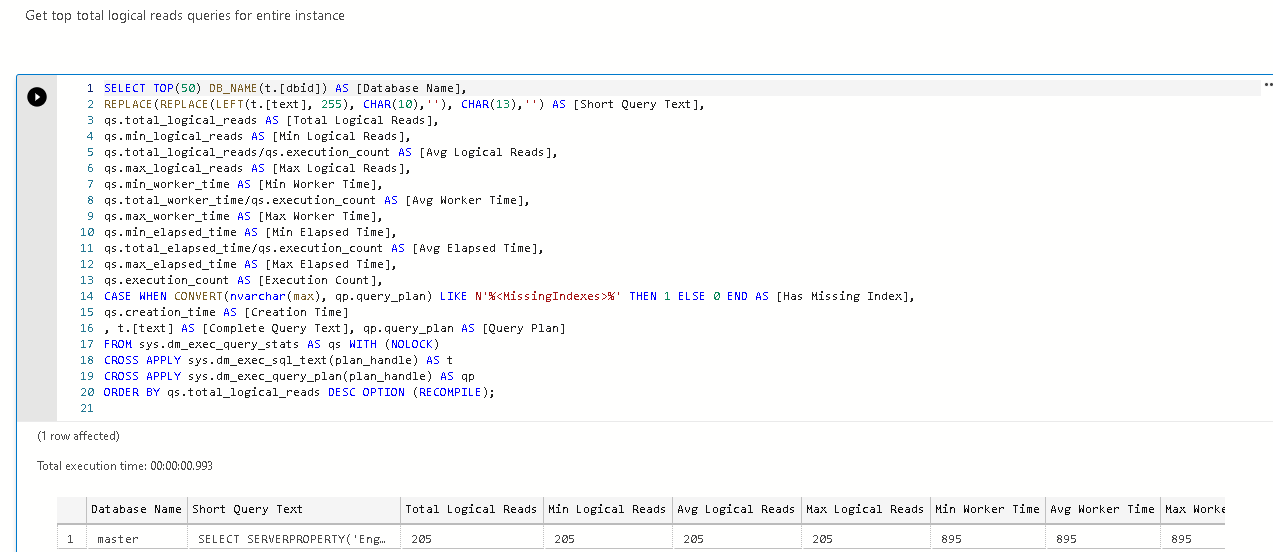
Top Logical Reads Queries
We should identify and tune the queries with high logical reads. This section uses DMV’s to fetch top logical reads and suggest any missing index as well:
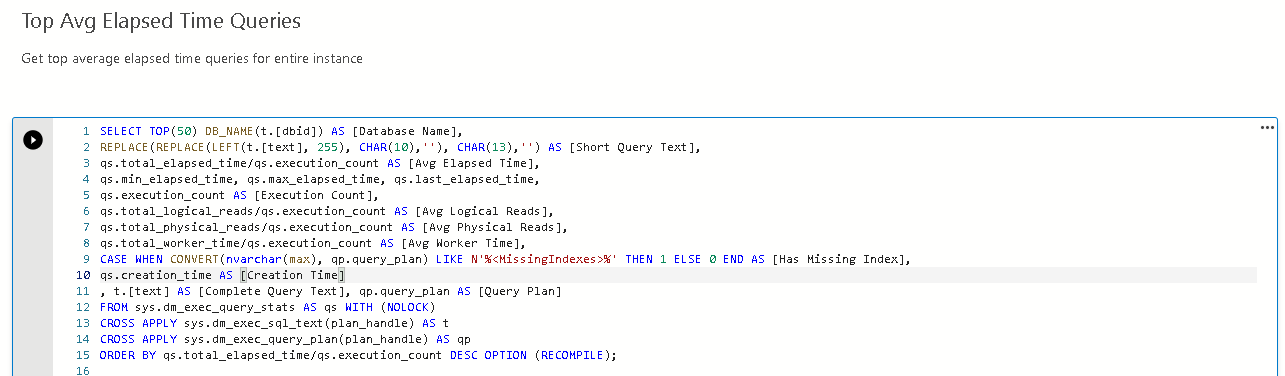
Top Avg Elapsed Time Queries
We get the list of queries taking a long execution time. You can further investigate, fine-tune those queries to reduce the performance bottleneck:
Conclusion
We explored SQL Notebooks in Azure data studio with the diagnostic queries. You can keep this notebook handy and execute the queries for your SQL instance. We do not require copying scripts to SSMS. We can directly execute queries in a notebook and view the data.

I am the author of the book "DP-300 Administering Relational Database on Microsoft Azure". I published more than 650 technical articles on MSSQLTips, SQLShack, Quest, CodingSight, and SeveralNines.
I am the creator of one of the biggest free online collections of articles on a single topic, with his 50-part series on SQL Server Always On Availability Groups.
Based on my contribution to the SQL Server community, I have been recognized as the prestigious Best Author of the Year continuously in 2019, 2020, and 2021 (2nd Rank) at SQLShack and the MSSQLTIPS champions award in 2020.
Personal Blog: https://www.dbblogger.com
I am always interested in new challenges so if you need consulting help, reach me at rajendra.gupta16@gmail.com
View all posts by Rajendra Gupta
- Understanding PostgreSQL SUBSTRING function - September 21, 2024
- How to install PostgreSQL on Ubuntu - July 13, 2023
- How to use the CROSSTAB function in PostgreSQL - February 17, 2023