
As all other database engines that require a GUI too to interact with, Microsoft built SQL Server Management Studio as a tool that provides an environment to manage, configure, monitor and administrate the SQL Server infrastructure for different kind of instances, that are installed locally at your machine, on a remote server with Windows or Linux operating systems or hosted in the cloud such as SQL Azure or Azure Data warehouse.
Recall that the SQL Server Management Studio consists of the Object Explorer, which is used to view and manage all objects within the SQL Server instance, the Template Explorer, that is used to deal with the scripting text files and the Solution Explorer, that is responsible for building the projects that contain list of T-SQL scripts in SQL Server.
In my previous related articles of this series, What’s new in SQL Server Management Studio 17.2; Authentication methods, scripting options and more and What’s new in SQL Server Management Studio 17.3; Import Flat File wizard and XEvent Profiler, we went through the newly added features and improvements performed on the already existing features of the SQL Server Management Studio, such as the new options on the connection dialog box, the new scripting option, the embedded Performance Dashboard and the Showplan node search that are introduced in SQL Server Management Studio 17.2. In SQL Server Management Studio 17.3, the Import Flat File Wizard and the XEvent Profiler features are introduced, in addition to a large number of bugs in the previous versions of the SQL Server Management Studio that are fixed.
Starting from SQL Server 2017, SQL Server Management Studio takes its own track of versioning, by assigning that 17.X number for the new releases of the SSMS, separating it from the SQL Server Engine version number, that is 14.0 for SQL Server 2017 version.
Also, starting from SQL Server 2016 version, SQL Server Management Studio has its own installation media, that is separated from the SQL Server Engine installation, that can be downloaded from the Microsoft Download page and installed to the local machine or server easily, taking into consideration that, the new SSMS version will not replace the already existing SSMS versions. Instead, SSMS 17.X will be installed side by side with the existing SSMS 2016 and 2014 versions.
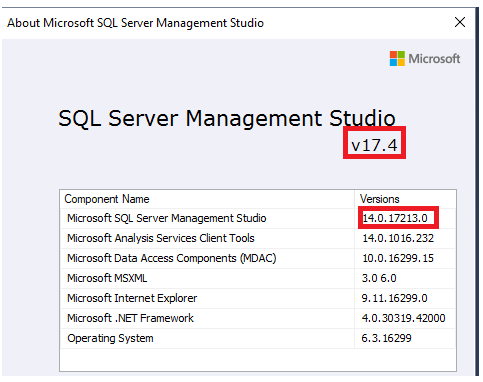
SQL Server Management Studio 17.4 is released now, based on the Visual Studio 2015 isolated shell and assigned build number 14.0.17213.0. After installing it to your local machine, you can check that the latest SQL Server Management Studio version is installed by choosing About from the Help menu as in the snapshot below:
SQL Server Management Studio 17.4 works with all supported versions of SQL Server 2008 and later, including working with Azure SQL Database and Azure SQL Data Warehouse. SSMS 17.4 can work with SQL Server 200 and 2005, but some features may not work properly. From the OS side, SSMS 17.4 supports Windows 7 (64-bit) and later client operating systems and Windows Server 2008 R2 (64-bit) and later versions, making sure that the latest service pack is installed.
In this article, we will discuss a number of important bugs that are fixed in SSMS 17.4, in addition to the most useful enhancements and new features added to the SSMS 17.4.
In SSMS 17.4, Microsoft updated the SQL Server Management Studio by fixing a large number of bugs that customers faced and reported in the previous SSMS versions. Some of these important bugs that are fixed in this new build include:
- Table-valued function node cannot be browsed in the database snapshot
- SSMS crashed when the connection to the remote machine is lost due to VPN connection issue
- IntelliSense is not working well when the user does not have access to the master database
- SSMS crashed when the user does not have VIEW SERVER STATE permissions
- Closing the XE Profiler live data window will not stop the underlying XE session
- Job Activity Monitor failed to filter on category
- Domain users without Read\Write access on the domain controller could not connect to SQL Server using SQL Authentication
Always On availability group dashboard enhancements
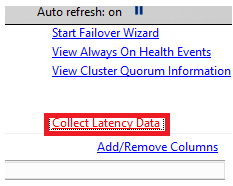
In SQL Server Management Studio 17.4, a new option is added to the Always On Dashboard that is responsible for collecting statistics about the synchronization latency between the primary and the secondary replicas. Right-click on the Always On availability group name and choose Show Dashboard. At the right side of the Always On availability group dashboard, you will find a new option, Collect Latency Data, that is used to start collecting data about the synchronization latency between the Always On availability group replicas, as shown below:
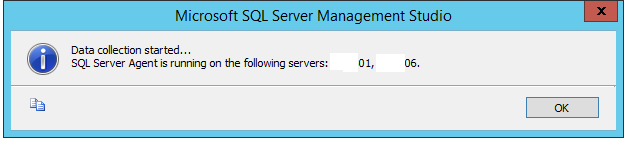
Clicking on the Collect Latency Data option, the below message will be displayed, informing you that the latency data collection will start working after checking that the SQL Server Agent is working on all replicas, as shown below:
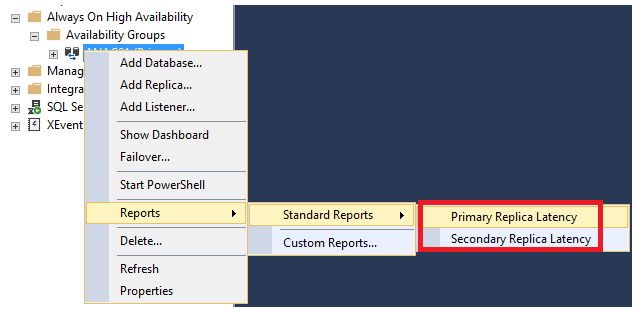
The collected latency data can be displayed using the two newly added Always On availability group built-in reports; AlwaysOn_Latency_Primary and AlwaysOn_Latency_Secondary. The two reports are viewed by right-clicking on the Availability Group name, choose Reports, then Standard Reports from where you can choose the latency report, as shown in the snapshot below:
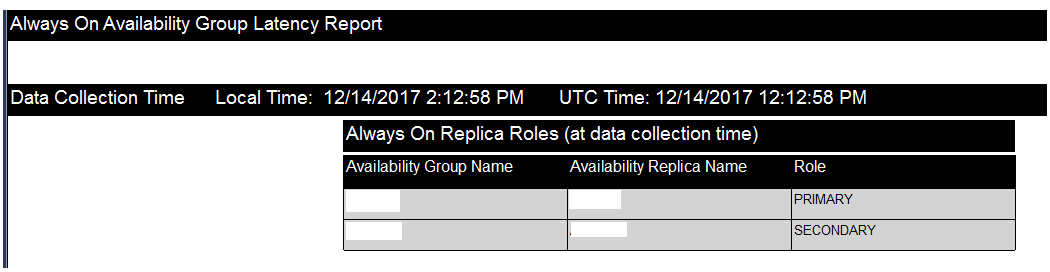
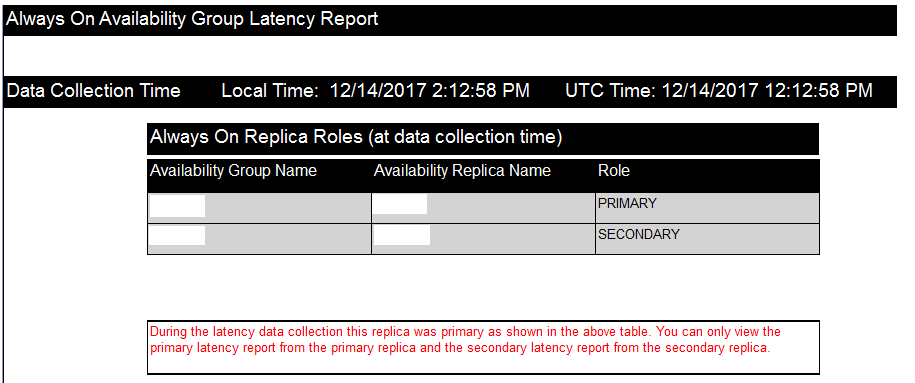
The opened Always On availability group latency report consists of many parts. The first part displays a list of all availability replicas with the role of each replica within the Availability Groups; PRIMARY or SECONDARY, that will be like the below:
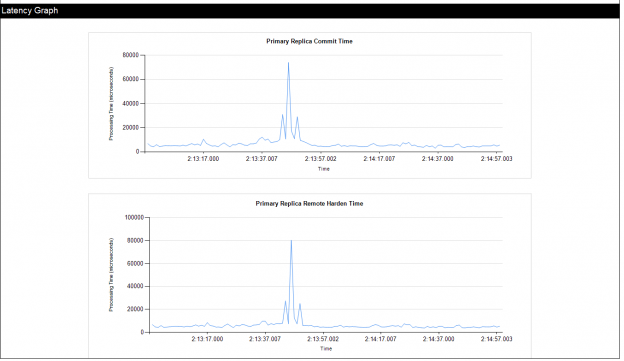
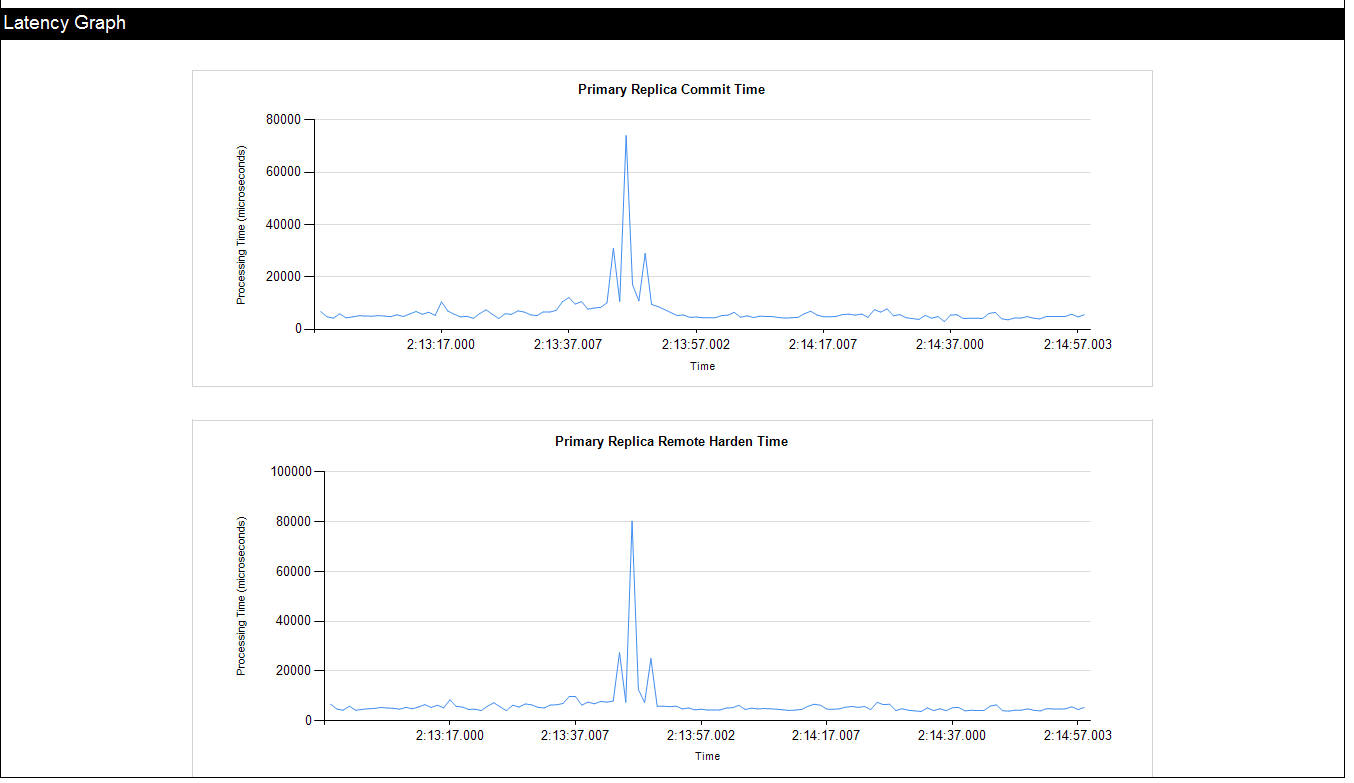
The second part of the Always On availability group latency report is the Latency Graph, that shows the time required to commit the transactions at the PRIMARY side (in microseconds) over a specific period of time, as in the snapshot shown below:
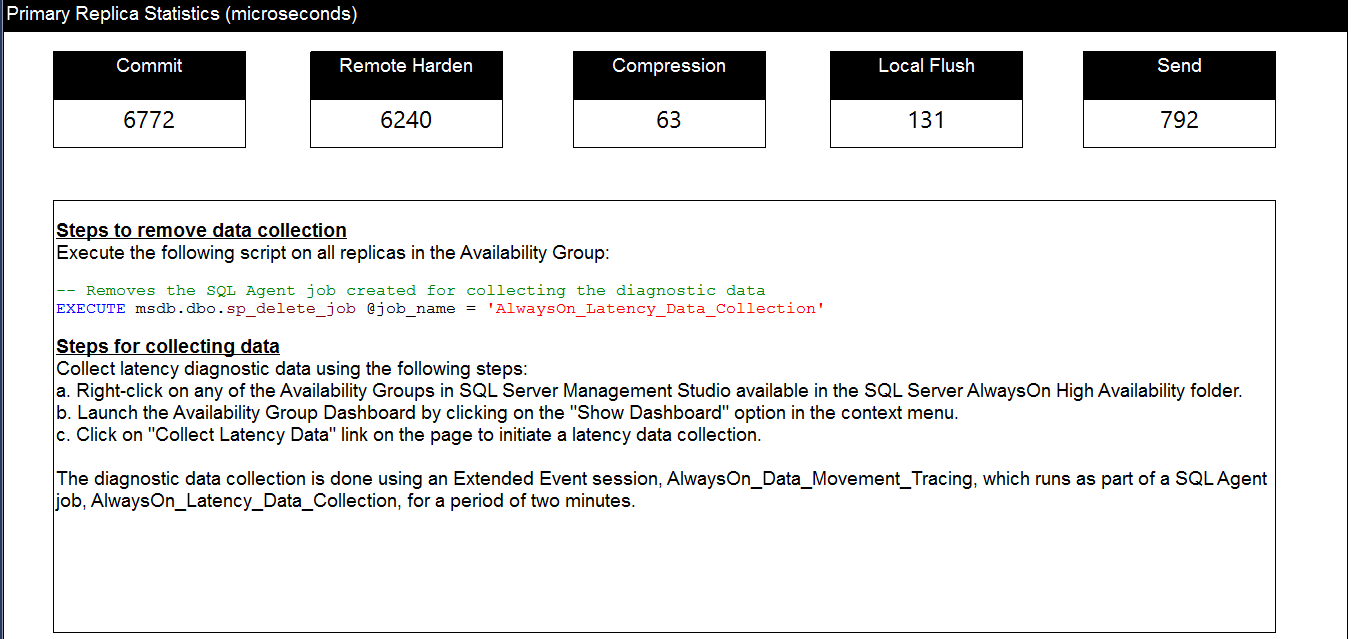
The last section of the Always On availability group latency report is the Primary Replica Statistics, that shows the total amount of time (in microseconds) consumed in the Commit, Remote Harden, Compression, Local Flush and Send processes, as shown below:
The AlwaysOn_Latency_Primary report can be viewed only from the PRIMARY replica, and the AlwaysOn_Latency_Secondary report can be viewed only from the SECONDARY replica. If you try to open the AlwaysOn_Latency_Secondary from the PRIMARY replica, no statistics, except for the replicas list, will be viewed about the SECONDARY replica, displaying the error message shown in the report result below:
XE Profiler enhancements
In SQL Server Management Studio 17.4, a number of enhancements are performed on the XE Profiler, that is added to the SQL Server in SSMS 17.3. These enhancements include:
- Stop and Start menu commands will stop and start the session by default now
- Keyboard shortcuts, such as CTRL-F or CTRL-H, are enabled
- Database_name and client_hostname actions are added to the appropriate events in XEvent Profiler sessions
- XE Profiler in SSMS 17.3 is renamed to XEvent Profiler in SSMS 17.4 as shown below:

Import Flat File Wizard enhancements
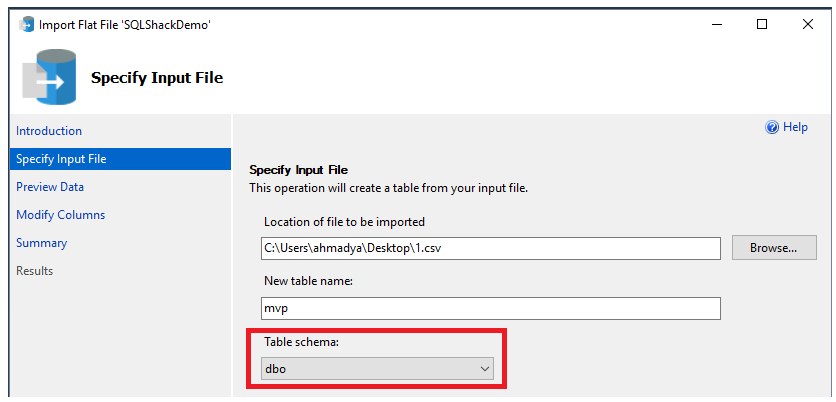
The SQL Server Import Flat File Wizard, that is introduced in SSMS 17.3, enhanced in SSMS 17.4 by providing us with a way to choose the schema name of the destination table that will be created and to which the flat file data will be inserted, as shown below:
Vulnerability Assessment
SQL Server Vulnerability Assessment (VA) service, introduced the first time in SSMS 17.4, is mainly used as a preventative security measure to scan, track and remediate the databases for potential vulnerabilities and deviations from Microsoft’s recommended best practices, such as misconfigurations, excessive permissions, and unprotected sensitive data or any issue that presents risks to the database and its critical data, using a knowledge base of rules that flag security issues when it runs a scan on the database. In other words, the SQL Server Vulnerability Assessment provides us with a visual way to check the security state of our SQL Server instance with actionable steps that help in investigating, managing and resolving the detected issues and provide customized remediation scripts where applicable. The generated Vulnerability Assessment report can be customized for a specific environment, by setting an acceptable baseline for permission configurations, feature configurations, and database settings.
SQL Server Vulnerability Assessment helps to proactively improve your database security by meeting the privacy standards, monitoring the dynamic database environments that have frequent changes that are difficult to track. Vulnerability Assessment also provides us with scan reports that are useful for meeting the data protection regulations compliance requirements. The SQL Server Vulnerability Assessment is supported starting from SQL Server 2012 and later versions, with the ability to use it on Azure SQL Database instance.
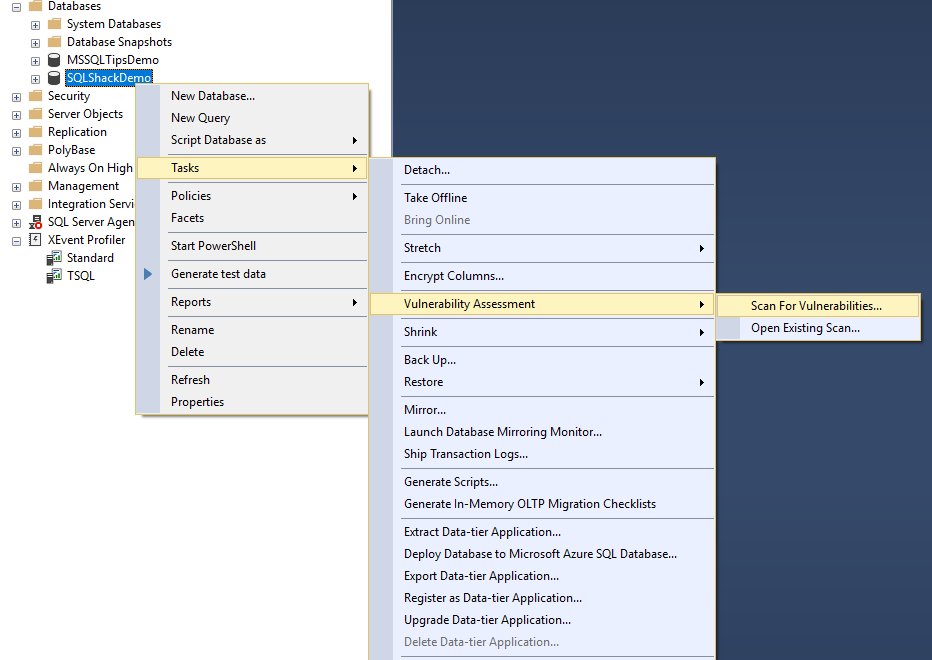
The SQL Server Vulnerability Assessment can be started on a specific database, by right-clicking on that database, choose Tasks and from the Vulnerability Assessment task select Scan For Vulnerabilities… as shown below:
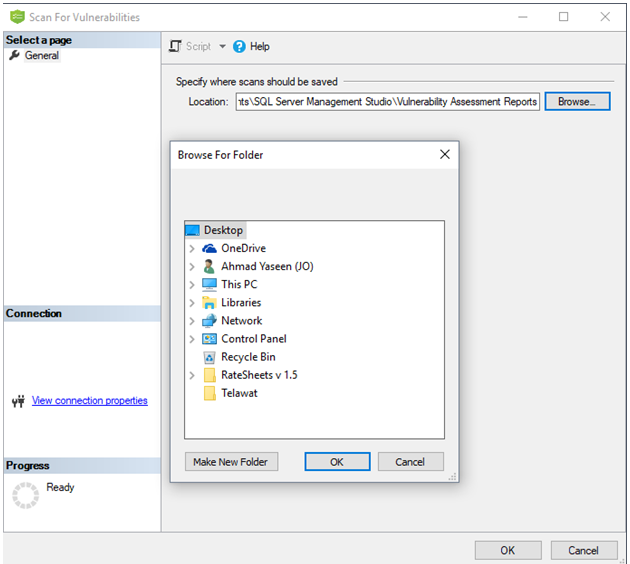
From the Scan For Vulnerabilities window, specify the location where the scans will be saved. You can change the default location by clicking on Browse to specify a customized location. Click OK to start the lightweight and safe vulnerabilities scan on your database, that will take few seconds to run, as shown below:
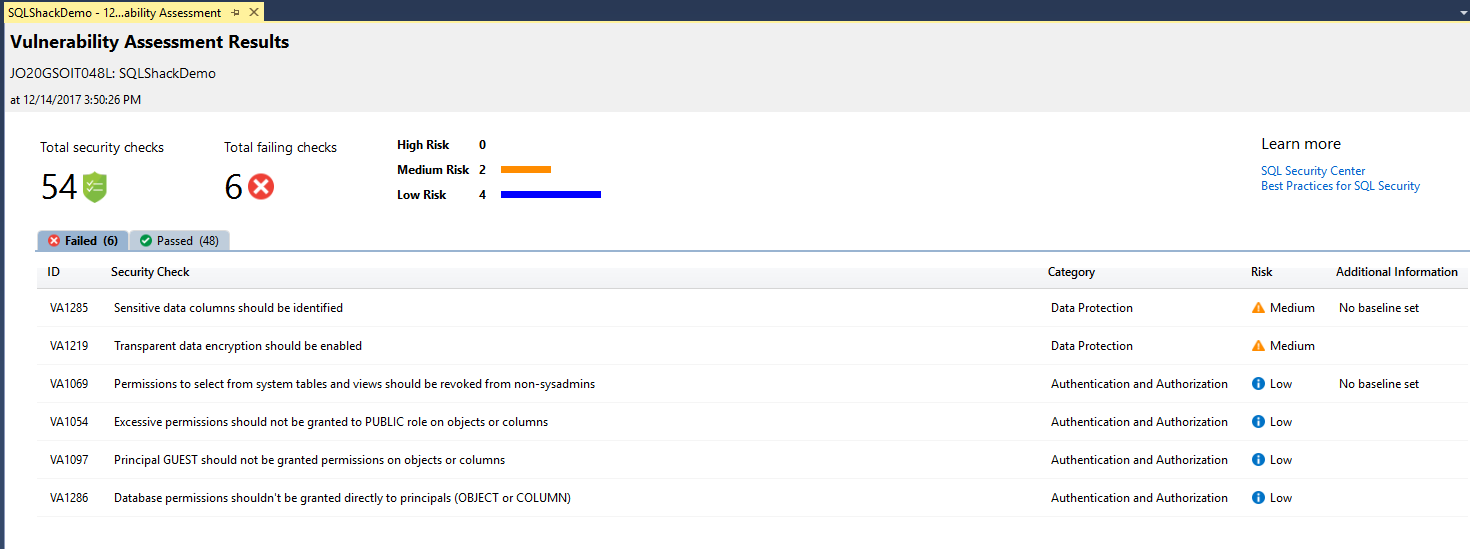
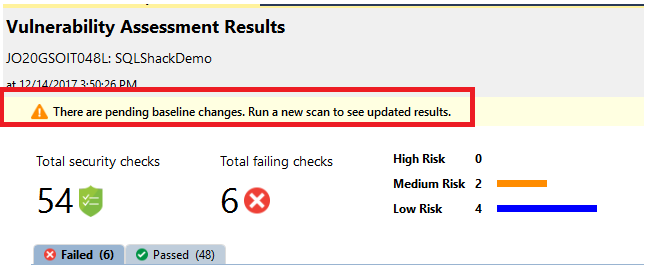
When the scan is completed, the scan report will be saved to the previously specified path and automatically displayed in the SSMS pane. The displayed report contains an overview of the current database security state, including a summary of the total number of security checks and the number of failed checks, with their respective severities. The report includes also a classification of passed and failed checks such as the category that this check belongs to, like sensitive data discovered or an issue with database principals permissions, the risk of that finding that describes its deviations from best practices and any extra information, if available, as shown in the scan report below:
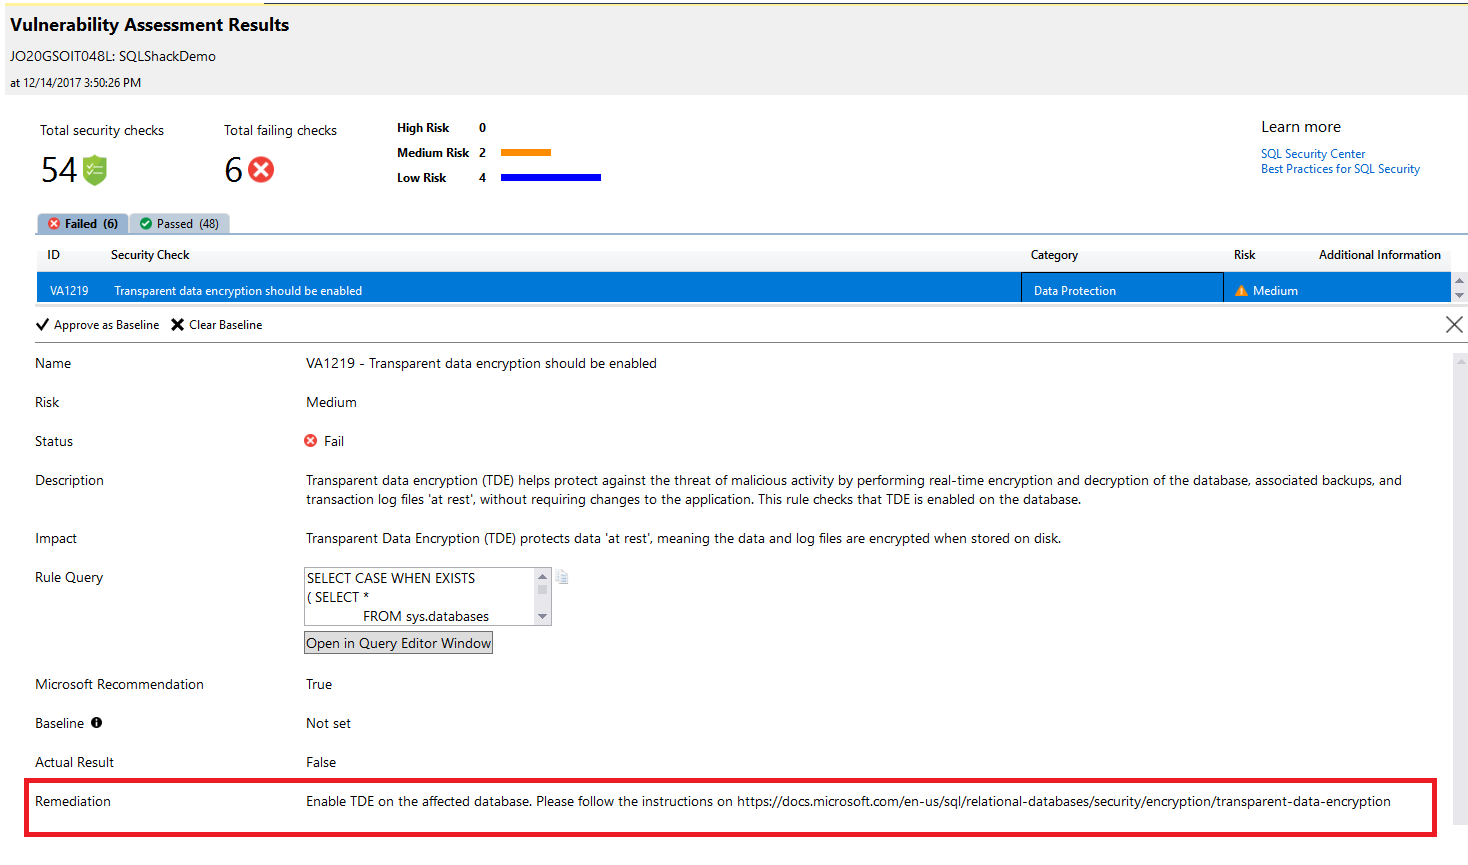
If you find that a specific failed check is very critical for your environment, click on it and drill down to check full detailed information about that finding including full description about it, the impact of that issue, why it failed and an actionable remediation information that can be used to overcome and resolve that issue, as shown below:
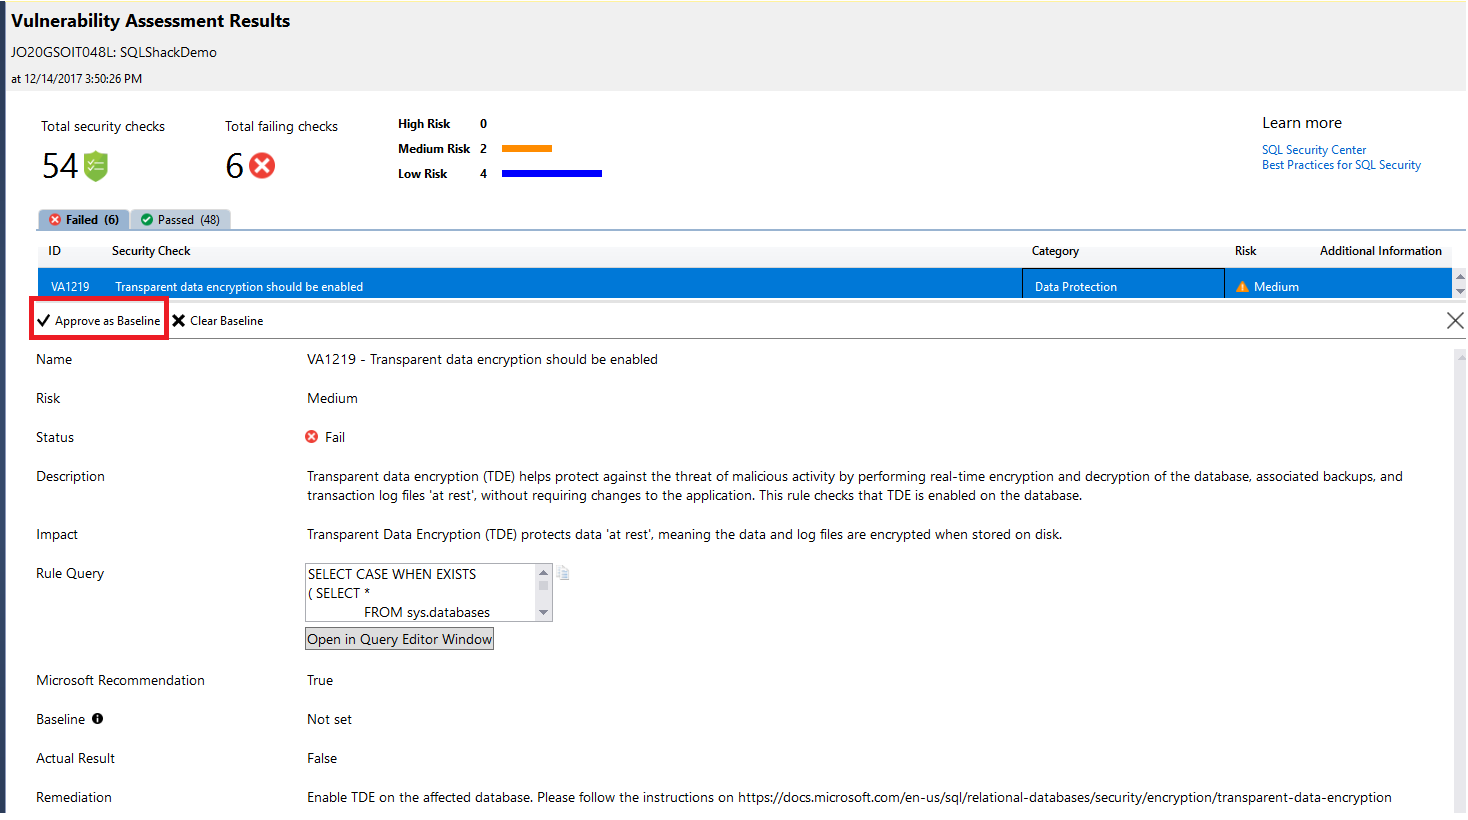
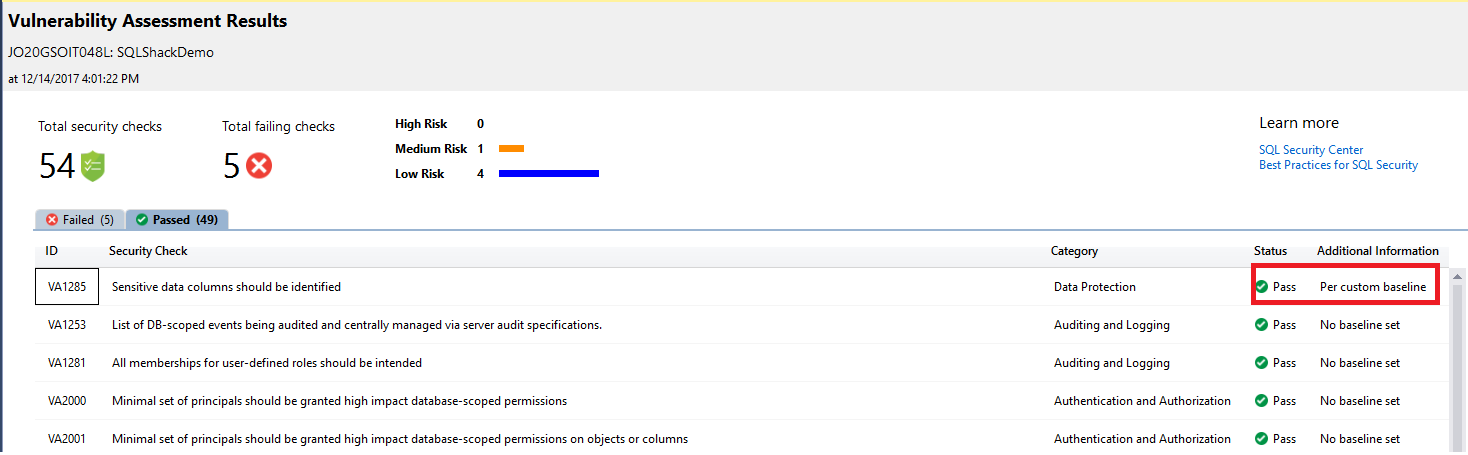
SQL Server Vulnerability Assessment scan report allows you to mark a specific result as being an acceptable customized baseline in your SQL Server instance. In this way, the generated scan report will measure the deviations from the baselines you specified and the results that will match the specified baseline will be considered as passed in the scanning process, as you can see in the report below:
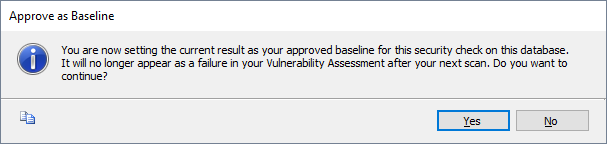
If you choose a specific check to be Approved as Baseline, the below message will be displayed to make sure that you choose that check as a baseline for your environment. Click Yes to confirm:
And the report will mention that you need to run a new scan to start taking the selected baseline in the consideration as shown in the message below:
Running a new scan to track the customized baseline rule, the report will display the checks that are performed based on its deviation from the approved baseline, as shown in the new scan result below:
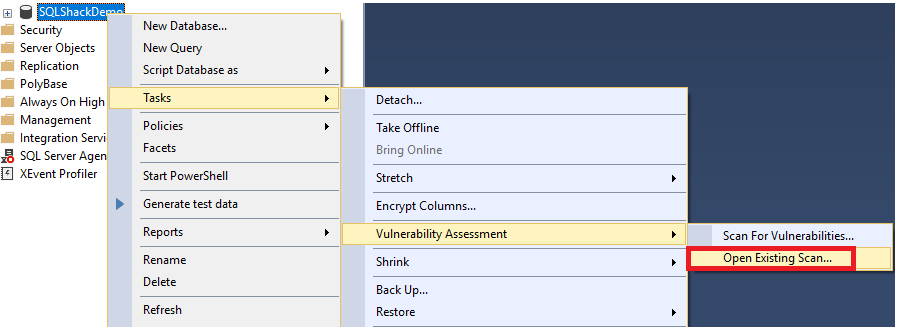
As mentioned previously, the scan result will be saved in a default or customized location. This helps you to view any previous Vulnerability Assessments scan results. Right-click on the database, choose Tasks and from the Vulnerability Assessment task select Open Existing Scan… as shown below:
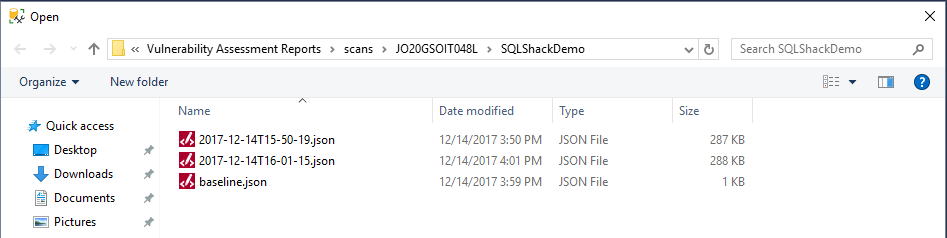
And from the opened scans directory, you can choose the Vulnerability Assessments scan result you want to view as below:
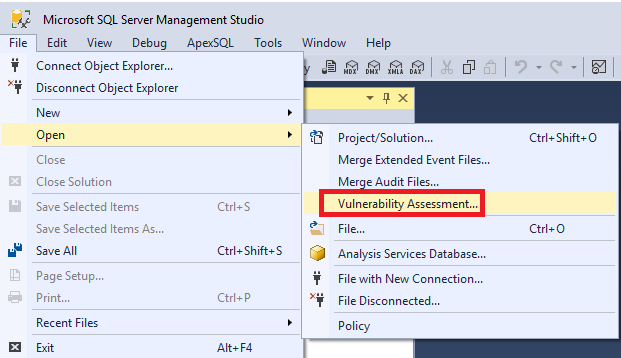
You can also view the old Vulnerability Assessments scan by choosing Open from the File menu. Then select Vulnerability Assessment… and from the opened scans directory you can choose the Vulnerability Assessments scan result you want to view as follows:
As you see from the previous results, the Vulnerability Assessments helps in monitoring database security state and maintaining it at a high level of security all the time, in addition to the ability to set your own baselines that fit your organization’s policies. It also provides you with useful security scan reports for the compliance process.
Previous articles in this series:
- What’s new in SQL Server Management Studio 17.2; Authentication methods, scripting options and more
- What’s new in SQL Server Management Studio 17.3; Import Flat File wizard and XEvent Profiler
Next articles in this series:
References
- SQL Vulnerability Assessment
- What’s new in SSMS 17.4: SQL Vulnerability Assessment
- Download SQL Server Management Studio (SSMS)
- SQL Server Management Studio – Changelog (SSMS)

He is a Microsoft Certified Solution Expert in Data Management and Analytics, Microsoft Certified Solution Associate in SQL Database Administration and Development, Azure Developer Associate and Microsoft Certified Trainer.
Also, he is contributing with his SQL tips in many blogs.
View all posts by Ahmad Yaseen
- Azure Data Factory Interview Questions and Answers - February 11, 2021
- How to monitor Azure Data Factory - January 15, 2021
- Using Source Control in Azure Data Factory - January 12, 2021