
Microsoft released many new features in Reporting Services with the SQL 2016 release.:
- New Report Portal
- Paginated Report Enhancements
- Mobile Report Publisher
New Report Portal
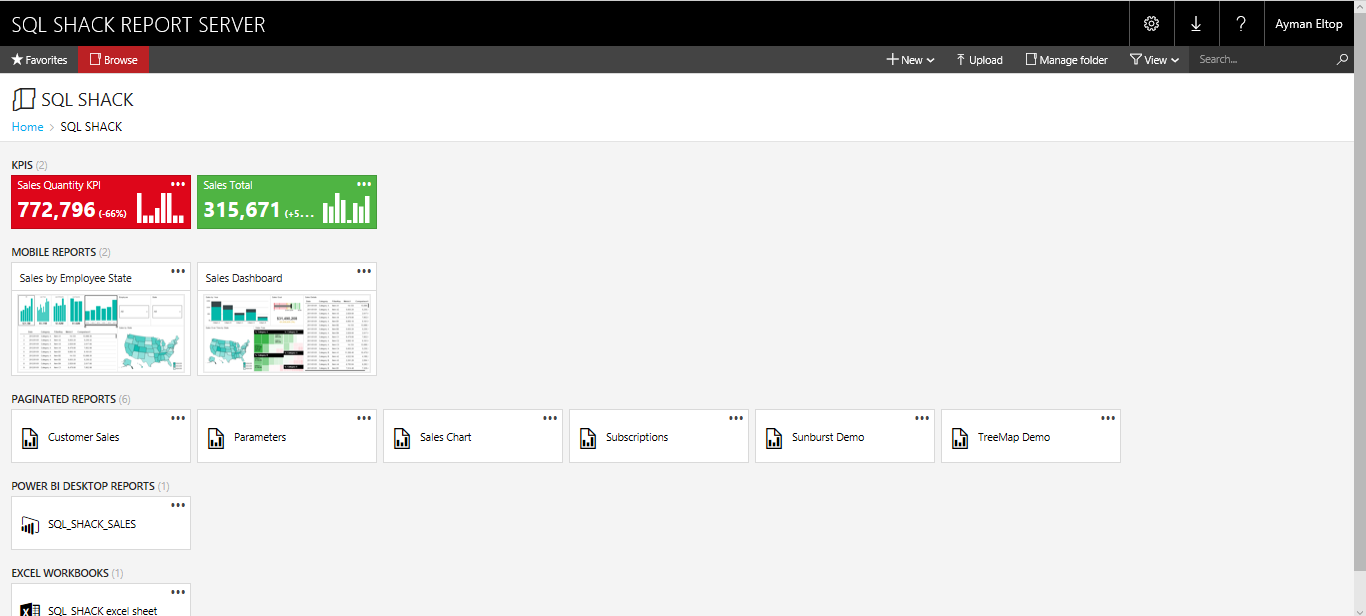
The first thing you will note with SQL Server 2016 Reporting Services is the Report Manager has had a complete facelift. It is not even the Report Manager anymore; it is now the Report Portal.
With the reinvention of the Report Portal, Microsoft took the opportunity to give it a nice, attractive-looking user interface, very modern and sleek as you can see in the following figure:
New Report Portal Features
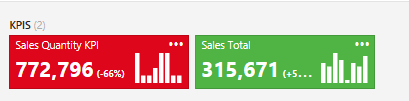
- KPIs in the Report Portal: With the new Report Portal in SQL Server 2016 comes the ability to display KPIs, or key performance indicators, directly within the Report Portal, also it’s quite easy to create a KPI on your Report Portal.

- Branding the Report Portal: Branding is the ability to customize a Report Portal for your company. We can add our corporate logo, as well as applying our company color scheme and you can see more details about how to implement your custom branding package in this link.
- New Subscription Features: in 2016 Microsoft has enhanced the subscriptions to be more easy to enable, disable our subscriptions and in the change as well
- HTML5-compliant: The Report Portal mow is totally HTML5-compliant as are all of the reporting types, such as the mobile reports or the paginated reports. This a big impact when it comes to Reporting Services in that it is now multi-browser. We can use not only Internet Explorer, but the new Edge browser, Chrome, Firefox, Opera, a whole variety of browsers can all be used to view your Reporting Services reports. And not just multi-browser, but multiplatform. Any platform that has a browser, which is HTML5 compliant, will be able to see and view your reports just like you design them. This means your reports are now accessible from a Mac machine running Safari, for example, or perhaps a Linux machine running Firefox.
You can see the list of all supported browsers in this link.
-
There are two new features coming with exporting reports: the first one you don’t need the special ActiveX controls for PDFs, instead it renders PDFs using the behind-the-scenes code but displays the PDFs using whatever the default PDF viewer is for the viewer’s operating system.
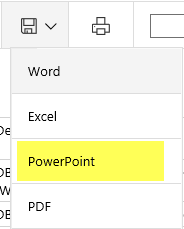
And the second feature is the ability to export your reports to PowerPoint.
-
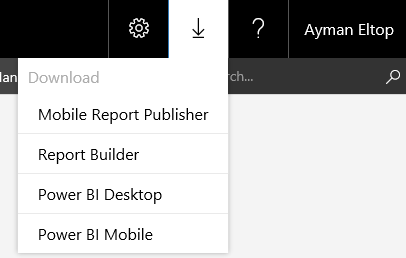
Download Mobile Report Publisher, Report Builder, Power BI Desktop, and Power BI Mobile from the web portal without the need of Microsoft deployment –ClickOnce- technology.
-
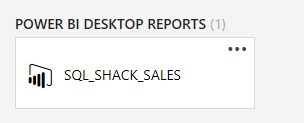
Upload your Power BI Desktop reports to your Report Portal which can be opened later on power BI desktop. Microsoft has publicly announced that in an upcoming release of SQL Server Reporting Services, Power BI Desktop reports will open up directly inside the Report Portal.
-
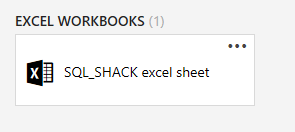
Upload Excel files and the Report portal understands that this is indeed Excel, and when you open it will download, and then open up this within Microsoft Excel, and allow you to save it back.
- Finally, there is a Resources area where You can upload any other file types like Word documents and PDFs.
Paginated Report Enhancements:
Microsoft has released several new features for use in paginated reports. Let’s dive in with them in the following points:
- Embedded Reports: With SQL Server 2016, Microsoft has made it extremely easy to embed Reporting Services mobile and paginated reports that are stored on the report server within other applications by using an iframe along with URL parameters.
Check out this link for more details - New Parameter Capabilities: This is one of the most exciting enhancements, that is concerning parameters. Specifically, parameters can now arrange at the discretion of the report developer. Yes, you now have control over how your parameters can order it within your reports
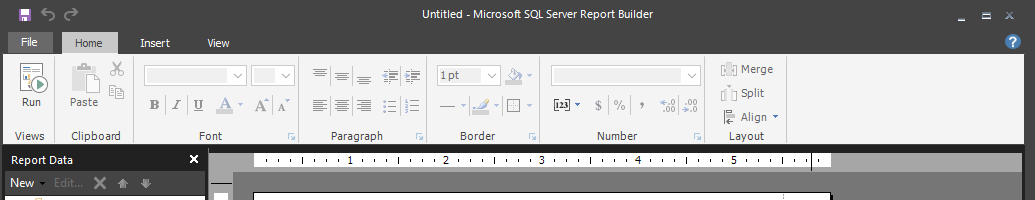
- New Report Builder User Interface: The Core Report Builder user interface is now a modern look and feels with streamlined UI elements.
- New two types of charts:
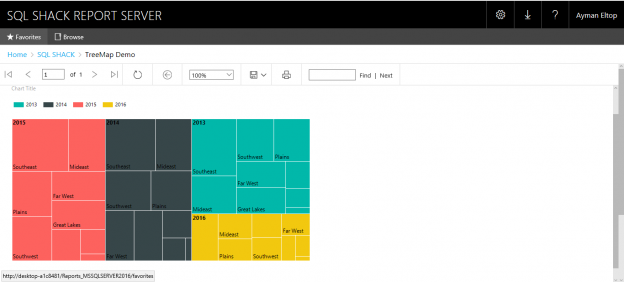
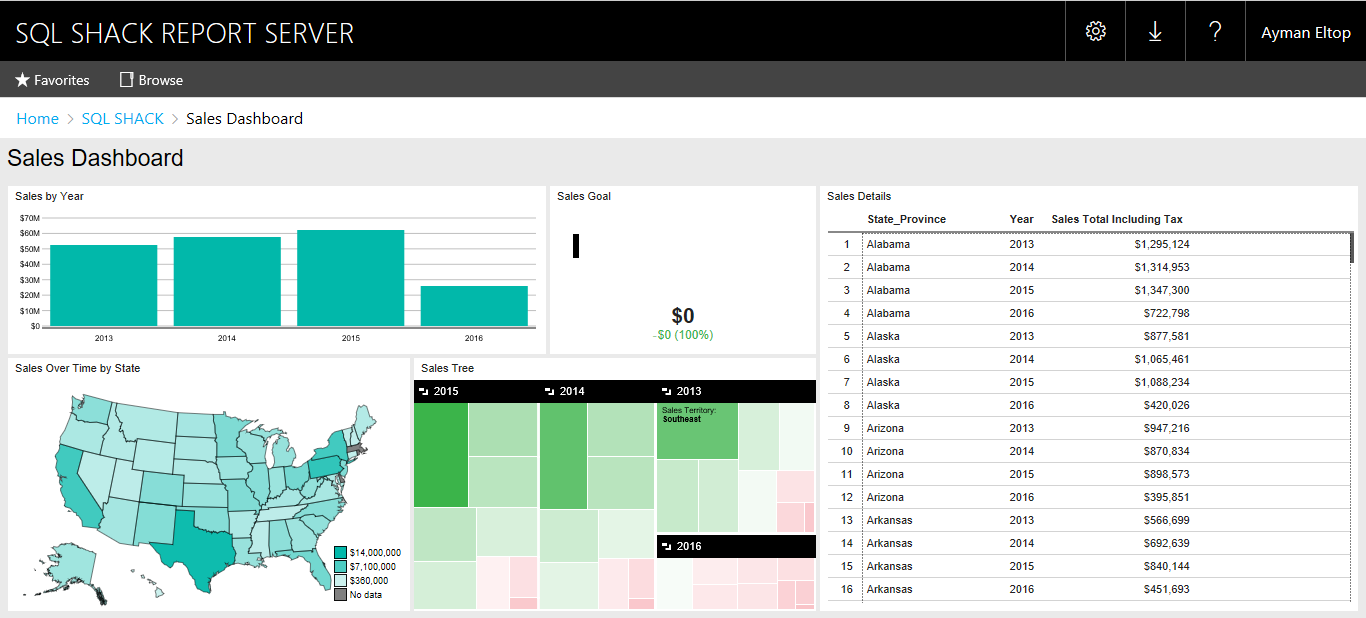
- Treemap Chart: With a treemap, the size of the block represents the size of the value. We then have larger squares, which in this case represent years, so I’ve got 2015 in pink, 2014 in gray, and so forth. The size of the large box represents the total in comparison to the others so that we can see 2013 takes up the smallest amount of space. Therefore its total was the smallest compared to by other areas. Now, within our bigger boxes, we are broken down into smaller boxes. As you can see 2015 has Southeast, Mideast, Plains, and so forth, and those represent the sales territory.
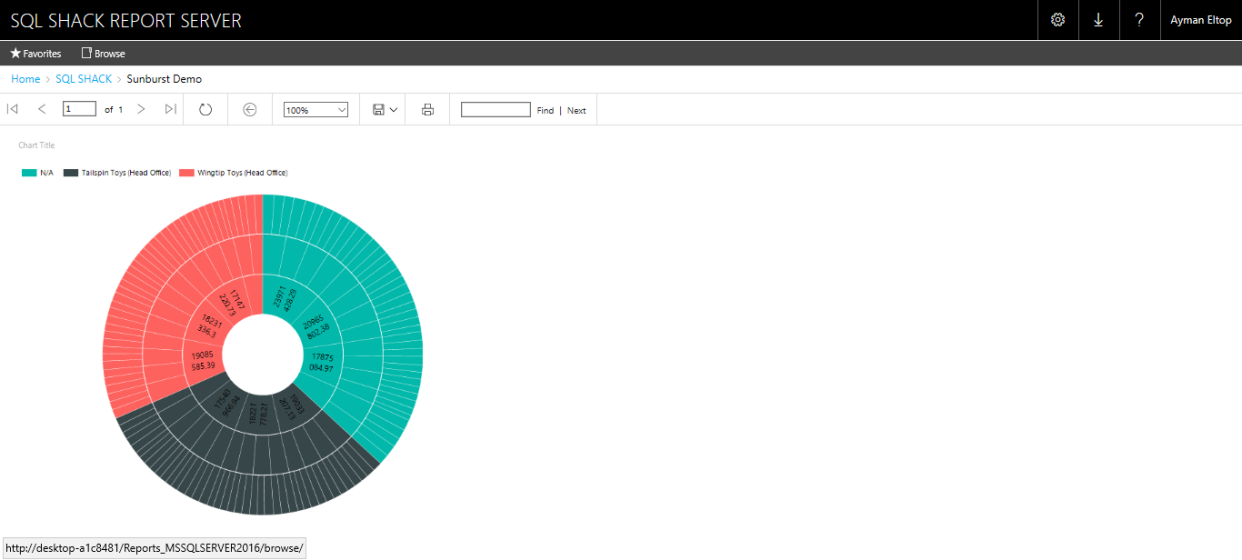
Figure 2 Treemap Chart report - Sunburst Chart: as you can see in figure 3, the sunburst is essentially a pie chart, but within each wedge of the pie we can break it down into smaller pieces along the lines of a hierarchy. As you can see here, each color represents a company. For each company I have broken it out by the Year, which is in the inner circle, the middle circle represents the Quarter, and the outermost circle represents the Month.
Figure 3 sunburst chart report


Mobile Report Publisher:
The new Mobile Report Publisher provides an easy way to design dashboards for use in your Reporting Services environment.
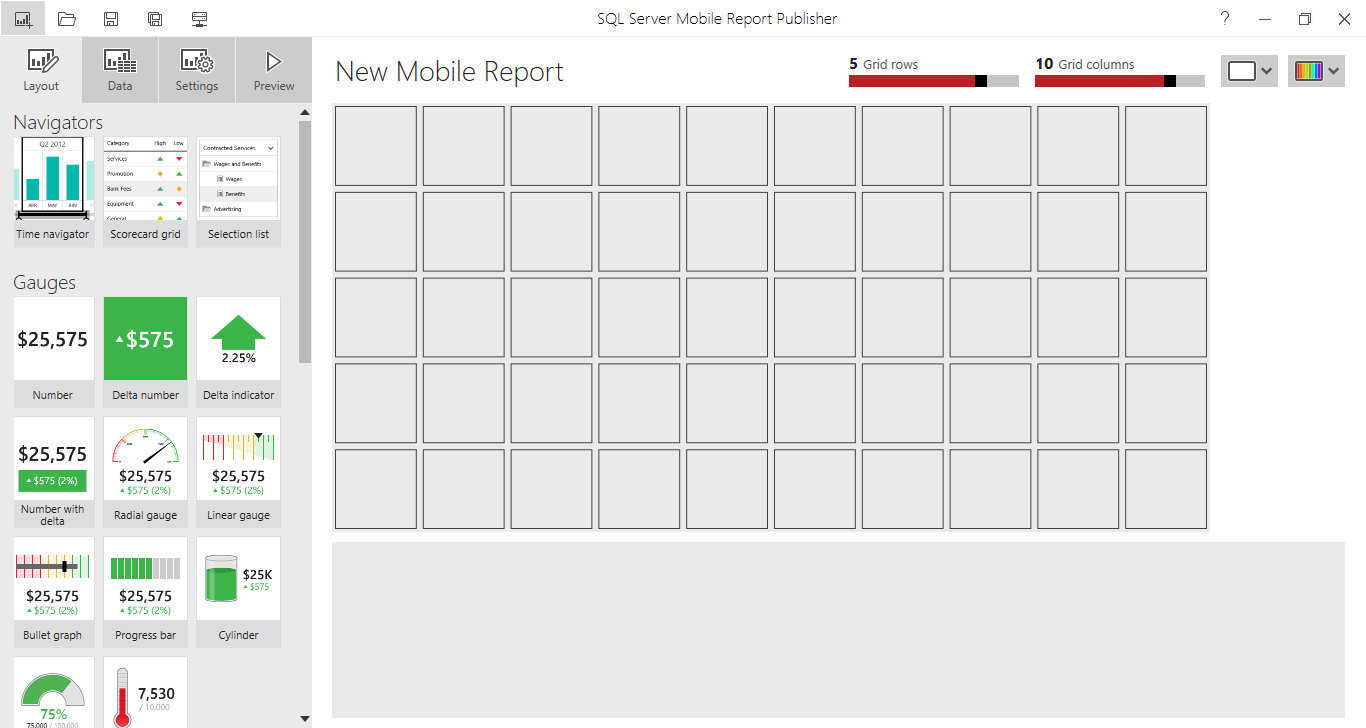
One of the nice things about the report publisher is it separates the data from the design. By that I mean that you can first design what you want the dashboard to look like, then you can import the data and marry it to the report. You could also go the reverse route. You can import your data first, then marry that data to the report elements that make the most sense for the display purposes. Also, the Report Publisher allows you to create layouts for multiple platforms. Of course, as you’d expect, you can create ones for the web as in the following figure,
You can also create layouts for tablets or phones. This is an important ability, in today’s world of connected devices, your business users are often using multiple platforms to access your reports.
Conclusion
I believe that Microsoft SQL Server 2016 reporting services are going to be the most used BI tool from now and ever with all of these continuously updates.
In this article, I talked simply about all new features introduced by Microsoft, and I encourage you to keep hands-on this tool. I hope this article has been informative for you.
References
- What’s new in SQL Server Reporting Services (SSRS)
- Top 3 Reasons to upgrade to SQL Server 2016 Reporting Services
- Browser Support for Reporting Services and Power View

His mission is to create or participate in solutions that make daily life easy and comfortable by using technology.
You can contact him on DEV.Mohamed_Osman@Outlook.com
- What’s new in SQL Server 2016 Reporting Services (SSRS) - March 29, 2017