

Introduction
Troubleshooting using Wait Stats in SQL Server is an important perspective when it comes to managing databases. As a database professional, you might have come across situations, where your end-users are not happy with reports being slower. It will leave you to find the reason for the report slowness.
Now you are in the state of a doctor. A patient has come to you and complaining about his flu. As a doctor, you know that flu, is not an illness but it is a symptom. It might be just the viral flu, or it might be due to a bad tooth or it might be because of some other serious issues. Being a doctor, you will start asking questions and if needed after some medical tests, you may diagnose the cause and provide the necessary treatments accordingly.
Being a database administrator, you too have a similar role to play. You will be given the symptoms of issues such as slowness of reports. Then you have the huge responsibility of finding the root cause. Though report slowness can be due to the report query itself, you cannot discount the fact that it can be a memory, CPU, etc. Even the report slowness can be due to another process that is blocking the processing of the report. Now you will realize the difficulties that you will face during the troubleshooting incidents. This article helps you understand troubleshooting using wait stats in SQL Server.
SQL Server as a Mini OS
SQL Server is a mini operating system that deals with multiple concurrent users for different operations. To support these multiple users and provide concurrency, SQL Server uses a three-node mechanism. These three nodes are named Running, Runnable, and Suspended as detailed below.
- Running – a query that is being executed on a CPU is called a running query. This query is responsible for CPU time
- Runnable – a query which is ready to execute and waiting for its turn to run is called a runnable query. This is a Queue where operates on a First-in-First-out basis
- Suspended – a query which is waiting due to any reason to be converted to runnable is a suspended query. This query is responsible for the wait time
The following diagram shows the logical diagram for these nodes.
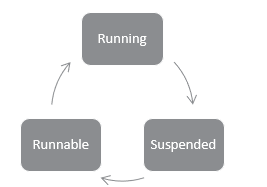
If you have multiple cores, you will have an equal number of above units.
Let us see how these nodes will work. Let us say process ID 60 started to execute and it will receive at Running as shown below.
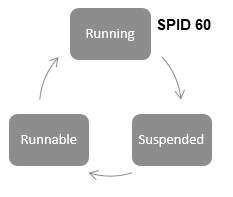
Due to some reason, if it needs further resources, it will move to the Suspended node and a new process (ID 78) can be received at the Running.
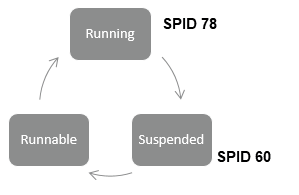
After some time, you will see this node configuration as follows.
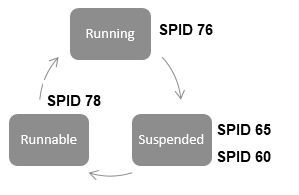
In the above Nodes, we will see that though the SPID 78 is received to Suspended node after the SPID 60, as and when required resources are available, SPID 78 is moved to the Runnable.
Suspended List
You will see that problems for your queries are on the suspended list. So, by analyzing the Suspended list, you can understand what are the reasons for the delay and how long it is delayed. By querying sys.dm_os_waiting_tasks DMV, you can identify what are details of process ID, Wait Type, Duration, if it is blocked by another process what is the blocked process. These are the primitive details that you need for Troubleshooting Using Wait Stats in SQL Server.
Apart from the sys.dm_os_waiting_tasks DMV, there are other DMVs sys.dm_exec_sessions, sys.dm_exec_requests, sys.dm_exec_sql_text, and sys.dm_exec_query_plan that can be used retrieve the query and execution plan that is the suspended list.
Following is the query that will give you the list processes that are in the suspended list alone with a few other details such as query plan, query, program that is executing the process.
|
1 2 3 4 5 6 7 8 9 10 11 12 13 14 15 16 17 18 19 20 21 22 |
SELECT owt.session_id, owt.exec_context_id, owt.wait_duration_ms, owt.wait_type, owt.blocking_session_id, owt.resource_description, est.text, es.program_name, eqp.query_plan, es.cpu_time, es.memory_usage FROM sys.dm_os_waiting_tasks owt INNER JOIN sys.dm_exec_sessions es ON owt.session_id = es.session_id INNER JOIN sys.dm_exec_requests er ON es.session_id = er.session_id OUTER APPLY sys.dm_exec_sql_text (er.sql_handle) est OUTER APPLY sys.dm_exec_query_plan (er.plan_handle) eqp WHERE es.is_user_process = 1 ORDER BY owt.session_id, owt.exec_context_id |
Please note that the above query can be executed in any environment and in any conditions in a SQL Server during a troubleshooting event. Further, the above query will list only the user queries and internal processes are ignored.
Troubleshooting Example
Let us look at an example of Troubleshooting Using Wait Stats in SQL Server as shown in the below figure. This dataset is taken from a real-world scenario to demonstrate Troubleshooting using wait stat in SQL Server.
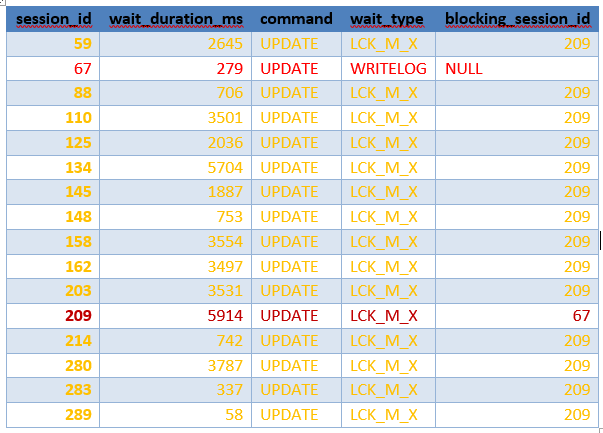
If you look at the above list, you will see most of the processes are blocked by, process id 209 as indicated in the blocking_session_id column. If you look at session Id 209, you will see that process 209 is blocked by session-id 67. When further examined the process id 67, you will see that process id 67 is not blocked by any other process. This means process 67 is the root cause of all the processes.
After identifying the root cause, the next step of the Troubleshooting in Wait Stats in SQL Server is to identify the reason for the issue. You will see that the wait type is WRITELOG. Write log means there is a delay in writing to the log file.
When this is further analyzed it was identified that, in the given database both data and log files in the same drive. In the case of SQL Server, the first data is written to the log file and then the data is written to the data file via CHECKPOINT operation. When both files are in the same drive, there will be contention in writing as indicated in the above result. The obvious action was to move the database log file to a different drive. After moving the log file to a different drive, the problem was solved.
If you look at the above problem, slowness is due to the log file and nothing to do with the query. If you are spending time tuning the queries and other resources, then you are wasting the time. Therefore, troubleshooting Using Wait Stats in SQL Server is an important option that should be in the hands of database administrators.
Other Wait Types
During the troubleshooting using Wait Stats in SQL Server, we need to know what are the common wait types in order to take proper actions. Further, we need to know what are the actions you should not take.
|
Wait Types |
Reason |
Actions |
Avoid |
|
CXPACKET |
Parallel processing |
1. Most of the time this is due to not the existence of proper indexes. 2.Examine the query plan of the query. 3.Read more details at CXPACKT. |
Do not avoid parallelism. |
|
ASYNC_NETWORK_IO |
SQL Server is waiting for a client to acknowledge receipt of sent data. |
Re-write the application code |
By looking at the name, you might think that it is something to do with the network. |
|
BACKUPBUFFER BACKUPIO BACKUPTHREAD |
During the database backup, these types of wait types will occur. |
Most likely these types of wait types indicate, slowness of in backup disk. |
If it is a large database, you need to leave this until the backup is completed. |
|
PAGEIOLATCH_SH PAGEIOLATCH_EX |
Waiting for a data file page to be read from disk to memory. |
Need to analyze what tables are having the issue. |
Nothing to do with the IO subsystem. |
Though the above table has very limited, the most common wait types, there are a lot of wait types that will come across in your environment during Troubleshooting using wait stats in SQL Server. This list can be found at SQL Server wait types page.
Conclusion
Troubleshooting is not a science but an art. In this article, we looked at Troubleshooting using Wait Stat in SQL Server. In this technique, we have identified the issues by analyzing the wait stats. By examining the wait type, you can take the necessary actions accordingly to overcome the issues. Due to easy analysis of the troubleshooting using wait stats, you can start the troubleshooting using this method as this running the above query will not have an impact on the system.

View all posts by Dinesh Asanka
- Testing Type 2 Slowly Changing Dimensions in a Data Warehouse - May 30, 2022
- Incremental Data Extraction for ETL using Database Snapshots - January 10, 2022
- Use Replication to improve the ETL process in SQL Server - November 4, 2021