

In this article, we will explore, how we can increase SQL Server performance with the help of the wait statistics. Wait statistics are one of the most important indicators to identify performance issues in SQL Server. When we want to troubleshoot any performance issue, at first we need to diagnose the problem correctly because correctly diagnosing problems help with half of the solution. Now, let’s learn wait statistics which helps to identify performance issues properly.
What is the wait time in SQL Server?
SQL Server Operating System (SQLOS) is an application layer that provides communication between the operating system and SQL Server. The main responsibility of the SQLOS is to perform memory, I/O, CPU management. SQL Server uses worker threads to complete the submitted requests and are scheduled on CPU by SQLOS and then carry out their tasks. These worker threads can exist in three different states when they are fulfilling the assigned tasks according to resource availability. These are:
- Running status indicates that the scheduled thread is currently being processed by the CPU
- Suspended status indicates that the assigned thread is waiting for a resource to be available. Such as, if any thread wants to access a data page that acquires an exclusive lock, it waits in the suspended status until the exclusive lock is removed and then it can access the page
- Runnable status indicates that the thread is not waiting for any resources, but the CPU still unable to process this task because it is dealing with another task
In light of this information, wait time can be described as the elapsed time until the worker thread suspended status returns to the running status.
What is SQL Server wait statistics?
The wait times are captured and recorded by the SQL Server and all this captured information called wait statistics and it provides assistance to resolve problems that are related to the SQL Server performance.
The sys.dm_os_wait_stats dynamic management view can be used to obtain information about the wait type details. This view holds cumulative statistics about the wait types until the database engine restarted or the wait statistics cleared. When we query the sys.dm_os_wait_stats, the following columns will return:
- wait_type column represents the name of the wait type
- waiting_tasks_count column indicates how many times the wait type has occurred
- wait_time_ms column indicates the total elapsed time the thread waited according to the wait type defined in the wait_type column
- max_wait_time_ms shows the maximum elapsed time the thread waited according to the wait type defined in the wait_type column
- signal_wait_time_ms represents the total time that the thread waits on the runnable queue
wait_time_ms column indicates the sum of the time it spends in runnable and suspended queues. When we want to calculate only the resource wait time, the below formula will help us:
Resource wait = (wait_time_ms) – (signal_wait_time_ms)
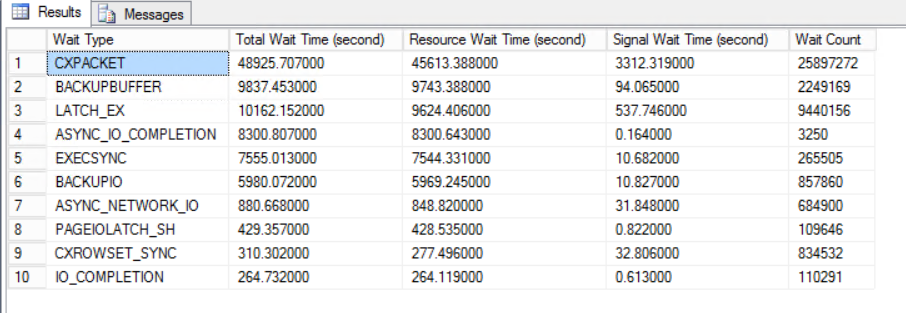
The following query will return the top 10 wait types and sorts them in ascending order by waiting time.
- Tip: We can ignore some wait types because these wait types are related to the internal management of SQL Server so we don’t need to consider these wait types
|
1 2 3 4 5 6 7 8 9 10 11 12 13 14 15 16 17 18 19 20 21 22 23 24 25 26 27 28 29 30 31 32 33 34 35 36 37 38 39 |
SELECT TOP 10 wait_type AS [Wait Type], wait_time_ms/1000.0 AS [Total Wait Time (second)], (wait_time_ms-signal_wait_time_ms)/1000.0 AS [Resource Wait Time (second)], signal_wait_time_ms/1000.0 AS [Signal Wait Time (second)], waiting_tasks_count AS [Wait Count] FROM sys.dm_os_wait_stats WHERE wait_type NOT IN (N'CLR_SEMAPHORE', N'LAZYWRITER_SLEEP', N'RESOURCE_QUEUE', N'SQLTRACE_BUFFER_FLUSH', N'SLEEP_TASK', N'SLEEP_SYSTEMTASK', N'WAITFOR', N'HADR_FILESTREAM_IOMGR_IOCOMPLETION', N'CHECKPOINT_QUEUE', N'REQUEST_FOR_DEADLOCK_SEARCH', N'XE_TIMER_EVENT', N'XE_DISPATCHER_JOIN', N'LOGMGR_QUEUE', N'FT_IFTS_SCHEDULER_IDLE_WAIT', N'BROKER_TASK_STOP', N'CLR_MANUAL_EVENT', N'CLR_AUTO_EVENT', N'DISPATCHER_QUEUE_SEMAPHORE', N'TRACEWRITE', N'XE_DISPATCHER_WAIT', N'BROKER_TO_FLUSH', N'BROKER_EVENTHANDLER', N'FT_IFTSHC_MUTEX', N'SQLTRACE_INCREMENTAL_FLUSH_SLEEP', N'DIRTY_PAGE_POLL', N'SP_SERVER_DIAGNOSTICS_SLEEP') ORDER BY wait_time_ms-signal_wait_time_ms DESC; |
Interpreting the wait types
Unfortunately, we have no chance to know which wait type indicates which SQL Server performance issue because they are so many. For this reason, we can search the particular wait types on the web or use the following wait type’s dictionaries that give comprehensive information:
However, some wait types might occur very commonly in the SQL Server instances, therefore, it will be beneficial to know the common wait types.
SOS_SCHEDULER_YIELD
As we mentioned, SQLOS accomplishes the CPU management for SQL Server. SQLOS allows the thread to be processed by the CPU at a quantum time. If the processing of the thread is not completed and all the resources are available state for this thread, SQLOS moves the thread to the runnable queue and it begins to wait for reprocessing. SOS_SCHEDULER_YIELD wait type is captured and recorded when the thread is waiting in the runnable queue. This wait type shows a CPU pressure but it should be evaluated with two other indicators. The first one is the sys.dm_os_tasks view, this dynamic management view gives compressive information about the active tasks in the SQL Server. With the help of this view, we can monitor how many threads wait in the runnable status and if this value reaches the big numbers during the day, we have to suspect a CPU pressure.
|
1 2 3 4 |
SELECT scheduler_id, session_id, task_state FROM sys.dm_os_tasks WHERE task_state IN ('RUNNABLE') and session_id > 50 |
Another indicator that we can use with SOS_SCHEDULER_YIELD is the signal_wait_time_ms column of the sys.dm_os_wait_stats view. As we stated, this value indicates the time which spends in the runnable queue for a thread. As a result, if we monitor the following metrics, we need to suspect about CPU pressure:
- If the SOS_SCHEDULER_YIELD wait type is listed in the top list of the resource wait statistics query
- If a lot of tasks are monitored in the runnable status
- If the signal wait time is higher than 35% of the total resource waits
- If the System\% Processor Queue Length counter of the Perfmon represents greater than 3 per CPU
- If the Processor(_Total)\%Processor Time counter of the Perfmon indicates greater 80 percentage or greater values
To handle this wait the following recommendation can be potential solutions:
- Identify and optimize the queries which consume high CPU
- Adding more CPU
- Schedule the index maintains plans on the non-peak times
- Ensure to have enough CPU resource when using the Page compression algorithms
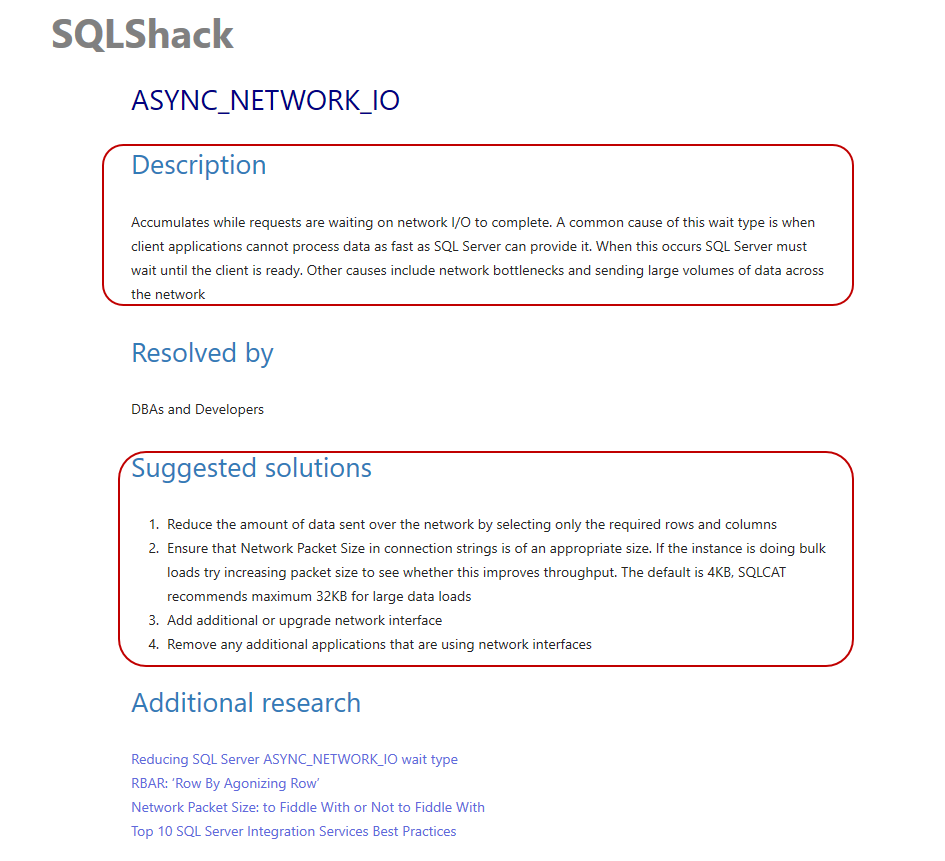
ASYNC_NETWORK_IO
The ASYNC_NETWORK_IO indicates two main bottlenecks that are related to the network and the network problems affect SQL Server performance negatively. The first one is that the application requests a huge result set but the application cannot handle the result set as fast as SQL Server due to some reasons. The second one can be related to network infrastructure. The following suggestions may be the solution to this issue:
- Review the applications and try to reduce the requested amount of data
- Check the network capacities that are between client machines and SQL Server (Routers, switches, NIC, cables, etc.)
- Validate the server NIC configurations and ensure the last driver is installed
- Consider increasing the packet size property in the connection string if you are planning to send or receive a large amount of XML or blob data.
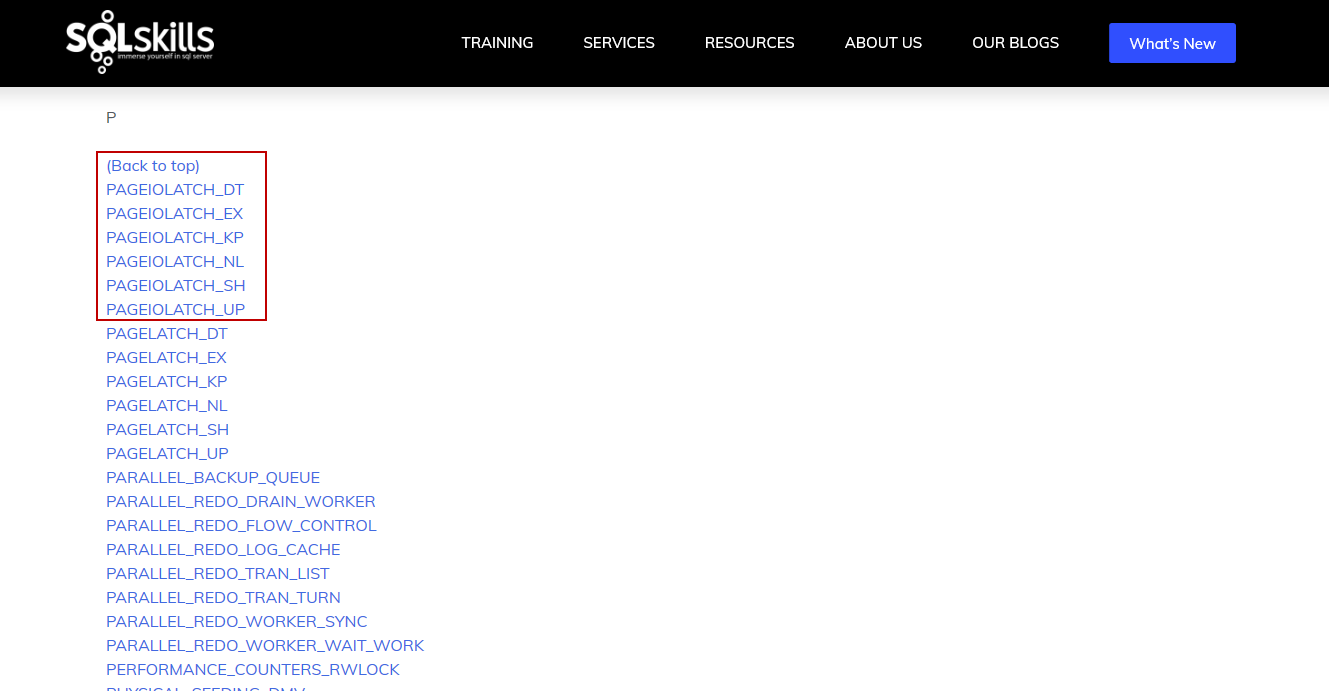
PAGEIOLATCH
SQL Server uses a reserved memory area that is called a buffer pool and it is used to cache data and index pages. The main idea behind this working principle to as possible as to reduce the disk activity and improving the SQL Server performance. SQL Server must read indexes and data pages from the disk before transferring to the buffer pool. PAGEIOLATCH wait type captures when the data pages fetch from the disk into the buffer pool. Most often time PAGEIOLATCH wait type indicates I/O problems related to the storage subsystems or memory pressure.
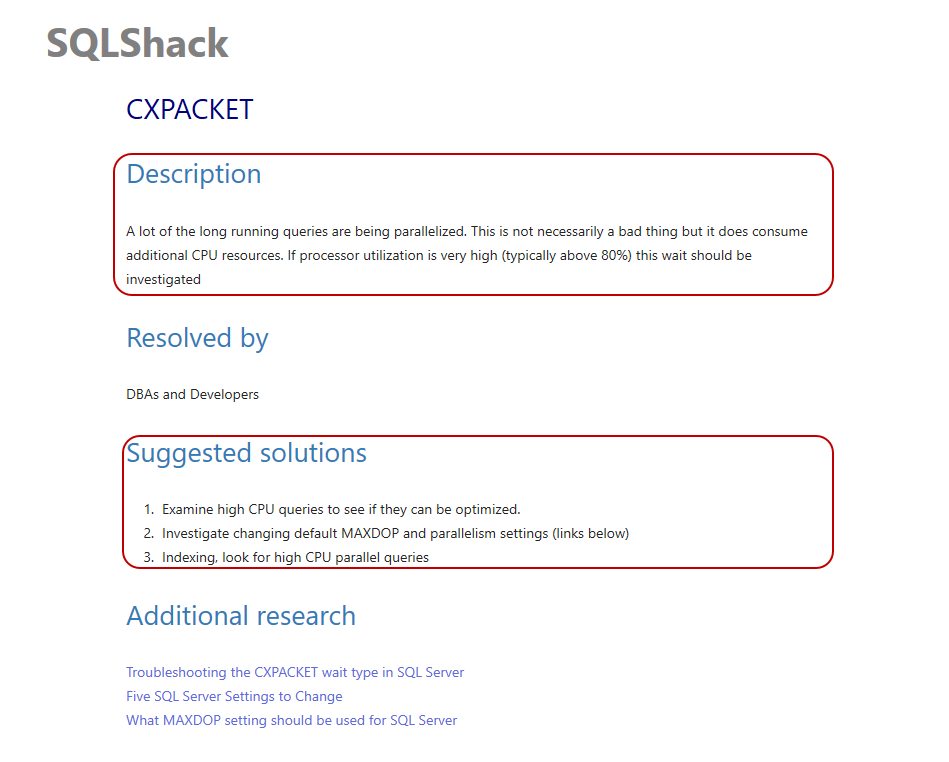
CXPACKET
When the SQL Server query optimizer decides to execute a query in parallel, it tries to divide the query operation into equal-sized threads as possible. CXPACKET wait type indicates the time that spends to execute a parallel query. This wait type does not indicate any problem and can be ignored and it improves SQL Server performance. On the other hand, all threads cannot carry out their task exactly the same time, and the query execution time can be as fast as the slowest thread. When this thread’s synchronization problem reaches the unacceptable amount (greater than 50% of total waits), we have to take into account this wait type as a problem. Possible reasons may be as follows:
- Outdated statistics
- Missing or fragmented indexes
- Insufficient memory
- CPU pressure
- Cardinality Estimator version
- Improper configured Maximum degree of parallelism (MAXDOP) option
- Improper configured Cost threshold for parallelism option
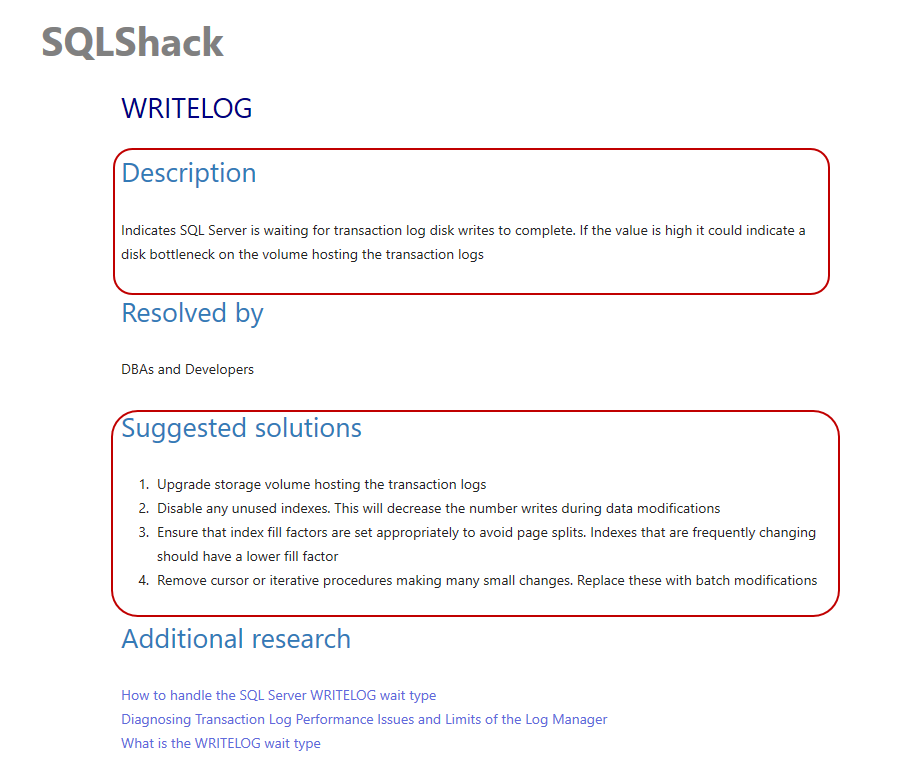
WRITELOG
SQL Server writes all modifications to the Log Buffer and its size is limited to 60KB. When Log Buffer fills up, the log records are written into the disk and this mechanism is called Log Buffer Flush. WRITELOG wait type indicates the elapsed time when the log records writing into the disk. The possible causes can be as below:
- Locate the data files (mdf,ndf) and log files (ldf) into the separated disks
- Increase the I/O capacity of the disk where the log file is placed
- Consider using the Delayed Transaction Durability option of the SQL Server
- Avoid the cursor which makes iterative modifications
- Reducing the size of the log file
Conclusion
In this article, we learned how to boost SQL Server performance through the wait statistics. Wait statistics are the main metrics that help to monitor and diagnose the performance problems of the SQL Server.

Most of his career has been focused on SQL Server Database Administration and Development. His current interests are in database administration and Business Intelligence. You can find him on LinkedIn.
View all posts by Esat Erkec
- SQL Performance Tuning tips for newbies - April 15, 2024
- SQL Unit Testing reference guide for beginners - August 11, 2023
- SQL Cheat Sheet for Newbies - February 21, 2023