When maintaining SQL Server, it is essential to get an accurate perception of how busy it is. Two metrics that are often considered as indicators of how busy SQL Server is are Batch Requests/sec and Transaction/sec. When those metrics trend higher, they often affect all other metrics and make them go higher as well. While they could look similar, they are using a different type of starting point for measurement; the batches and transactions. So, to correctly understand those important metrics, lets first try to understand what the batches and transactions in SQL Server are and what are the differences between the two
SQL Server statement batches
When executing multiple SQL Server statements as a group of statements, or when executing a single SQL statement that consists of a group of multiple SQL statements, it is considered as a SQL Server batch. That practically means that the result is returned after the entire batch statement executes. The advantage of such approach is that execution is more efficient compared to executing each containing statement independently. One aspect of better efficiency lies in the fact that network traffic is reduced in most cases, the second aspect is that targeted data source can often optimize execution of the statements in a SQL Server batch
Some facts about SQL batches:
- A SQL batch is, in its essence, a collection of various SQL statements put together to be executed without a guarantee that it will either succeed or fail
- SQL batches ensures creation of a single query execution plan
- Variables created within a batch cannot be used outside of the batch
- Multiple batches that work with multiple objects can be folded within a single transaction block, though they are not allowed to violate execution plans of the individual batches
- Multiple transactions can be folded in a single SQL batch, which has the advantage of granting the integrity of SQL Server objects (tables for example)
SQL Server Open Database Connectivity (ODBC) API supports three types of batches
Explicit batches – this is when two or more SQL statements are combined in the single batch script and separated by semicolons (;)
|
1 2 3 4 5 6 7 8 9 10 |
INSERT INTO Storage (StorageID, CountyID, OpenDate, MercahanPerson, Status) VALUES (9301, 1001, {fn CURDATE()}, 'Tod', 'CLOSED'); INSERT INTO Loops (LoopId, Line, TransID, Quantity) VALUES (135, 1, 124, 103); INSERT INTO Loops (LoopId, Line, TransID, Quantity) VALUES (135, 2, 98, 78); INSERT INTO Loops (LoopId, Line, TransID, Quantity) VALUES (207, 3, 589, 167); INSERT INTO Loops (LoopId, Line, TransID, Quantity) VALUES (207, 4, 412, 120) |
All statements in the previous batch example are separated with the semicolon (highlighted) except the last statement in the batch
Stored procedures – every stored procedure that contains more than one SQL statement is considered by SQL Server as a batch of included SQL statements. The difference here is that the stored procedure contains the statements that are specific to SQL Server. Stored procedures do not use semicolons for separating statements. It is because the SQL Server specific CREATE PROCEDURE statement handles the statements within the stored procedure and therefore it does not need statement separators
|
1 2 3 4 5 |
CREATE PROCEDURE Test (@TestID INT) AS SELECT * FROM Test WHERE TestID = @PartID SELECT LoopID FROM Loops WHERE TestID = @PartID AND State = 'DAMAGED' |
It is important to understand that the CREATE PROCEDURE statement itself is not a batch statement, but the resulting procedure executes as a batch of SQL statements that it contains. So when executing the Test stored procedure from the example above, the two SELECT SQL statements will be executed as a batch of SQL statements
Arrays of parameters – When parametrized statements are used by the application, having an array of parameters is an effective way of to perform the execution of a single statement multiple times as a batch execution
|
1 |
INSERT INTO Test (TestID, Description, TimeElapsed, TimeCompleted) VALUES (?, ?, ? , ?) |
In the above example, using question marks (?) or the properly called parameter marker means that they are bound to application variables. So, when application provides parameters to the SQL statement, it allows inserting multiple rows of data in a single execution. For data sources that do not support arrays of parameters, the ODBC driver can emulate the arrays thus passing the set by set of values to the statement. In that case, the statement executes as a batch of individual statements for each set of values
SQL Transaction
A SQL transaction is a SQL Server unit of work performed on a SQL database. Each SQL Server transaction consists of multiple operations, where each operation can consist of multiple SQL statements, executed in a specified order. The main characteristic of SQL transaction is that it can be either fully completed or completely failed. So, when a SQL transaction starts, it starts with executing the first SQL Statement in a transaction, and it can complete with all SQL Statements contained within transaction committed or if any of the SQL Statements fails, the complete SQL transaction changes are rolled back (all changes made on the SQL Server are undone). SQL Server transactions must fully comply with SQL Server atomicity, consistency, isolation and durability (ACID) concept, established to ensure database data integrity. The SQL Server ACID concept considers that each and every transaction has to comply with those four requirements:
- Atomicity – once started a transaction must be fully completed. Otherwise, it won’t be executed at all
- Consistency – a transaction can create a new and completely valid state in a database or in case of any failure, it must roll back any data change to the original state before the transaction started
- Isolation – a transaction that is stated and is not yet completed, has to be completely isolated from all other running transactions
- Durability – data committed after the transaction completion must remain permanently stored in SQL Server even in case of a system failure or restart
At its elemental level, a SQL Server transaction is essentially the SQL batch with a “cancel with rollback” option
SQL Server supports the following transaction modes:
- Autocommit transactions – Default mode where every individual SQL statement is treated as a transaction and committed automatically when execution.
- Explicit transactions – This mode is active when a transaction is started by explicitly placing the BEGIN TRANSACTION statement at the beginning and then at the end transaction is explicitly completed with a COMMIT or ROLLBACK statement.
- Implicit transactions – In implicit transaction mode SQL Server starts a new transaction automatically after the previous transaction completes (commits or rollbacks) thus generating a continuous transactions chain. Although there is no need to define the transaction start explicitly, the transaction has to be completed explicitly with a COMMIT or ROLLBACK statement.
- Batch-scoped transactions – This mode is applicable only to SQL Server Multiple Active Result Sets (MARS) feature, designed to permits multiple batches to be executed using a single SQL connection. Also, an explicit or Implicit transaction that is under a MARS session SQL Server treats as a batch-scoped transaction. Also, SQL Server rolls back automatically not committed or rolled back batch-scoped transactions.
Both, SQL transactions and SQL batches are more complex concepts with lots of variations, but this is all that needs to be known about the SQL batch/transaction implementation concepts to correctly understand the batches/sec and transactions/sec metrics and the rest of the article.
Now, let’s focus on the metrics itself.
Batch Requests/sec metric
The Batch Requests/sec (in some literature referred as Batch Requests per Second) metric is SQL Server performance that provides information about the number of SQL batches SQL Server received in one second. For a DBA that knows their server well, this is probably the first metric to look for when slow query execution issue is reported. However, the Batch Requests/sec metric itself should not be looked in isolation from other metrics. It is important to track and put in correlation the CPU and I/O performance to get the correct and comprehensive insight of how the SQL Server is performing. The metric itself is not something that is a direct representation of an issue, and there are few things to understand before jumping to a conclusion:
Batch Requests/sec value is high – the tricky part here is to determine what the high value of this metric is. The ability of the SQL Server to process SQL statements depends on hardware factors such as CPU, I/O, memory, etc., but also on the “software” factors such as the design of stored procedures, tables, and indexes. Therefore, it is essential to look at this metric holistically and determine/know what number of SQL statements SQL Server is capable of processing on a regular basis without affecting the performance. That magical number could be 500, 2,000, 5,000, 10,000 or even more, but the DBA must know that number to understand and interpret the metric.
The metric value doesn’t mean anything by itself. Having high Batches Requests/sec values is a good thing as long as the server performance is not affected. What’s more, the goal of any SQL Server design is to accomplish the highest possible Batch Requests/sec while maintaining the resources such as CPU, I/O or Memory to an acceptable level, meaning that SQL Server is well optimized. To illustrate this with an example: having 5,000 Batches Requests/sec measured on SQL Server means nothing unless the DBA knows that the value during the normal day is 500.
Having said that, it is vital not to jump into conclusion that something wrong happens just because the Batch Requests/sec value is “high”. To summarize:
- Having 5,000 Batch Requests/sec when the usual normal value, that doesn’t affect performance, is around that number would be a good thing
- Having 5,000 Batch Requests/sec when the normal value, that doesn’t affect performance, is 500 could be potentially a bad thing if SQL Server cannot sustain 5,000 Batch Requests/sec without affecting performance. So, if users reported that the application is working slow and Batch Requests/sec is higher than usual, it could mean that application slowness could be a consequence of system being forced to deal with 10 time more queries than usual. In that case, it is expected that other metrics are also out of their usual boundaries since this metric is one of the metrics that affect all other metrics
- Batch Requests/sec value is low – everything already mentioned for the “high” metric values is valid here as well, with one exception – the low value is not something that is necessarily good by default. For most performance metrics a valid assumption is that the lower is, the better, but in case of Batch Requests/sec, such an assumption doesn’t stand. Low values of Batch Requests/ sec could mean that your system is bottlenecked with something that does not allow SQL Server to utilize its full potential. Having 400 Batch Requests/sec in a system that is capable of withstanding 3,000 means that there could be some piece of code, for example, that is not adequately optimized and thus affecting the throughput of the whole system.
Another important point when monitoring Batch Requests/sec is that regardless of how many statements contained in a single SQL batch are executed, the Batch Request/Sec registers that as a single batch and adds the value of 1. So, if we have a situation where three complex stored procedures with multiple statements each are executed simultaneously, the value for Batch Requests/sec will be 3, regardless of how many statements those three procedures executed. Therefore, for SQL Servers that are based on significant and complex SQL batches, Batch Requests/sec metric is probably not the best way to determining how busy SQL Server is
The Batch Requests/sec metric is part of the SQLServer:SQL Statistics (MSSQL$<Instance_Name>:SQL Statistics for a named instance) performance object
To monitor this counter, open performance monitor (PerfMon) and click on the Add counters button. In the Add counters dialog, locate the SQLServer:SQL Statistics performance object and expand it
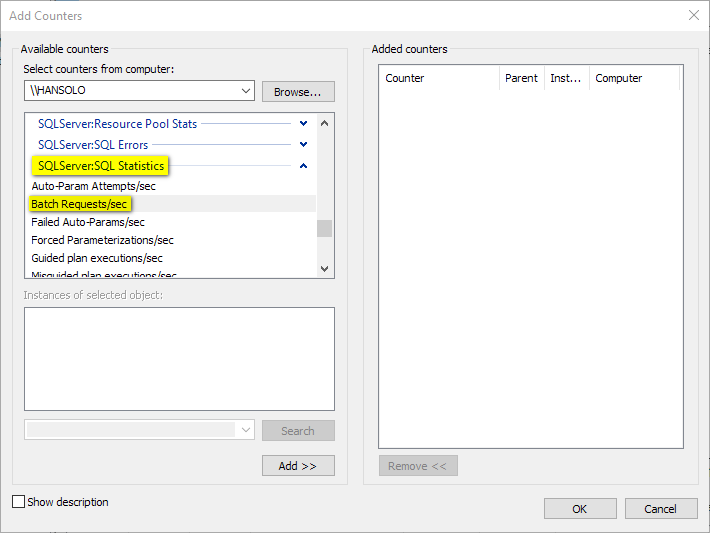
Locate the Batch Requests/sec metric and add it for monitoring
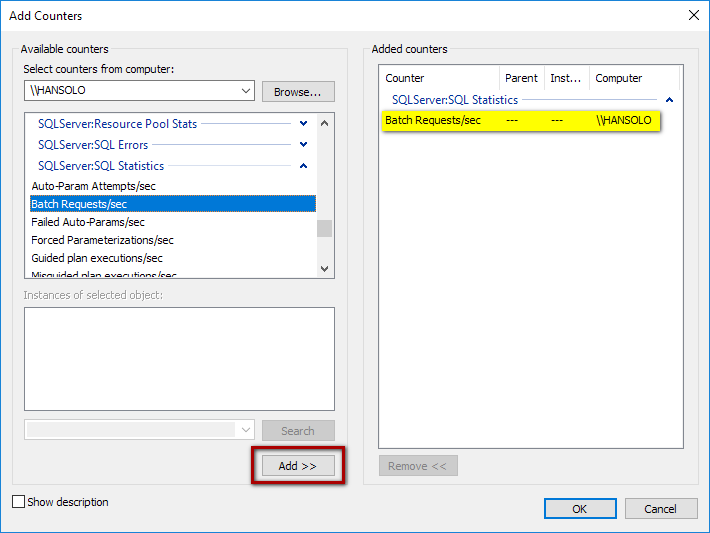
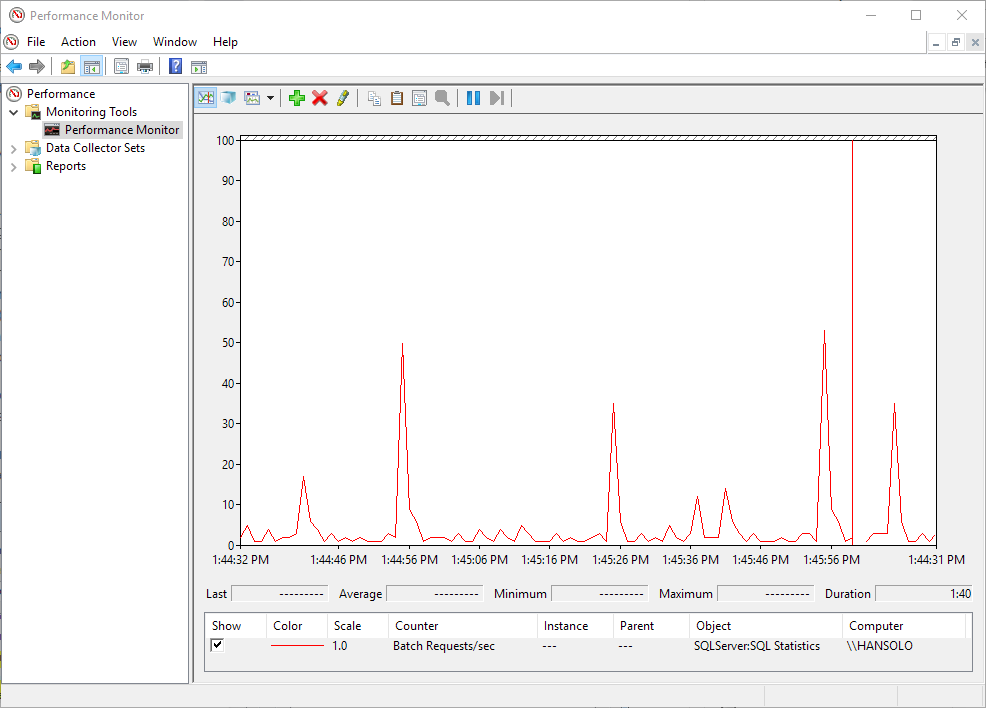
After the OK button is pressed, Batch Requests/sec monitoring starts
Transactions/sec performance metric
The Transactions/sec (in some literature referred as Transactions per Second) performance metric is a database level metric designed to track down SQL Server statements folded inside a SQL transaction. All explicit transactions (statement explicitly started BEGIN TRAN) as well as all implicit transactions INSERT/UPDATE/SELECT) in SQL Server are treated as a transaction, and the transactions/sec metric will log all transactions except some related to row versioning and in-memory tables. While the Transactions/sec metric is officially measurement of transactions started for the particular database, but the way it is counted if a bit different and the metric value depends on another two factors: metric reading frequency and duration of the transaction. To explain that more precisely, it practically means that if the metric reading frequency is 1 second and the transaction running for 10 seconds, the metric will return the value of 10. Therefore, it means that the metric can count the single transaction multiple time if transaction duration is longer than the period of metric reading. Transaction per second is the so-called calculated metric, as SQL Server cumulatively counts SQL transactions, and the value is a difference between the last and the precious reading divided with the period of reading
Transactions/sec= (Last transaction number – Previous transaction number)/Number of seconds between two readings
When transferred into numbers:
Last transaction number = 1000
Previous transaction number = 500
Number of seconds between two readings = 5
Transactions/sec= (1000-500)/5 = 100
The number of SQL Server transactions depend significantly on global system performance but also on some system resources such as a number of connected users, the system I/O capacity, available memory cache, and statements complexity.
Transactions/sec metric is not one of those where determining that value is too high or too low is possible using some rule of thumb. The value that this metric return is of a relative nature, which mean that proper interpretation of the metric value would be a “(much) higher than yesterday or last week” or a “(much) lower than yesterday or last week.”. Having a high value of the Transactions/sec metric is only an indication SQL Server activity amount, not necessarily an indication of a problem. So, the best practice in monitoring this metric is establishing the baseline that could then be used to determine when the metric have oddly high or low values
The Transactions/sec metric is part of the SQLServer:Databases (MSSQL$<Instance_Name>:Databases for a named instance) performance object
To monitor this counter, open performance monitor (PerfMon) and click on the Add counters button.
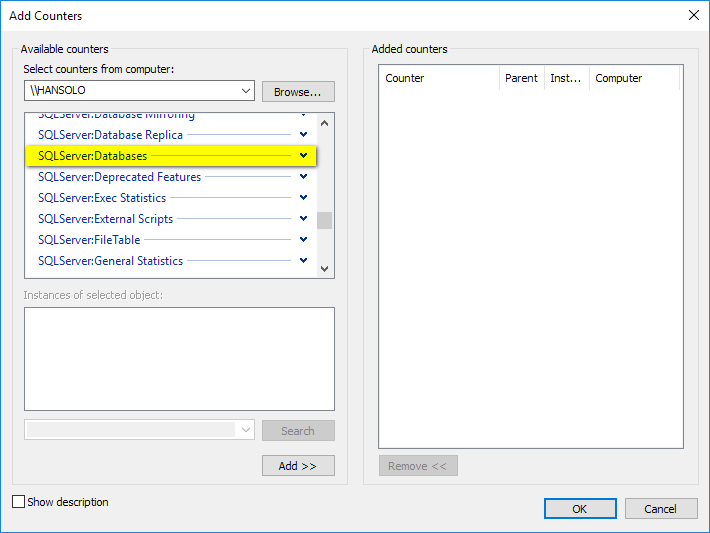
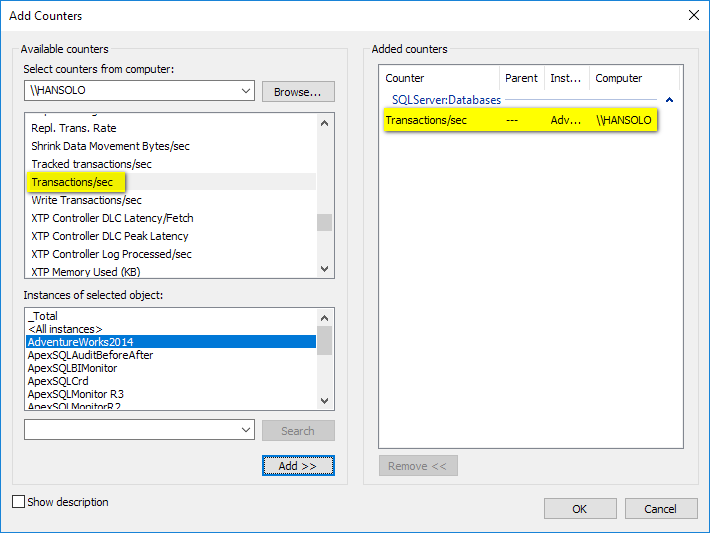
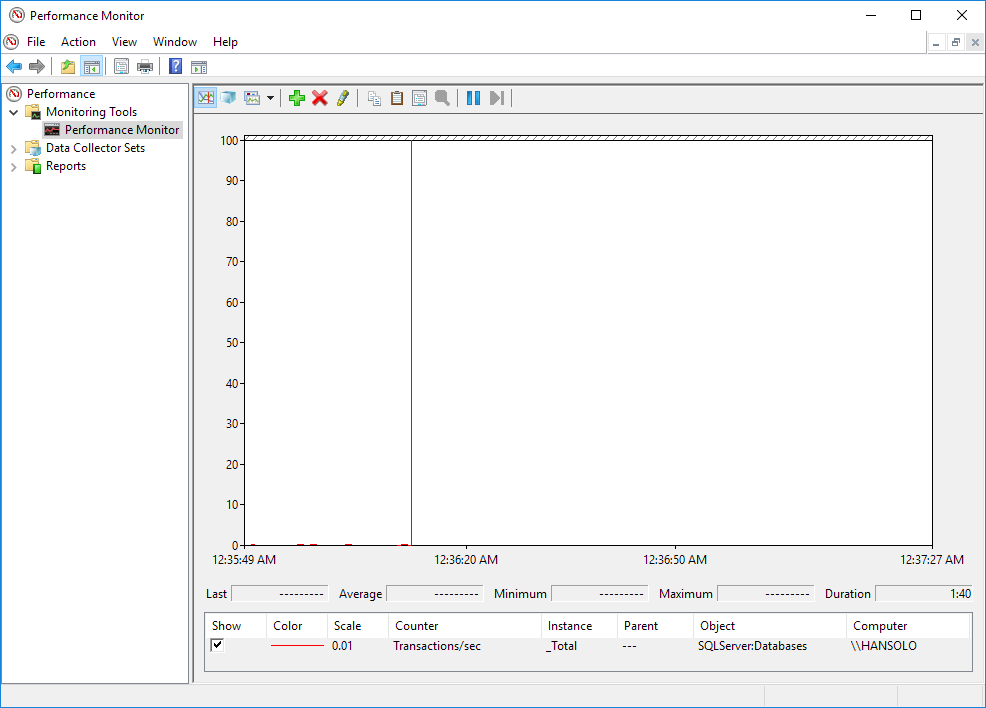
In the Add counters dialog, locate the SQLServer:Databases performance object and expand it. Locate the Transactions/sec metric, then select the database instance to be measured and then add the metric for monitoring
Batch Requests/sec vs. Transactions/sec
When it comes to maintaining SQL Server, it is essential for a DBA to know what the amount of throughput that the SQL Server is capable of processing. More precisely, what number of SQL queries and SQL transactions can the SQL Server process. While both metrics are essential indicators of SQL Server workload (amount of work that SQL Server performs), they are often misinterpreted due to insufficient knowledge of the very essence of metrics. As most database-related metrics do not see a many of stuff that occurs on SQL Server, Transactions/sec is no exemption.
Most experienced DBAs first instinct is to inspect the Batch Request/sec metric as a primary indicator of the workload, and that is not by accident. The Batch Requests/sec is a preferred metric as it can, in most cases, provide more reliable information about the SQL Server workload. All squares are parallelograms, but not all parallelograms are squares; a similar analogy could be established for those two metrics as much higher number of statements qualifies as batches than as transactions. Because of that, Transactions/sec has a “blind spot,” and that will be elaborated with a practical example
To demonstrate this, perform a test using a few simple queries and Performance monitor:
Use the AdventureWorks database for this demonstration
Start the Performance Monitor and add Batch Requests/sec and Transactions/sec (for AdventureWorks database) metrics
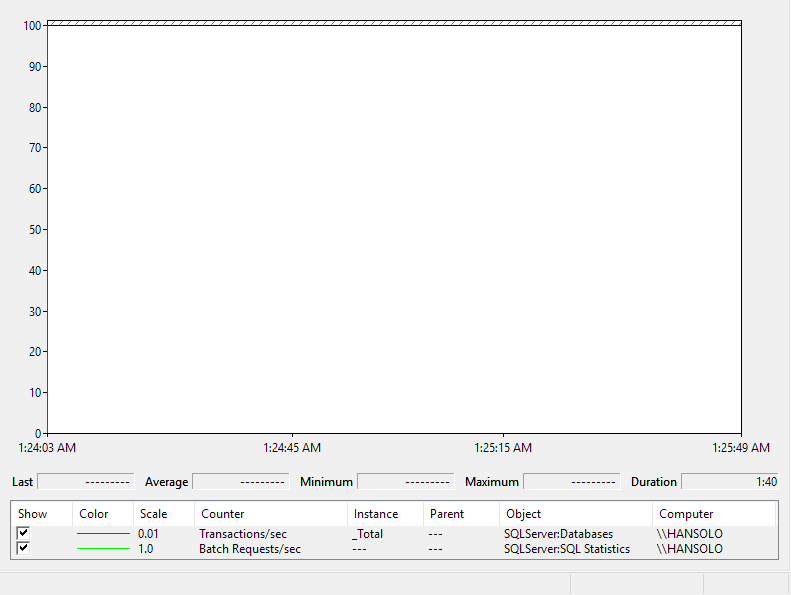
Run SQL Server Management Studio (SSMS) and connect to SQL Server. Open the new query tab and set the query context to AdventureWorks database. Use the query below
|
1 2 3 4 |
BEGIN TRANSACTION SELECT Name FROM [HumanResources].[Shift] COMMIT |
The query must repeatedly be executed for sometimes, and the easiest way to do that is to execute the query in SQL Server Management Studio by pressing the F5 (function taster on a keyboard) and keep it pressed for some time.
Let’s take a look at Performance Monitor
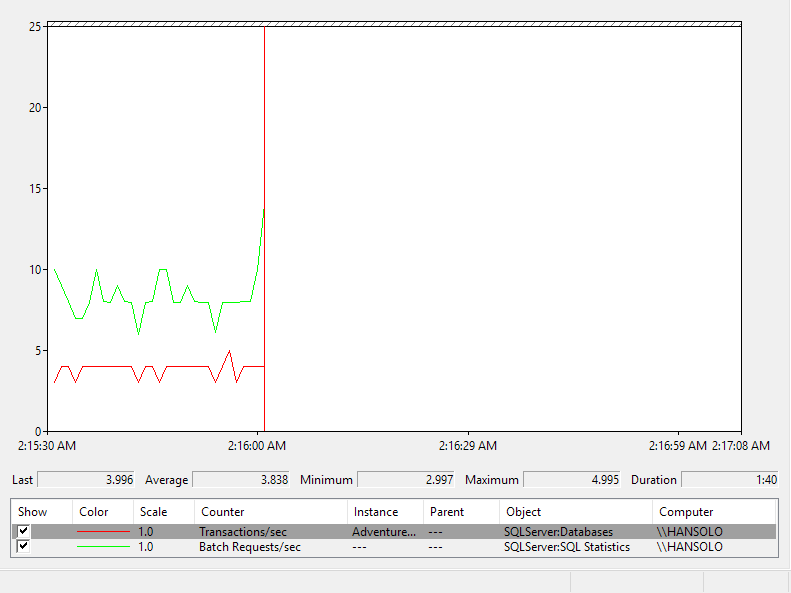
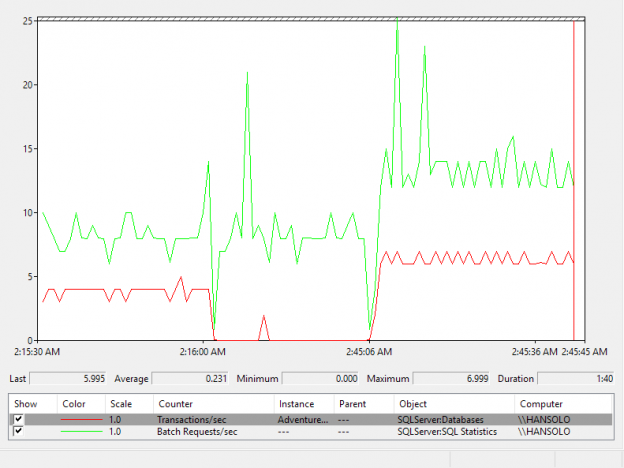
As it can be seen, the Transactions/sec line pretty much follows the Batch Requests/sec line during the test, which means that both metrics can register this kind of statement, as it can be seen, the Batch Requests/sec metric can see and monitor when the explicit transactions are executed
Let’s execute in the same way the same statement but now not explicitly wrapped in a transaction
|
1 2 3 |
SELECT * FROM [HumanResources].[Shift] GO |
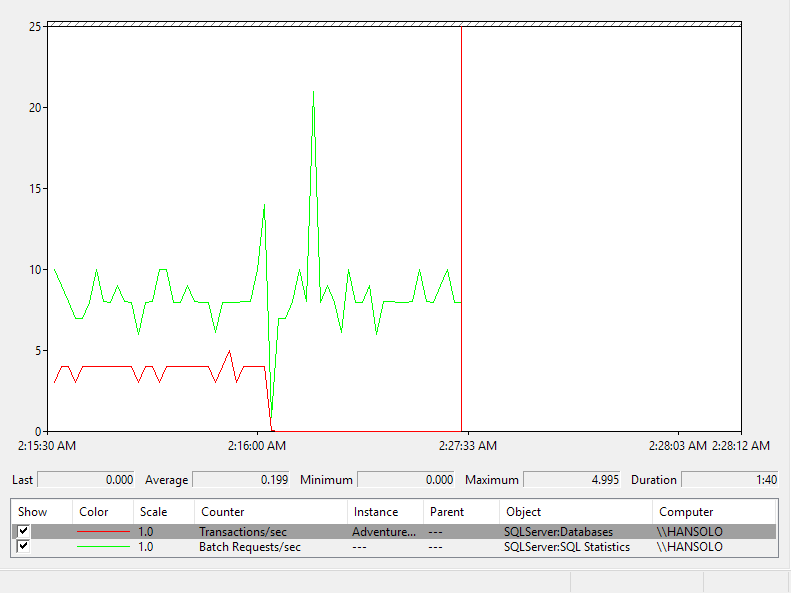
Now, what can be seen in Performance Monitor? From the image above, it is apparent that the Batch Requests/sec metric rises to ~10, and even spiked to above 20, while the Transaction/sec counter went down to 0 and stayed there all the time. Naturally, it is because the executed statement qualifies as a batch, but does not qualify as a transaction, hence causing that the Transactions/sec metric cannot register when that kind of work occurs in SQL Server
It is the evident blind spot that Transactions/sec metric has.
However, what happens when DML statement is not explicitly wrapped in the transaction. Let’s execute such a DML statement to see what we can expect
|
1 2 |
UPDATE [HumanResources].[Shift] set ModifiedDate = '2008-04-30 00:00:00.000' GO |
Execute the statement by holding the F5 function button for some time
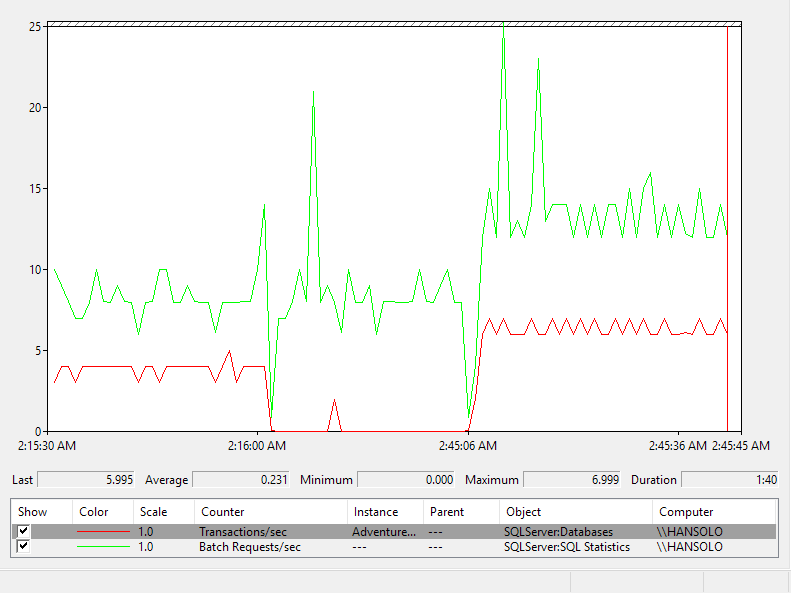
Again, the Transactions/sec metrics resembles and follows the Batch Requests/sec metric. It is because DML statements such as INSERT, UPDATE and DELETE operate in the context of the transaction by default, thus no need to wrap it in the explicit transaction via BEGIN TRAN/COMMIT statement pair
Conclusion
While both metrics are the first general stop for DBAs when checking the amount of work SQL Server are dealing with, Batch Requests/sec is generally considered a more reliable metric. It is not perfect as already explained, but as demonstrated, it can see more than the Transactions/sec metric.
Since Batch Requests/sec has, by far, fewer blind spots compared to Transactions/sec, it should be the first one to look at. However, the full power of troubleshooting lies in knowing well ones own SQL Server in the first place. Then wisely use those two metrics in a combination to eliminate as many blind spots as possible, and, in that way, as much complete the picture of how busy SQL Server is as completely as possible. That could be a winning approach to understanding whether the numbers behind those metrics are something that negatively affects your SQL Server.
- SQL Server trace flags guide; from -1 to 840 - March 4, 2019
- How to handle the SQL Server WRITELOG wait type - June 13, 2018
- SQL Server performance counters (Batch Requests/sec or Transactions/sec): what to monitor and why - June 5, 2018

