
Introduction
I recently heard from a lady from overseas who wanted to find a quick and dirty mechanism of extracting data for a given date range (based upon a fiscal year that started July 1st and ended June 30th). The idea interested me and as always, I had to try it out.
In today’s “get together”, we are going to have a look at how this may be achieved.
This said, let’s get started.
Getting Started
Whether you are on the business intelligence side or an application developer, most of the fancy coding for data extraction occurs within the “stored procedure”. We are going to create a stored procedure called “SQLShackFiscalFiscalYear”.
Opening SQL Server Management Studio we open a new query.
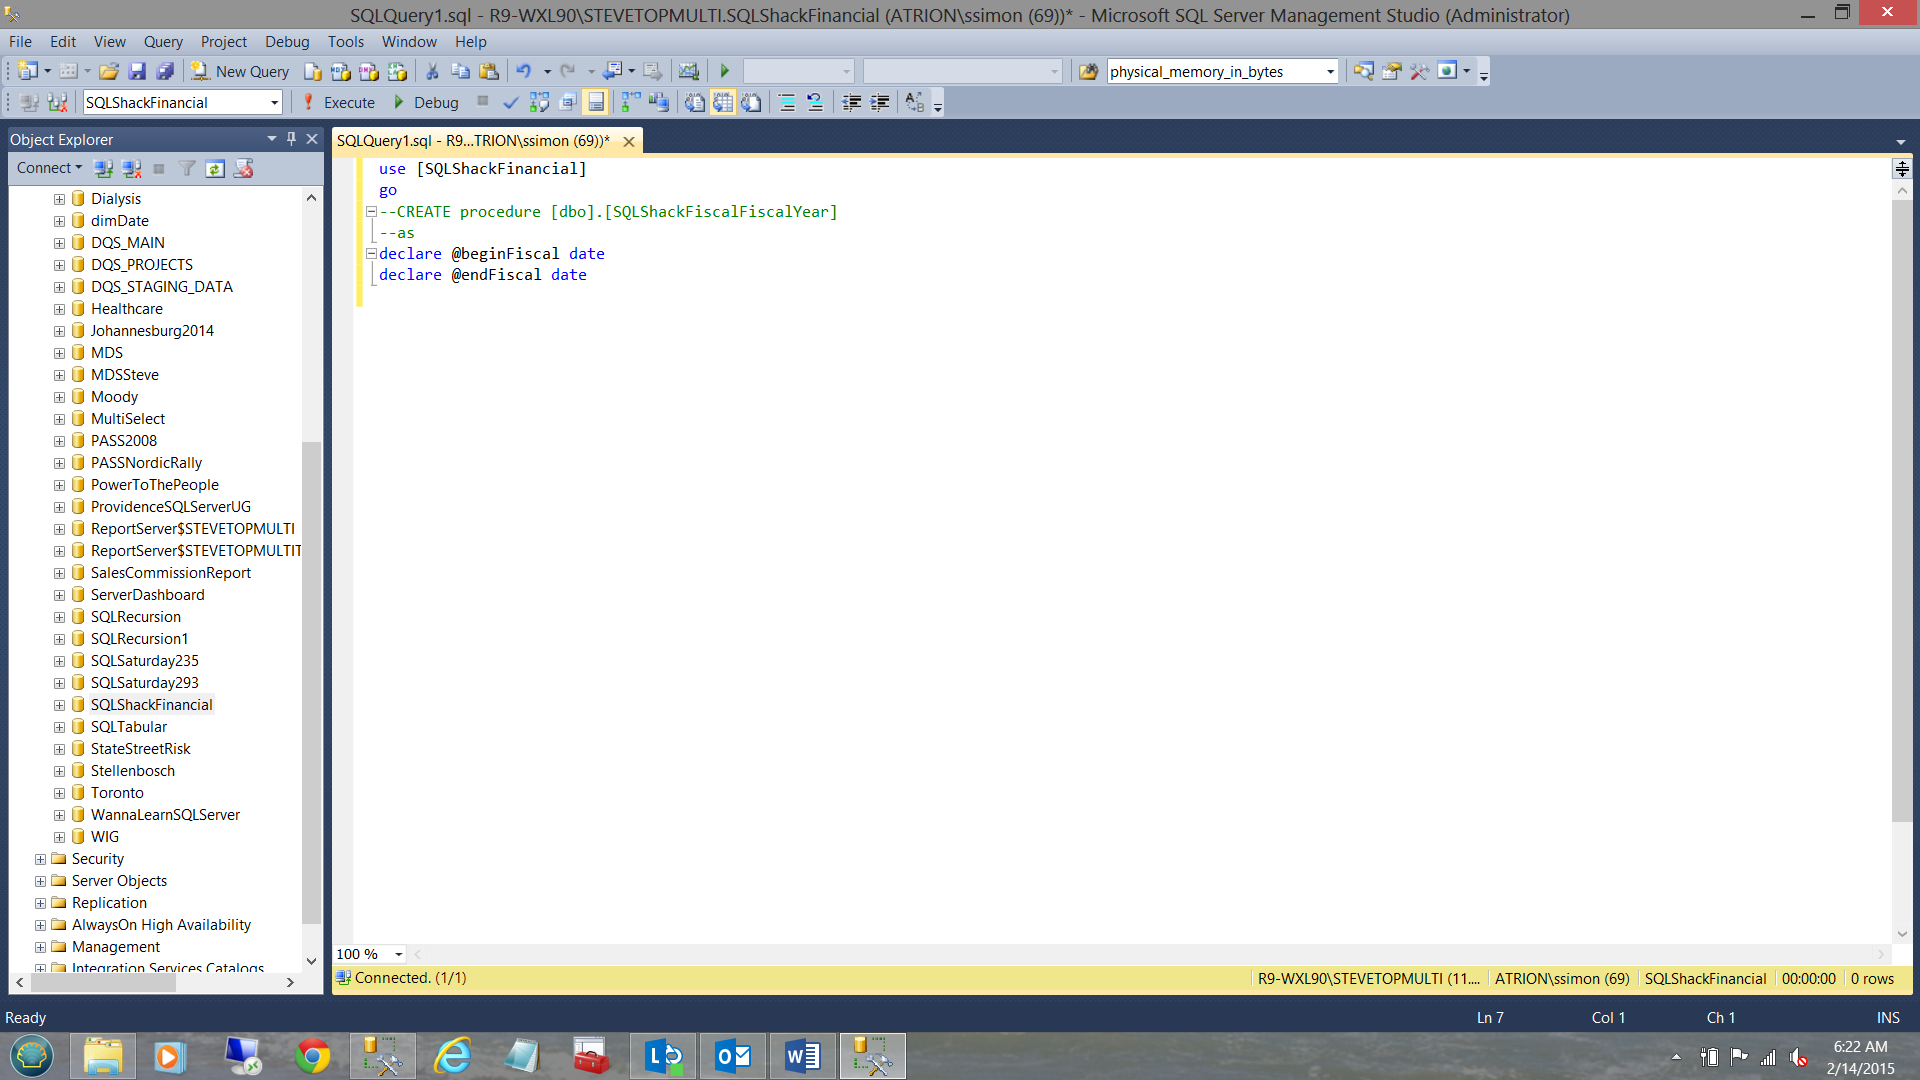
We begin by creating two variables called @beginfiscal and @endfiscal, defined a DATE (see above).
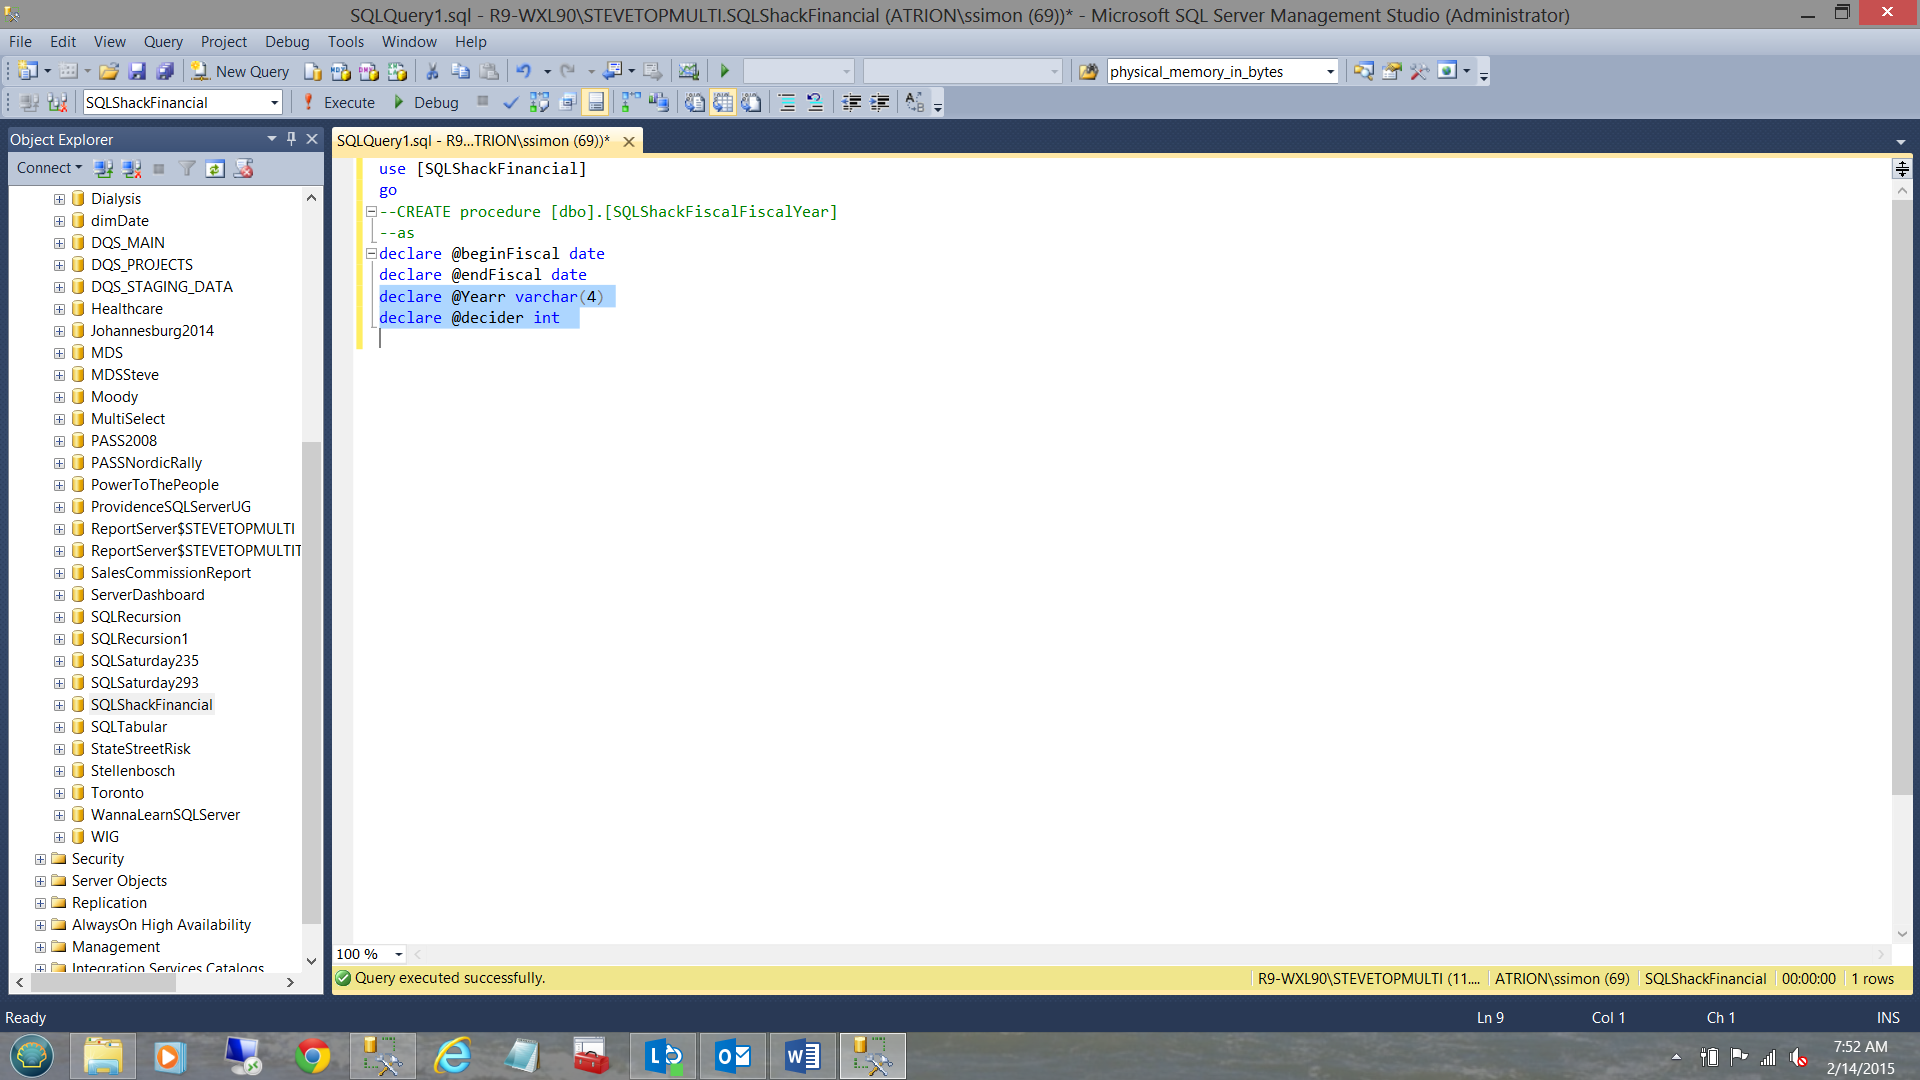
Having declared the two date-related variables, we declare our last two variable @Yearr and @Decider (see above).
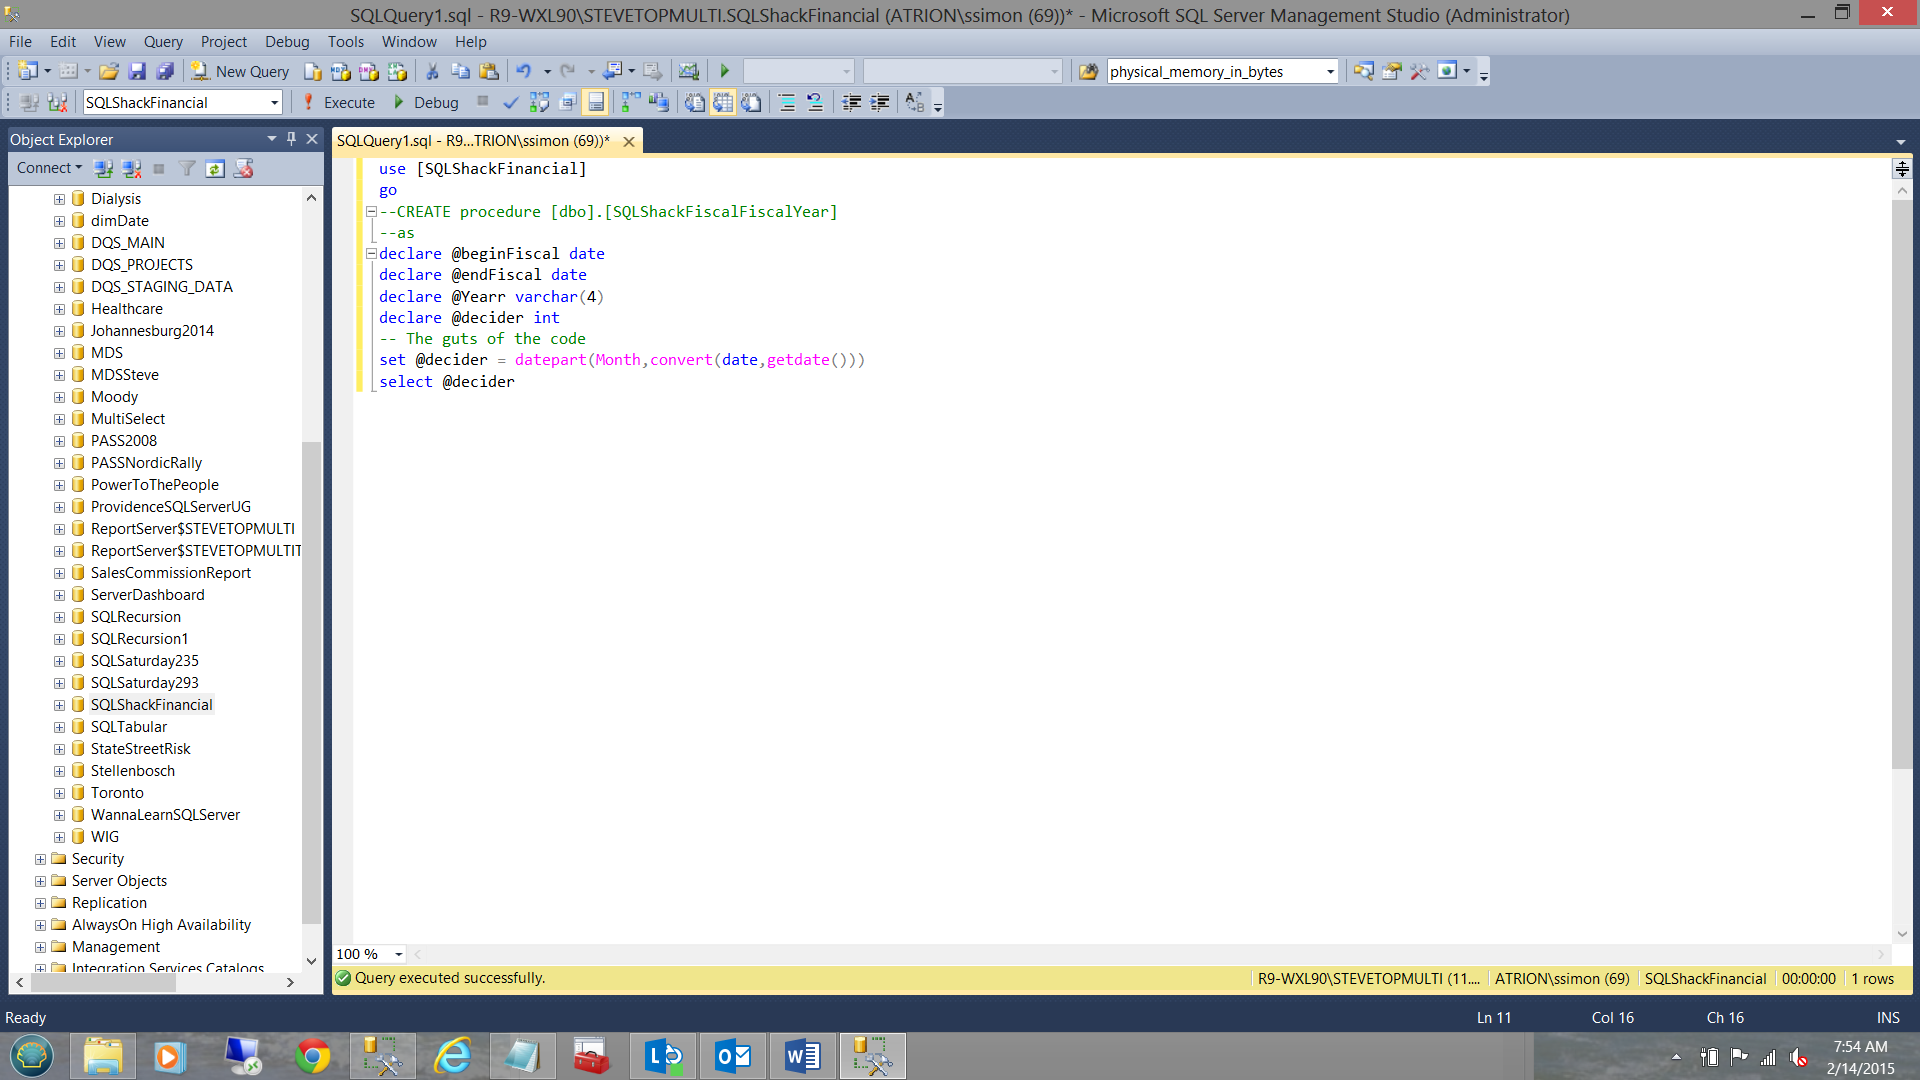
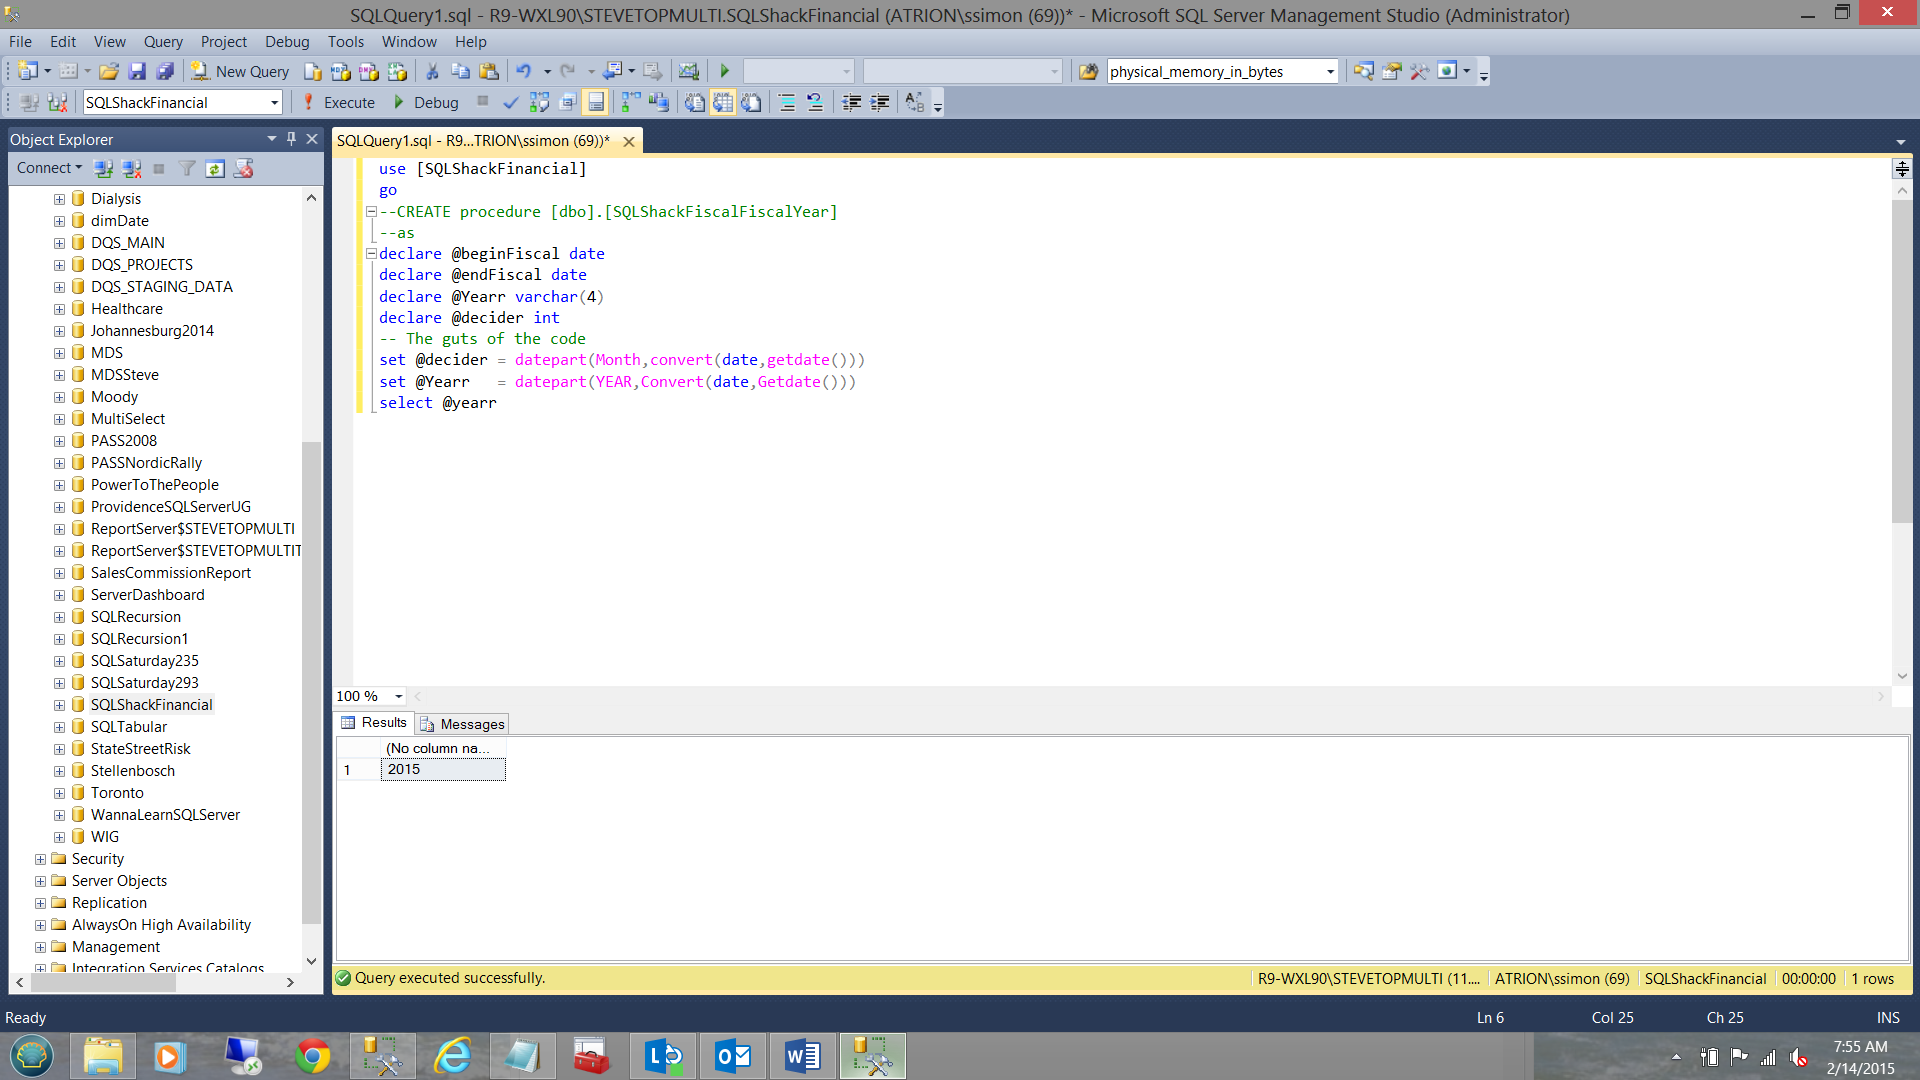
To begin, we set @decider to the current month, by converting the current date (utilizing “Getdate()”) to a date format and then stripping the month (see below).
In a similar fashion we ascertain the current year (see below).
Now here is where the fun begins. This is the logic that we must construct.
Should the ‘month number’ (i.e. the value of @decider) is less than 7 then the beginning of the fiscal year IS NOT the value as shown above BUT rather @yearr-1 or 2014. On the other hand, should @decider be between 7 and 12 then the beginning of the fiscal year is in fact 2015.
|
1 2 3 |
set @Yearr = case when @decider >= 7 then datepart(YEAR,Convert(date,Getdate())) else @Yearr -1 end |
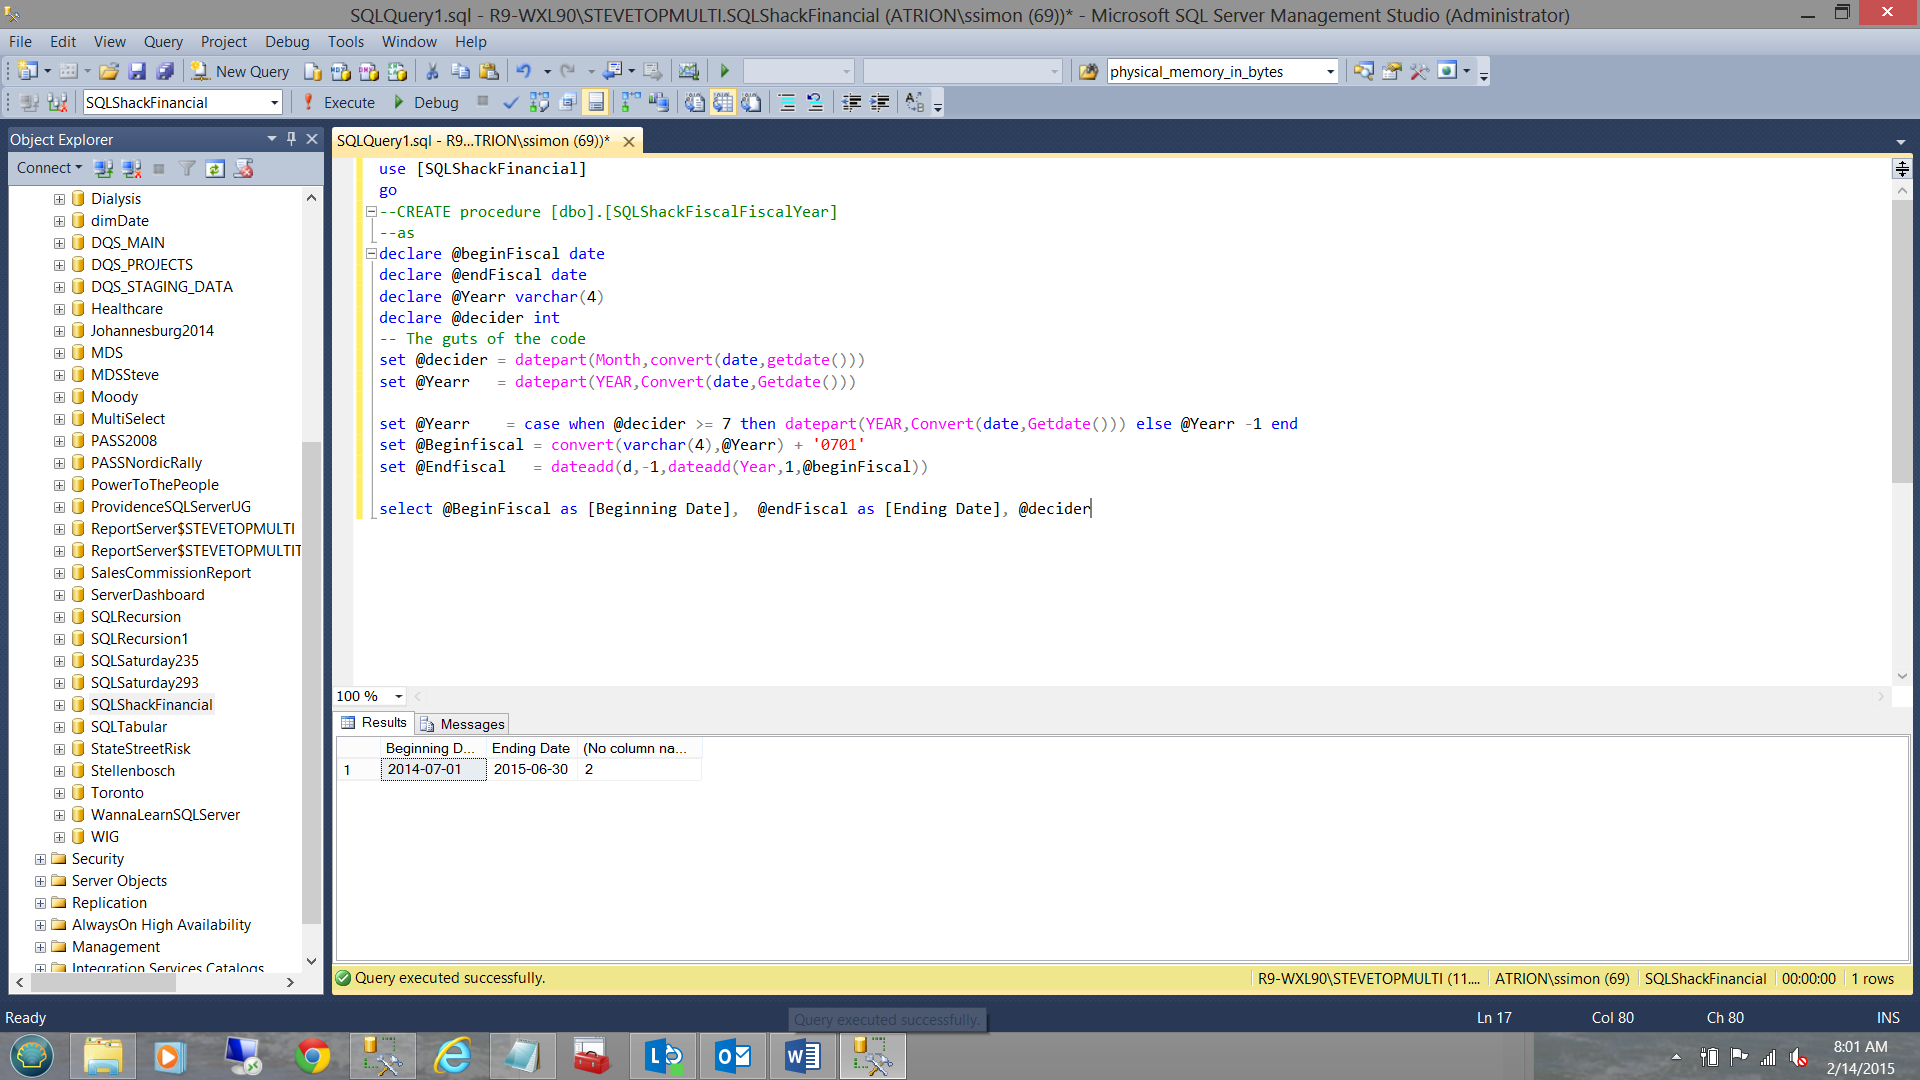
The line of code above requires a bit of explanation. If the current month is greater than or equal to 7 then we are in the first half of the fiscal year which is between July 1 and December 31 and as such the beginning date for date extraction must be set to 2015-07-01. Otherwise, the beginning date must be set to 2014-07-01.
|
1 2 3 4 |
set @Yearr = case when @decider >= 7 then datepart(YEAR,Convert(date,Getdate())) else @Yearr -1 end set @Beginfiscal = convert(varchar(4),@Yearr) + '0701' |
This is easily achieved utilizing the following line of code.
|
1 2 3 |
set @Endfiscal = dateadd(d,-1,dateadd(Year,1,@beginFiscal)) |
This line of code also requires a bit of explanation as well.
We first add one year to the value of @beginfiscal see below:
|
1 2 3 |
dateadd(Year,1,@beginFiscal) |
This will set the date to ‘2016-07-01’ (if run in February 2015) which is really the beginning of the NEXT financial year. This is NOT correct. To rectify this we must SUBTRACT one day from this value. We achieve this by enclosing our “DateAdd()” in another “DateAdd()” where we subtract one day (see below).
|
1 2 3 |
set @Endfiscal = dateadd(d,-1,dateadd(Year,1,@beginFiscal)). |
An additional feature of this method of setting the end date is that should your fiscal year began March 1 and end on the last day of February, then a “Leap year” is no longer problematic as the last day of February is automatically calculated by the system. Personally, I see this as a definite plus.
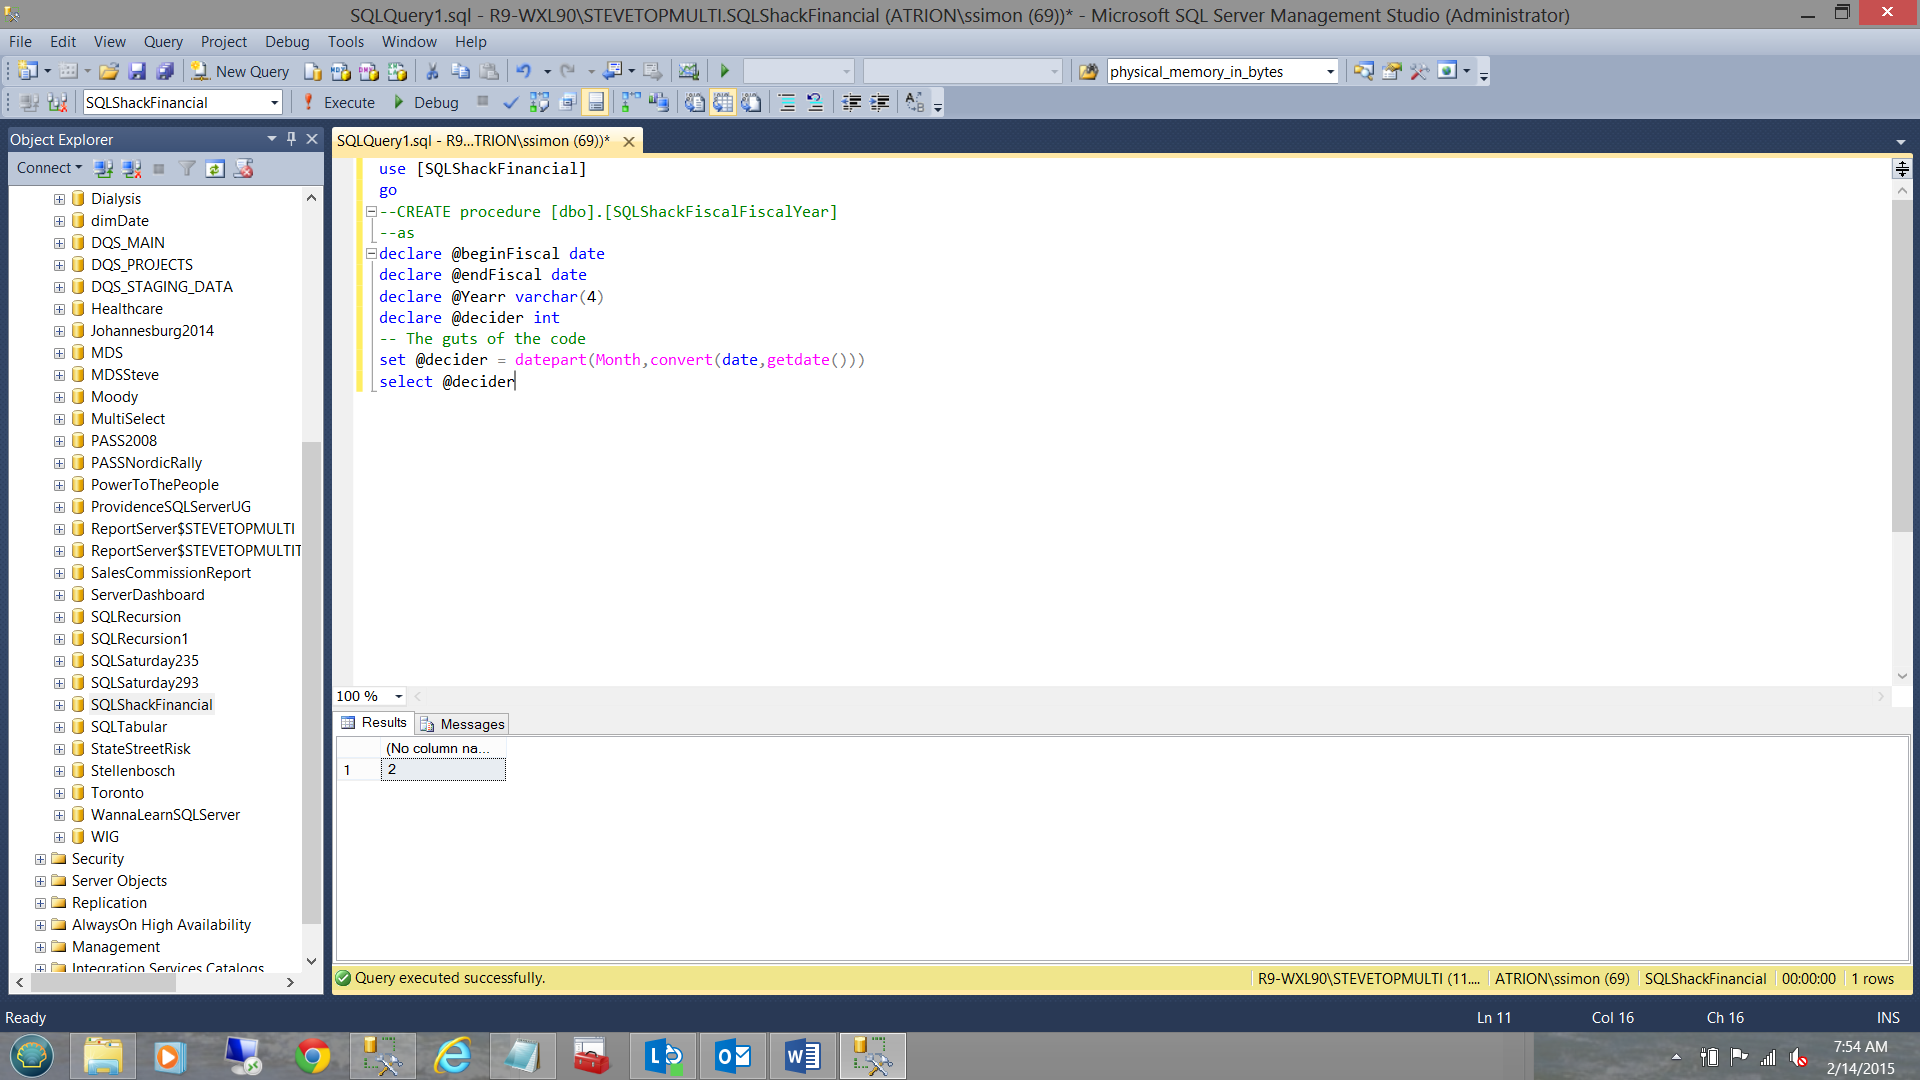
Running the query that we have created thus far, we find the following (see below).
Playing around a bit and more to prove a point, we arbitrarily change the values of @decider. Let us pretend that we are now in July 2015 (see below).
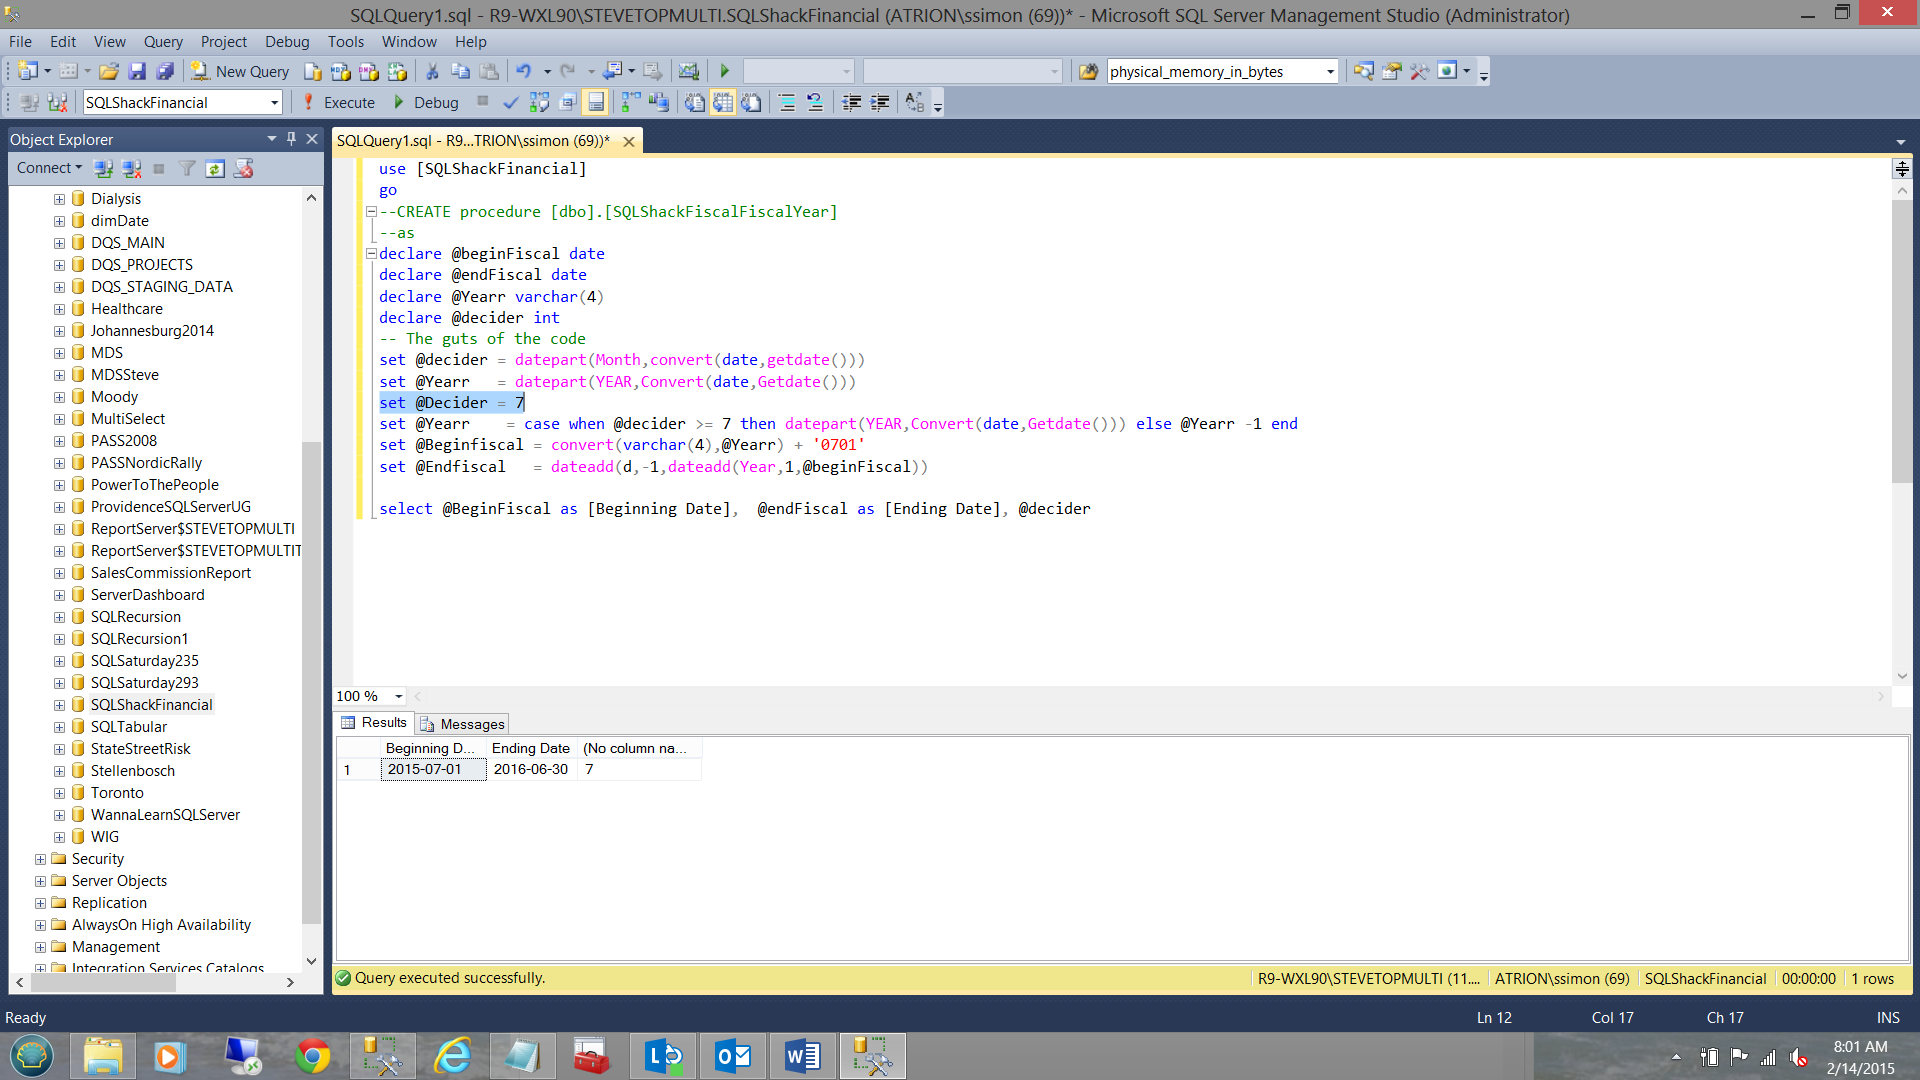
We can clearly see that by setting the month to July that we are into the next fiscal year (see above).
Testing our newly generated code
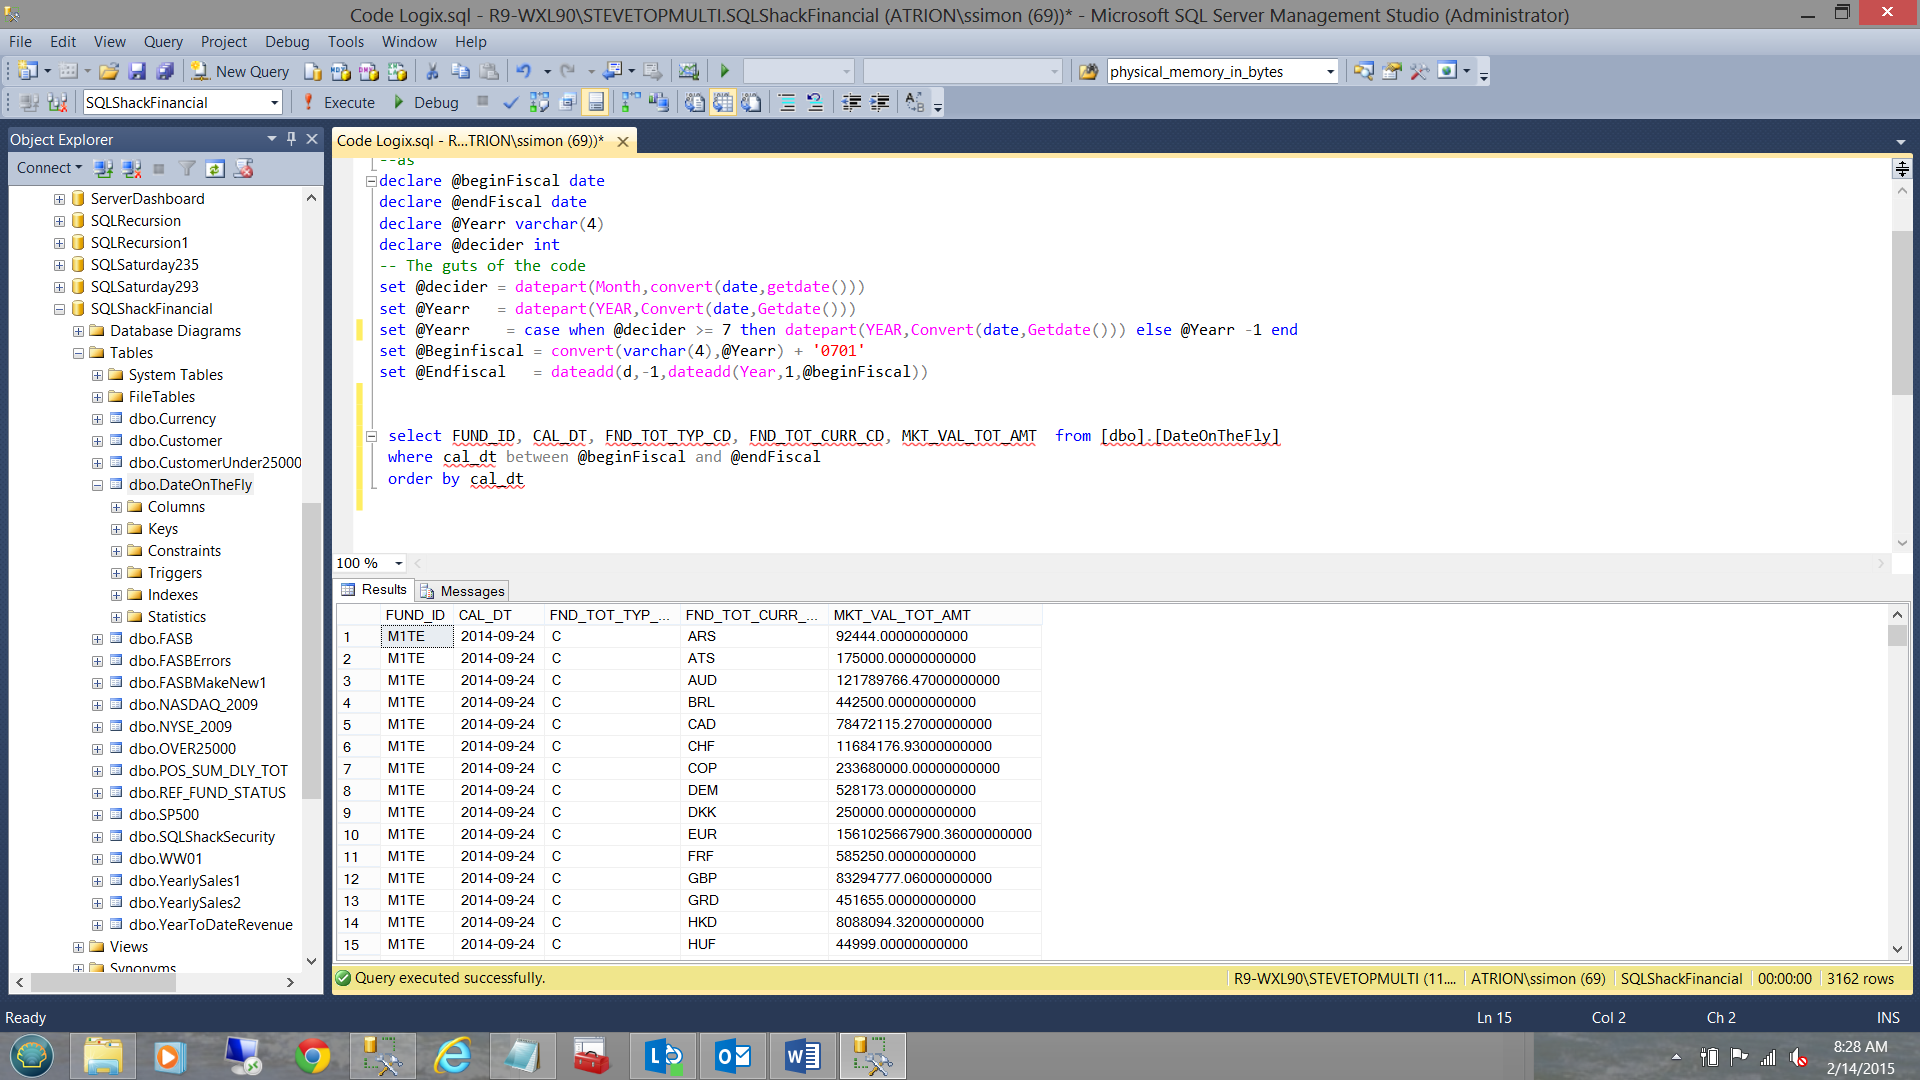
Having a look at some data within our “DateOnTheFly” table, we find that the lowest date available is September 24th 2014. Sorting the same data in descending order we find that in this case…
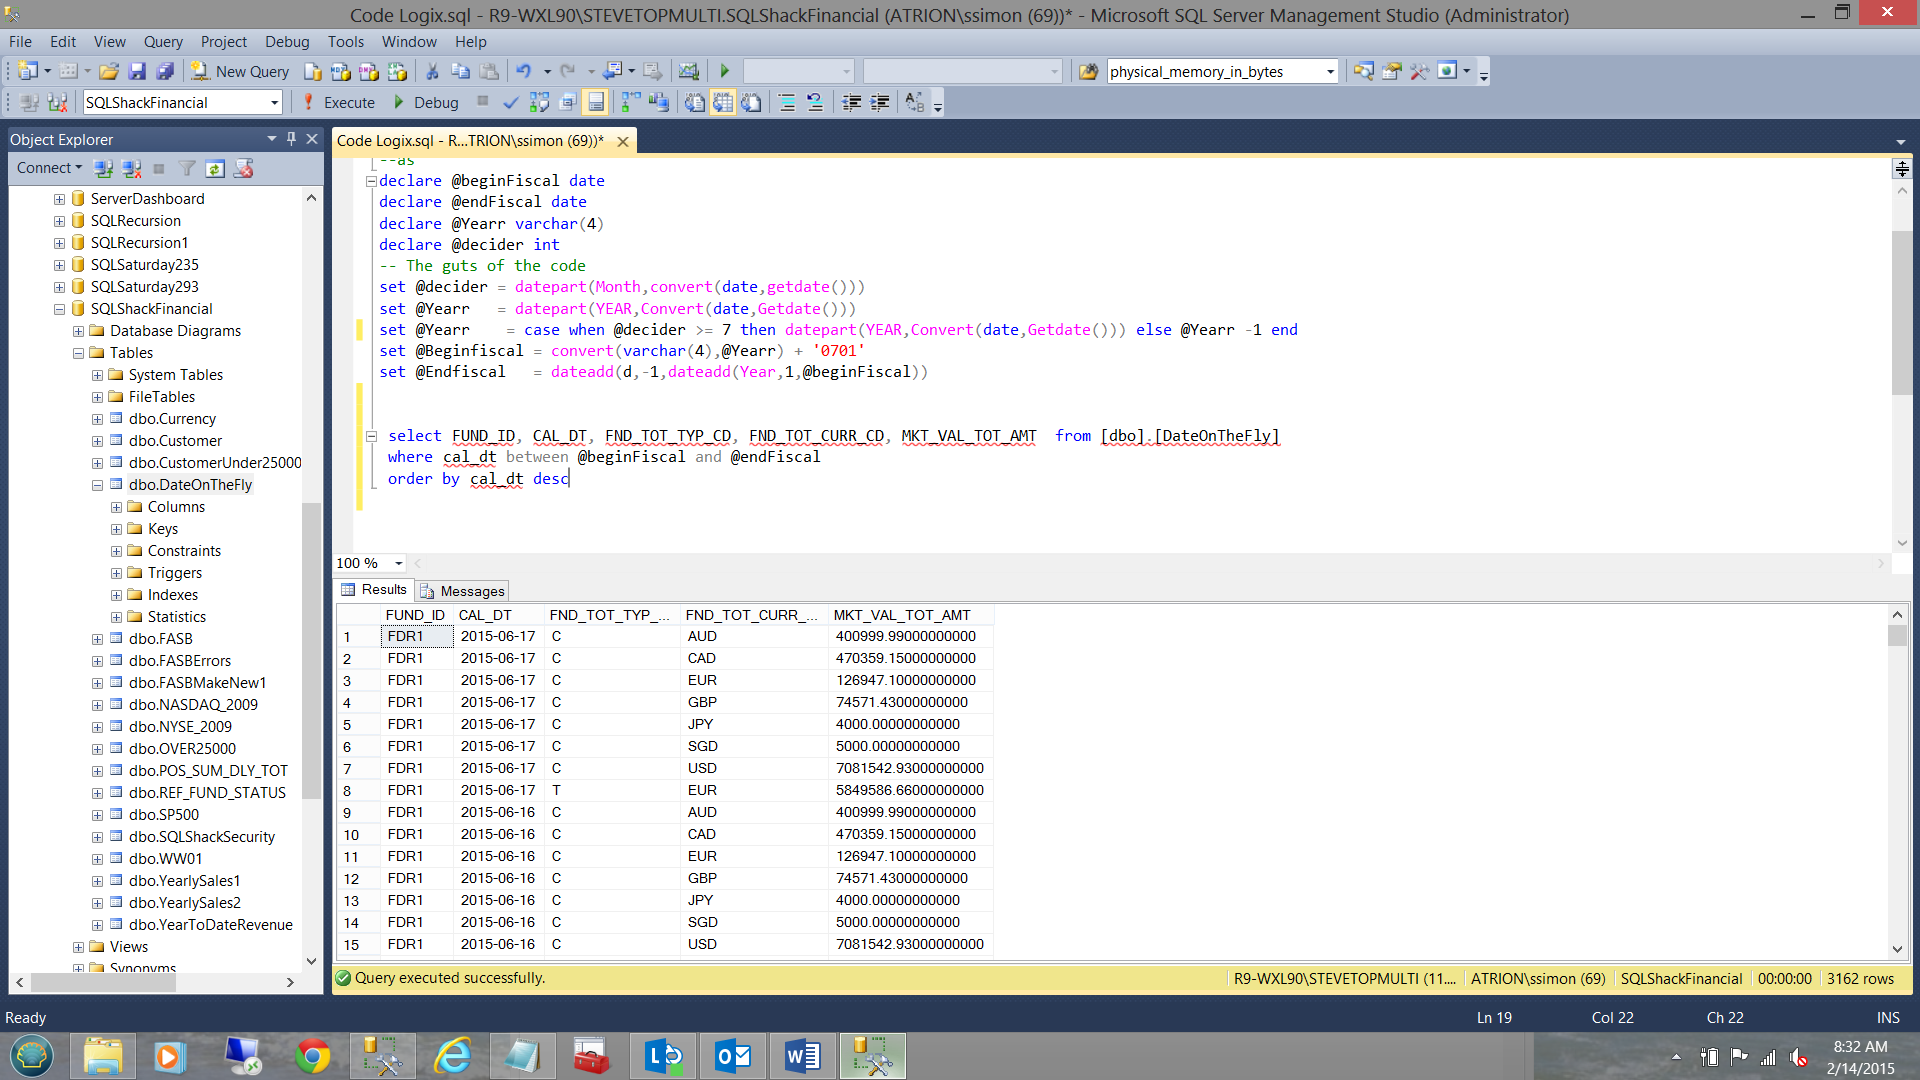
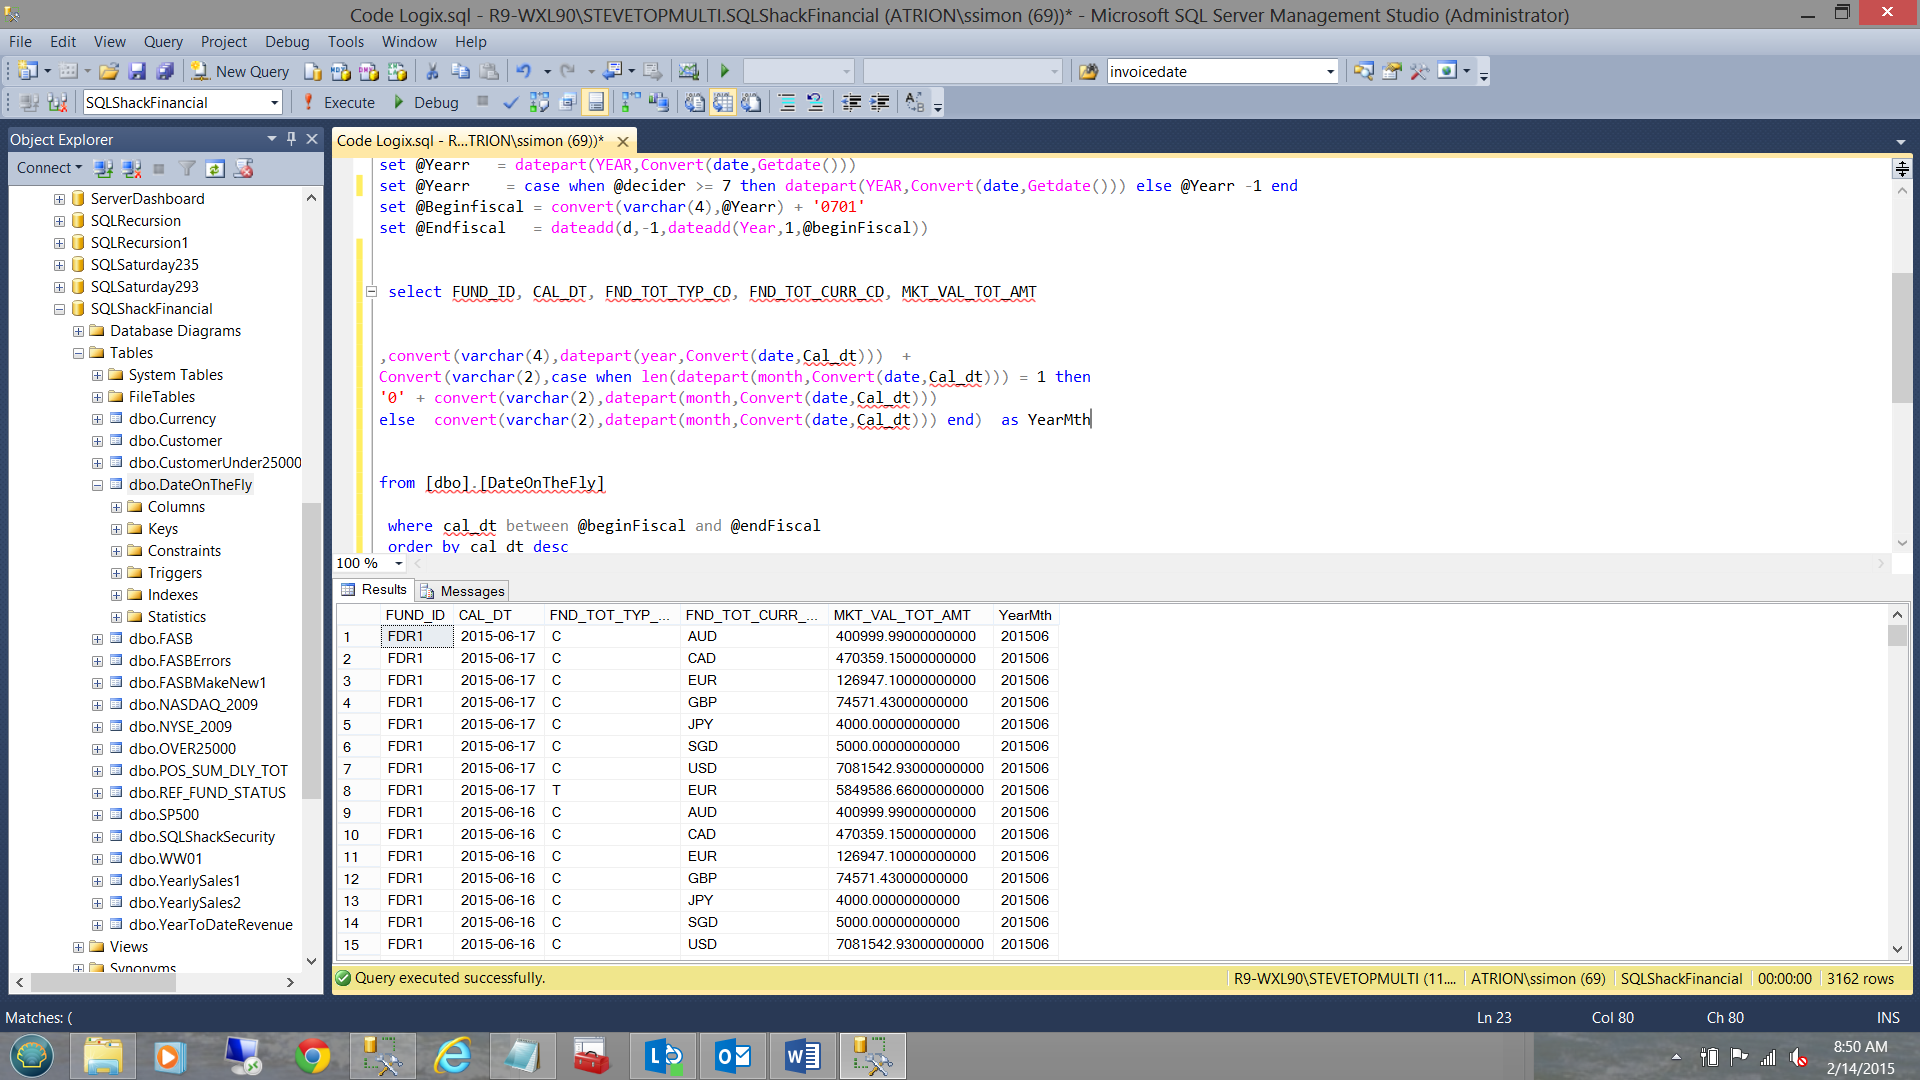
the highest date is June 17th 2015 (albeit ahead of our current month “February”). June 2015 data was added for demo purposes only. I believe that the astute reader now understands the concept.
So how do we utilize this from a reporting viewpoint?
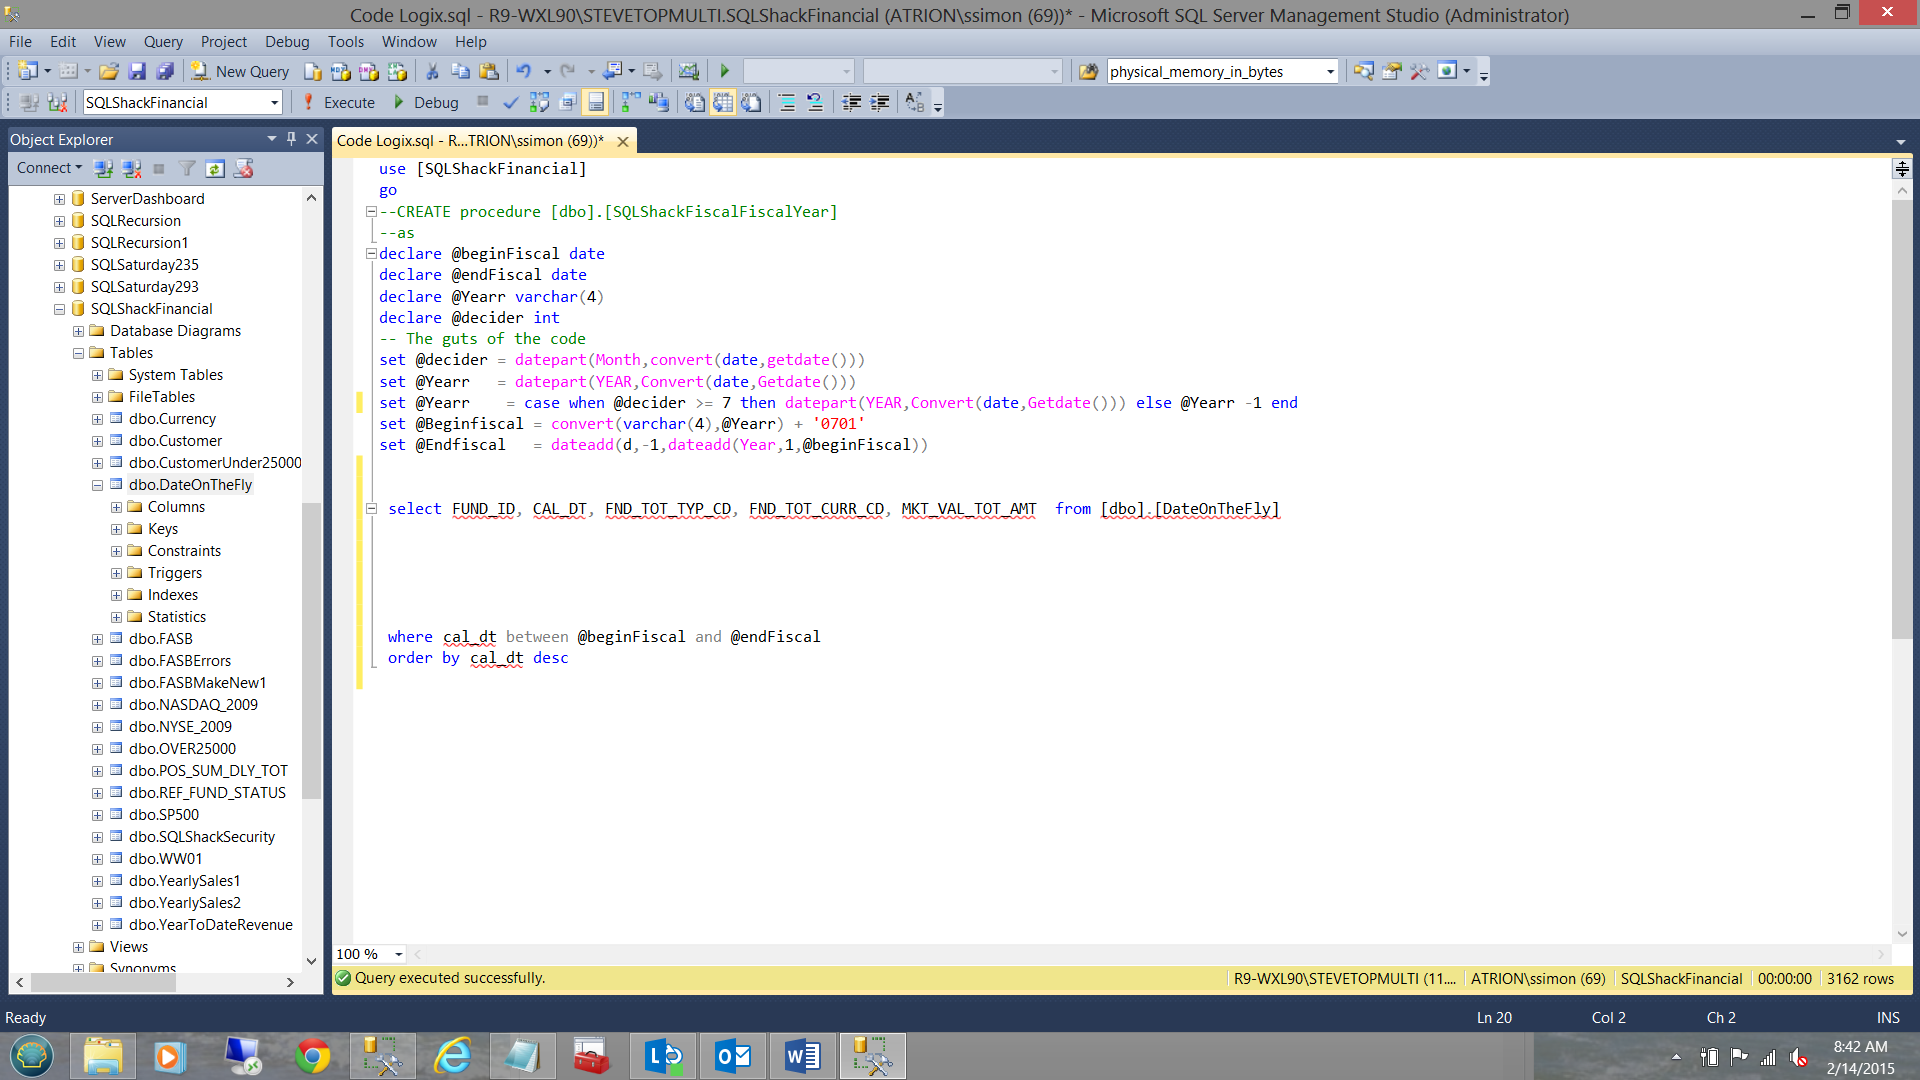
Taking the query that we created (above), we now open up the code listing as shown above.
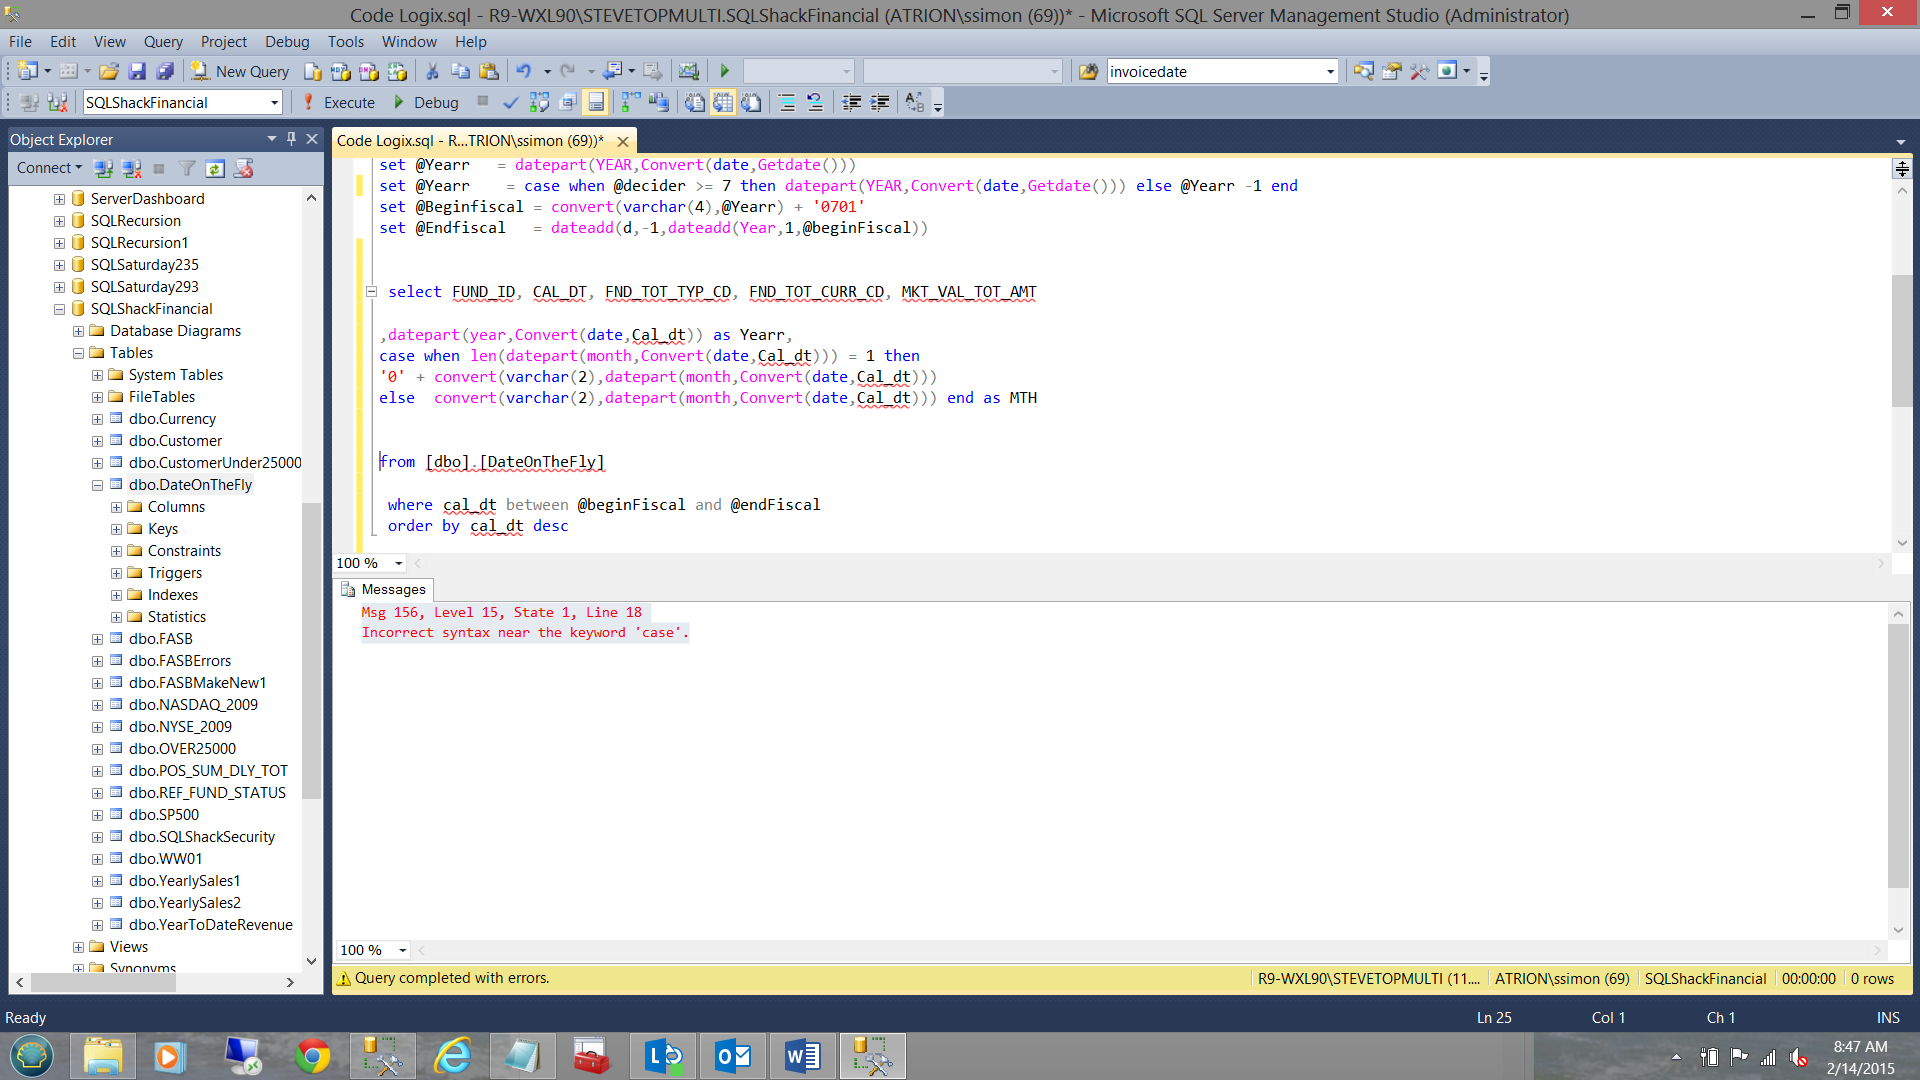
We add the following code to our listing. Note that when we extract the month utilizing the DatePart() function, an integer is returned. In adding the code snippet above what I plan to achieve is to create a sort field that would be hidden from the user, however, it would permit the physical month names to be truly sorted from July through June (as opposed to starting in April and ending in September). This is truly important when working with a non-standard fiscal year.
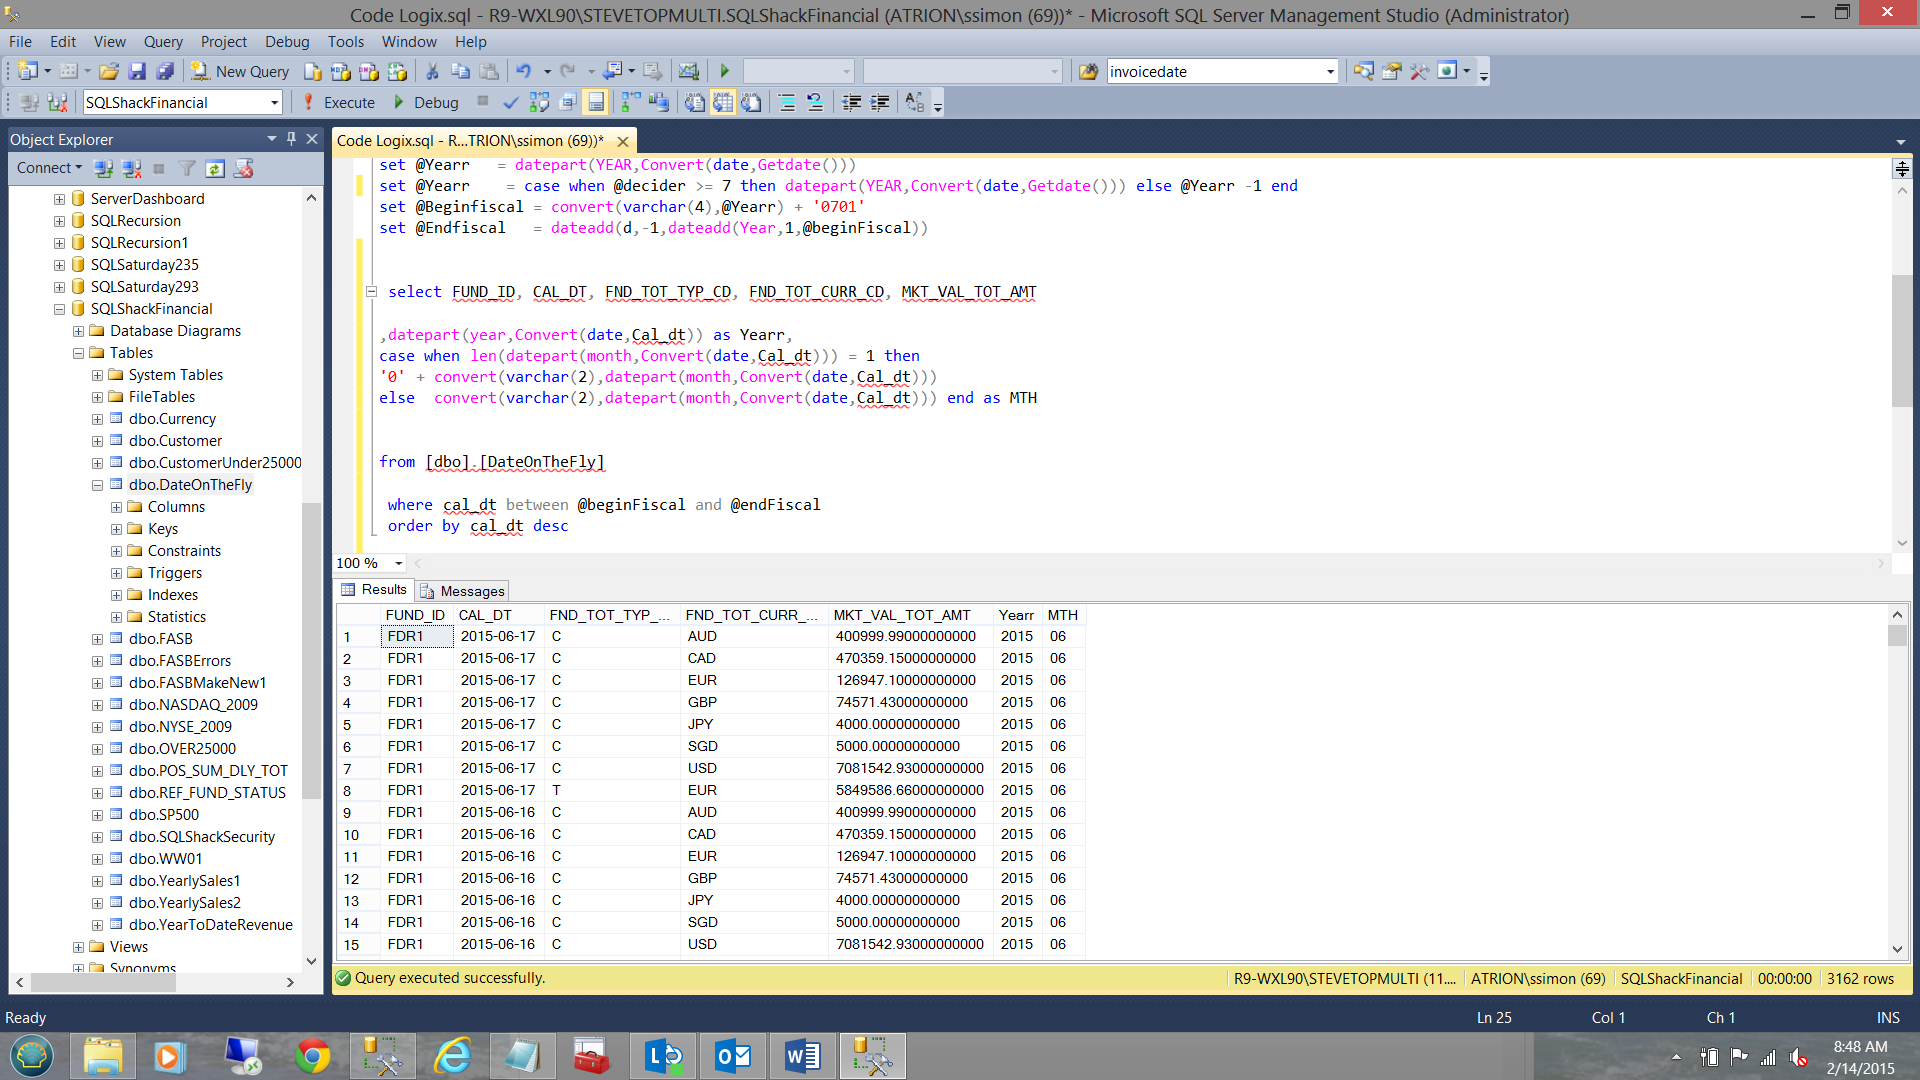
My two new fields Yearr and MTH may be seen above.
Changing the code slightly and converting the Yearr and MTH fields into Varchar() format, I am able to create a “nifty” field that may be used for accurate data sorting.
Setting the calendar month names
Once again, I effect a few changes to my code. I convert our current query into a subquery and add another column based upon “case” logic (see below).
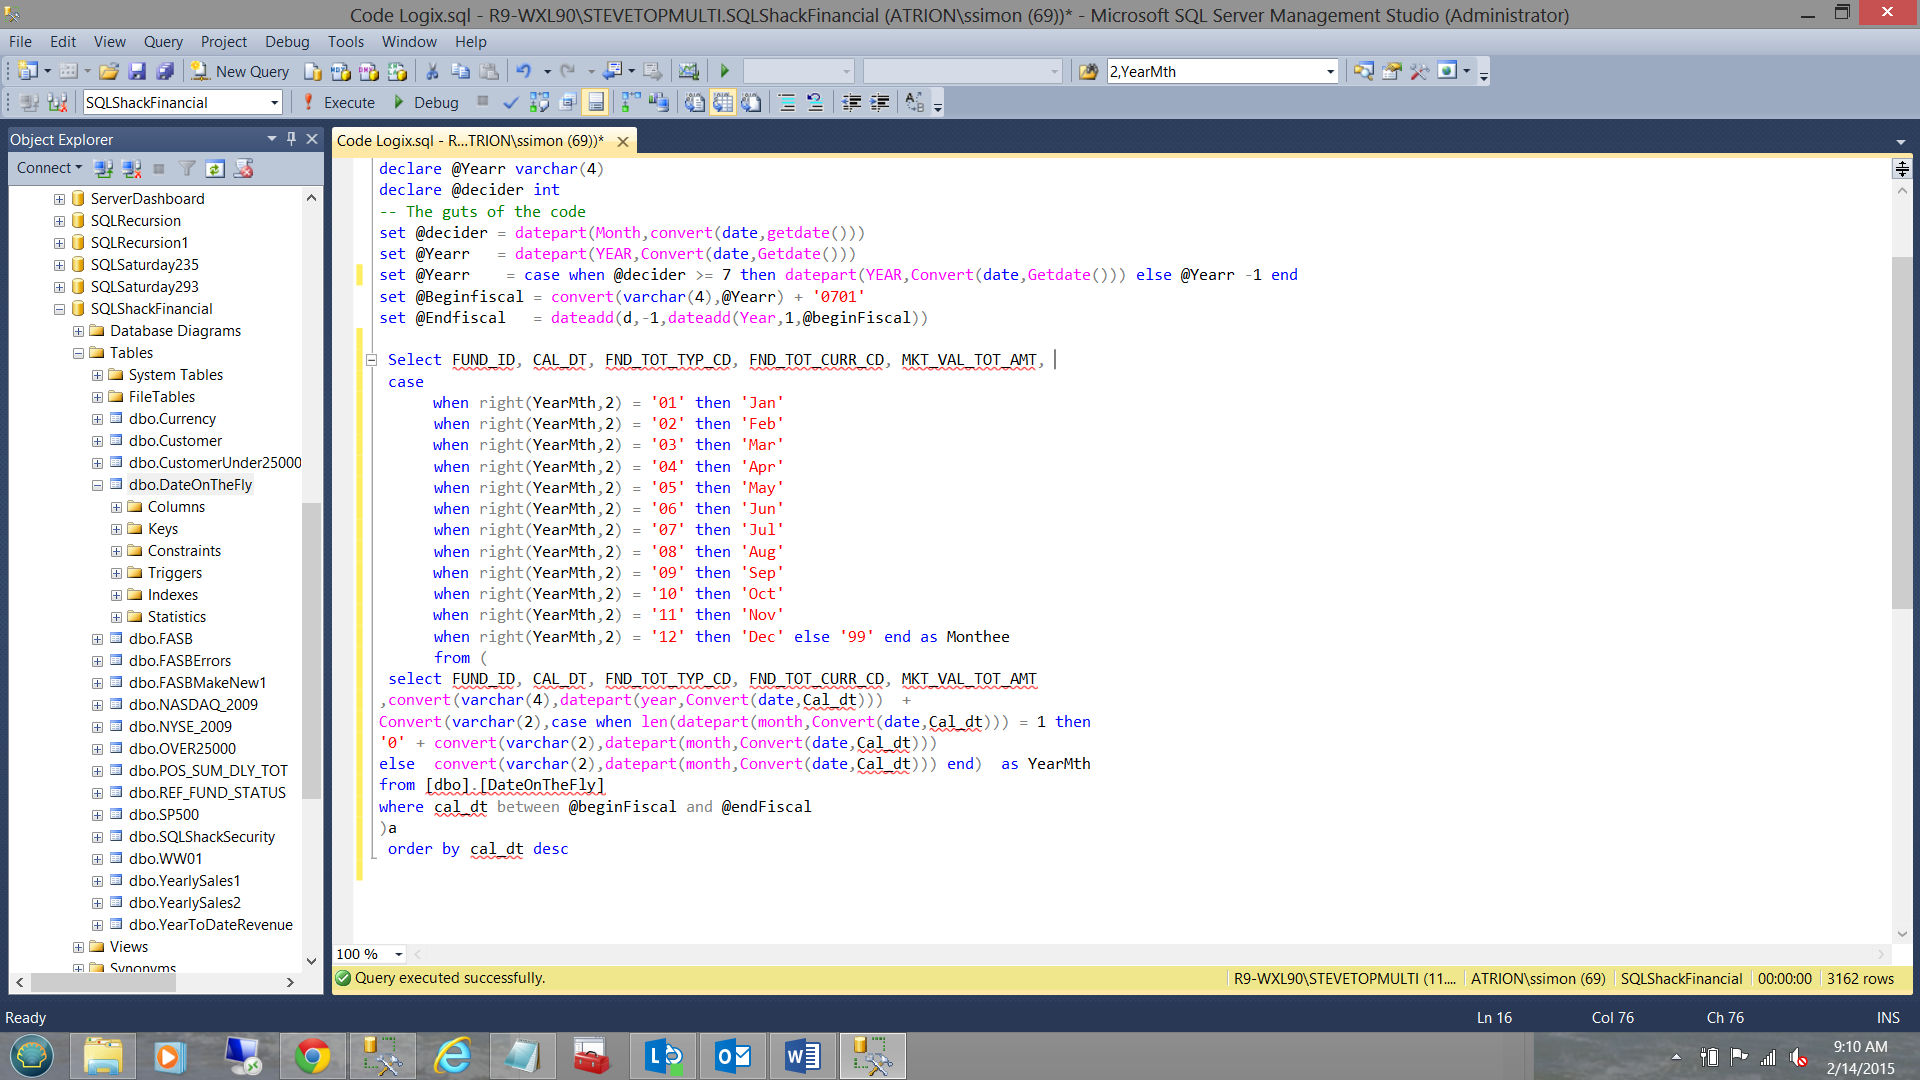
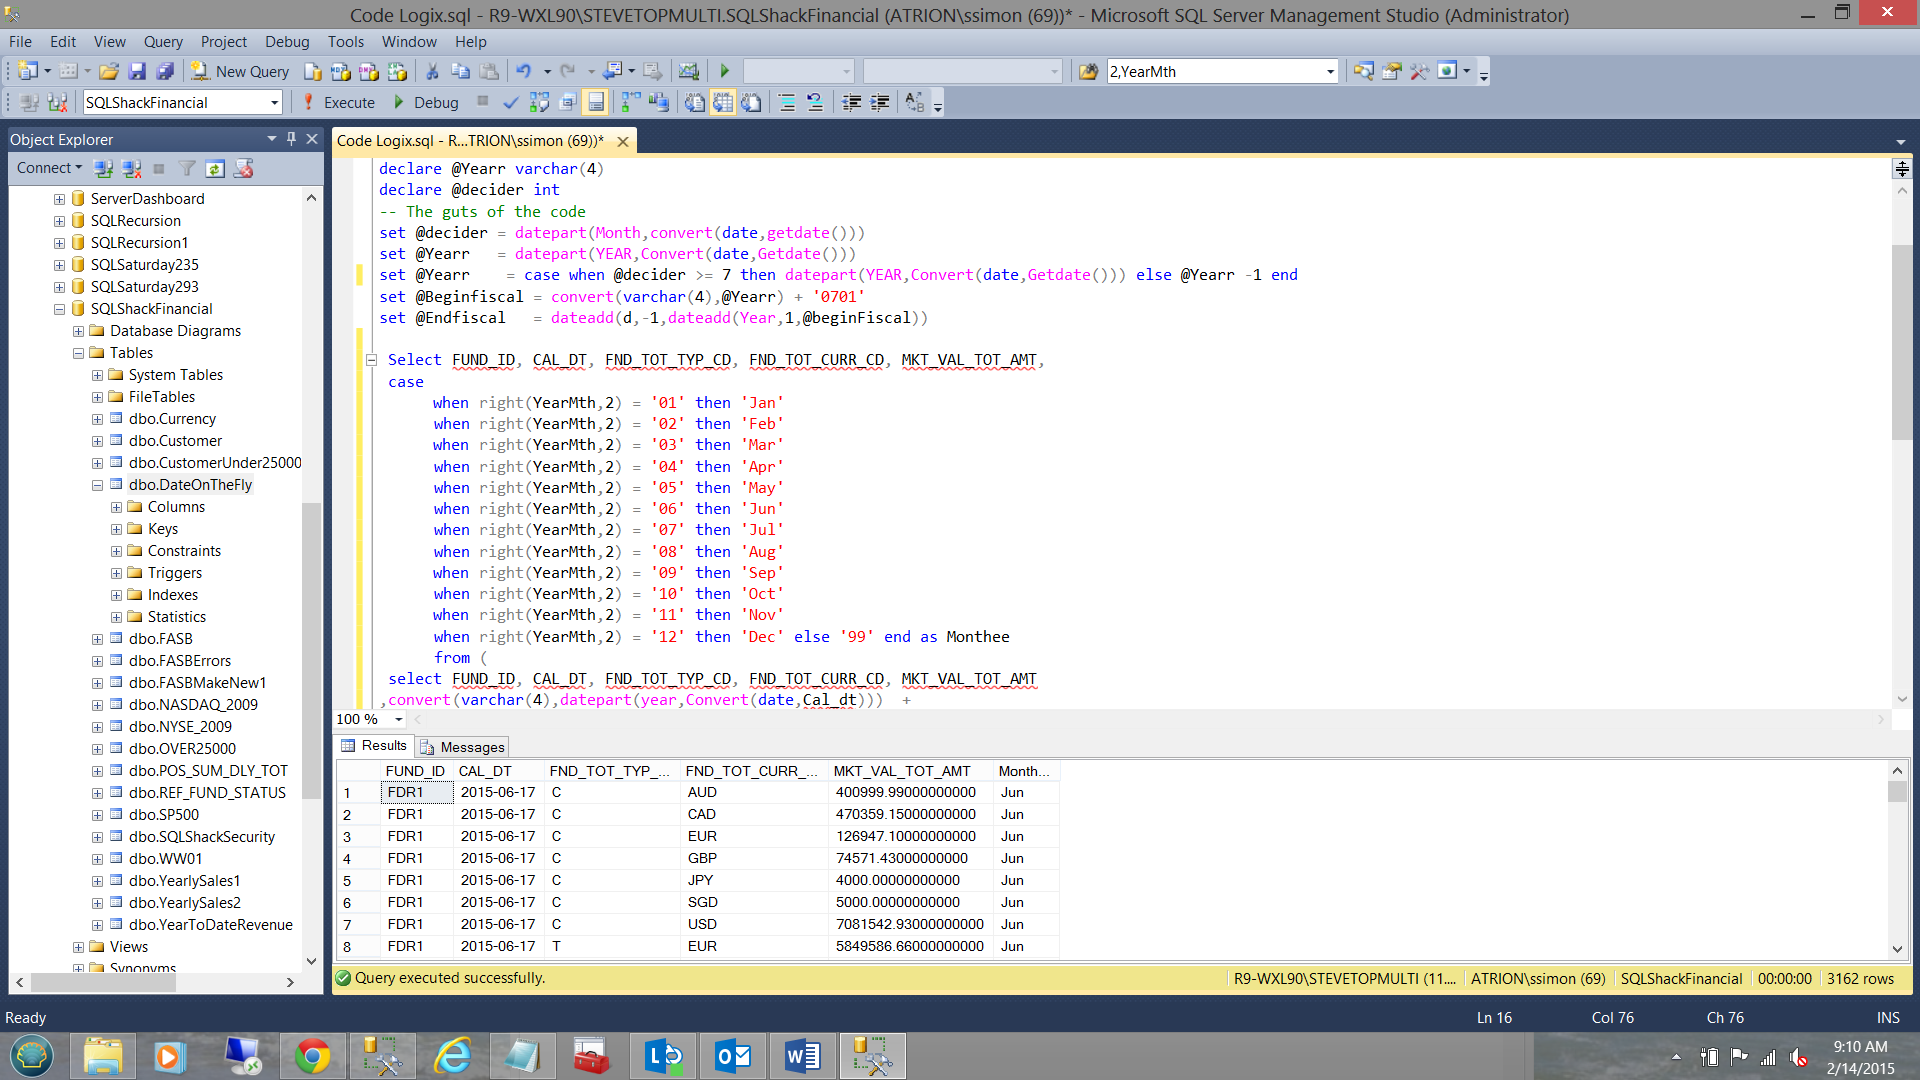
Re-running our query we now find and the calendar month names now appear.
Our final alteration that we shall make is to “total” or sum the market value per YearMth, currency, and fund. The code listing may be found in Addenda 2.
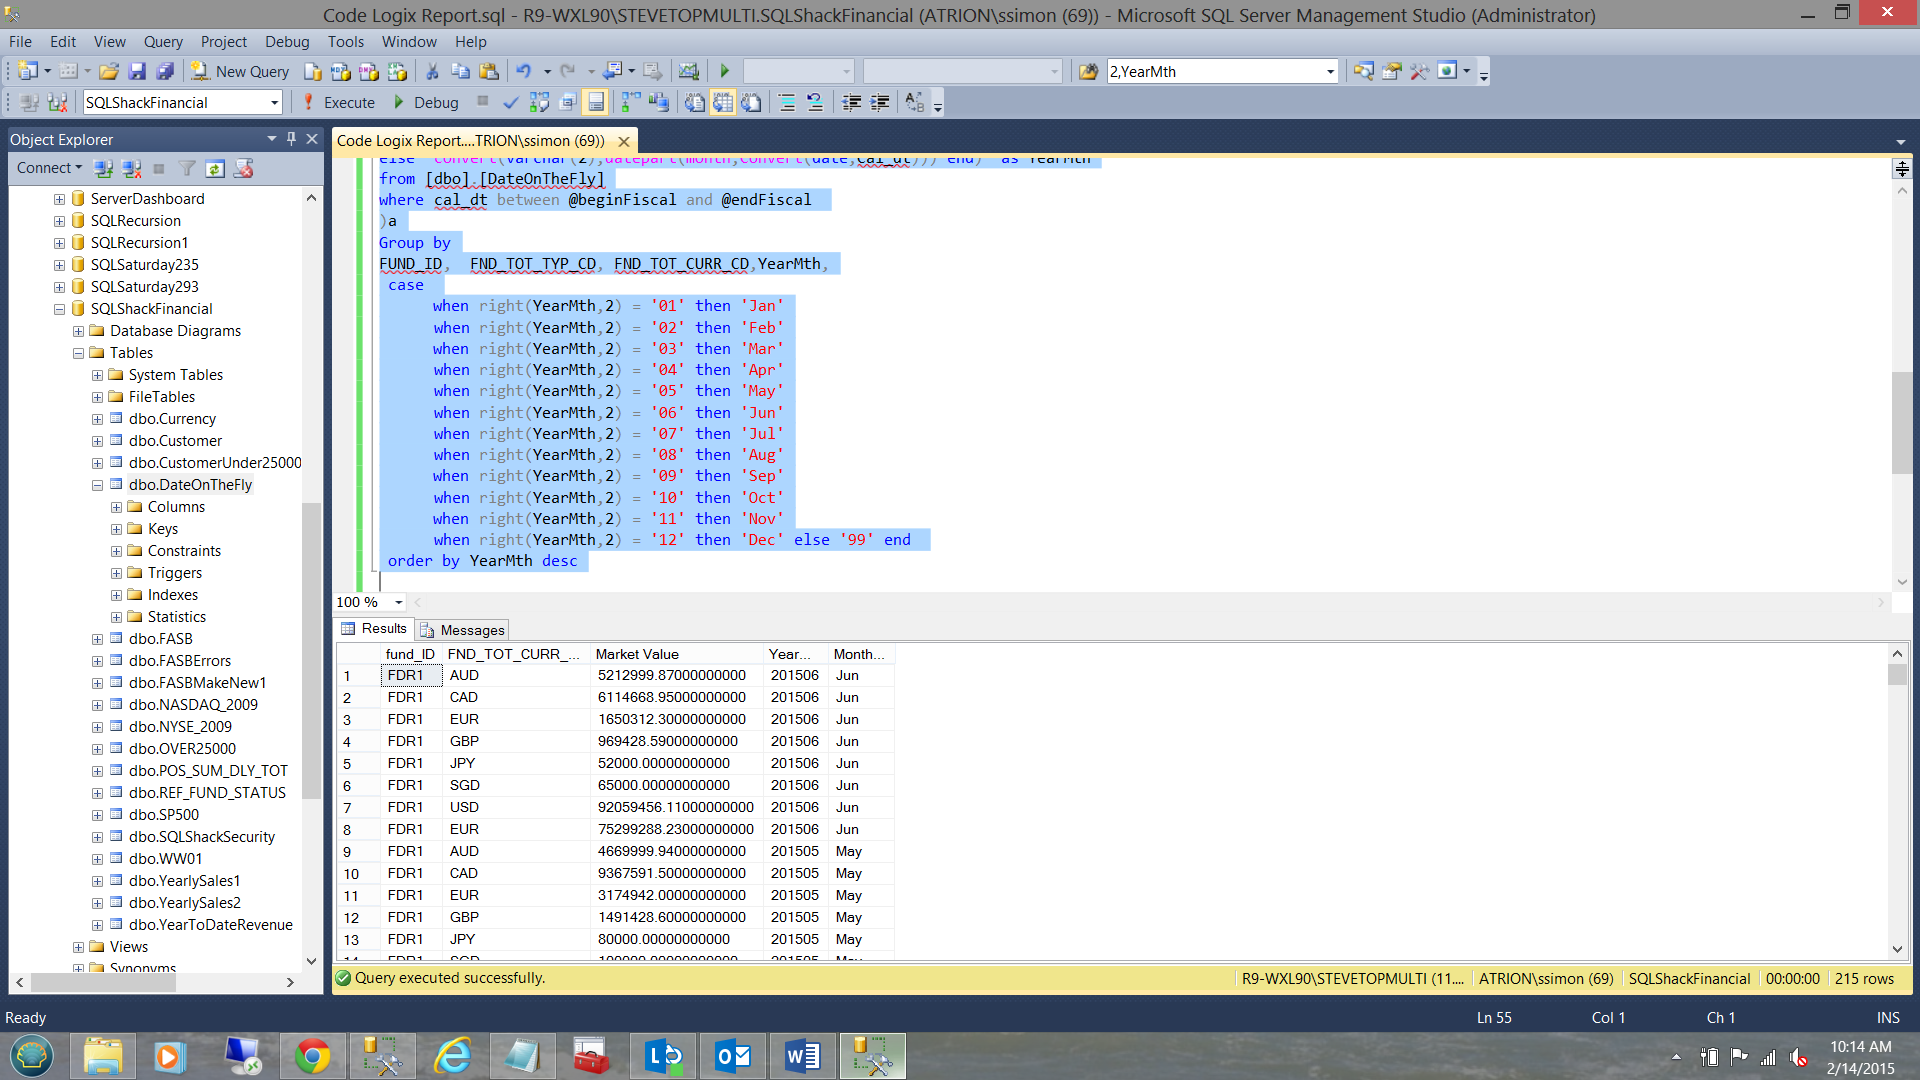
The results of may be seen in the screen dump above.
Meanwhile back in the Reporting Services world..
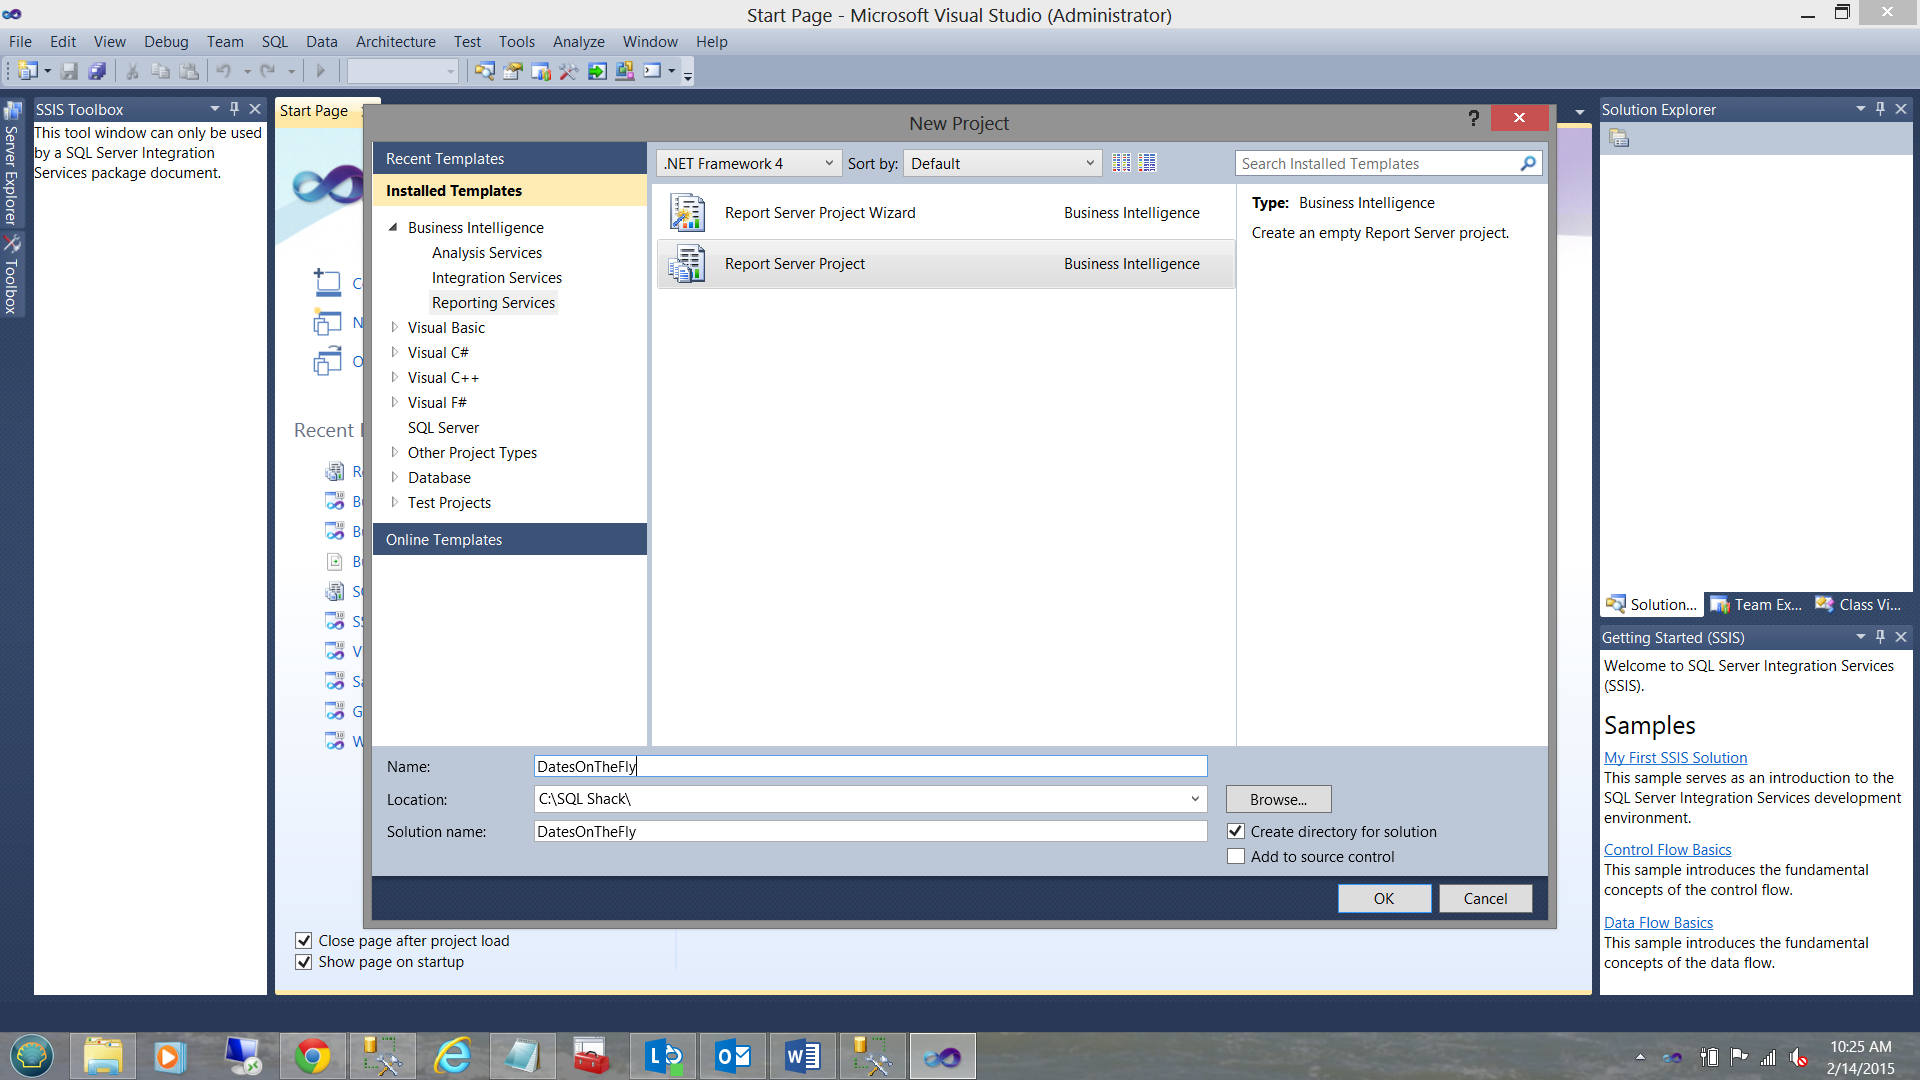
A query as such has little aesthetic use. In order to prove out our results, we create a quick and dirty reporting services project (see above).
I have described the creation of Reporting Services projects in detail in many of our past “get-togethers”.
As always, should you be new to Reporting Services and wish some guidance, then please do have a look my SQL Shack article entitled “Now you see it, now you don’t.
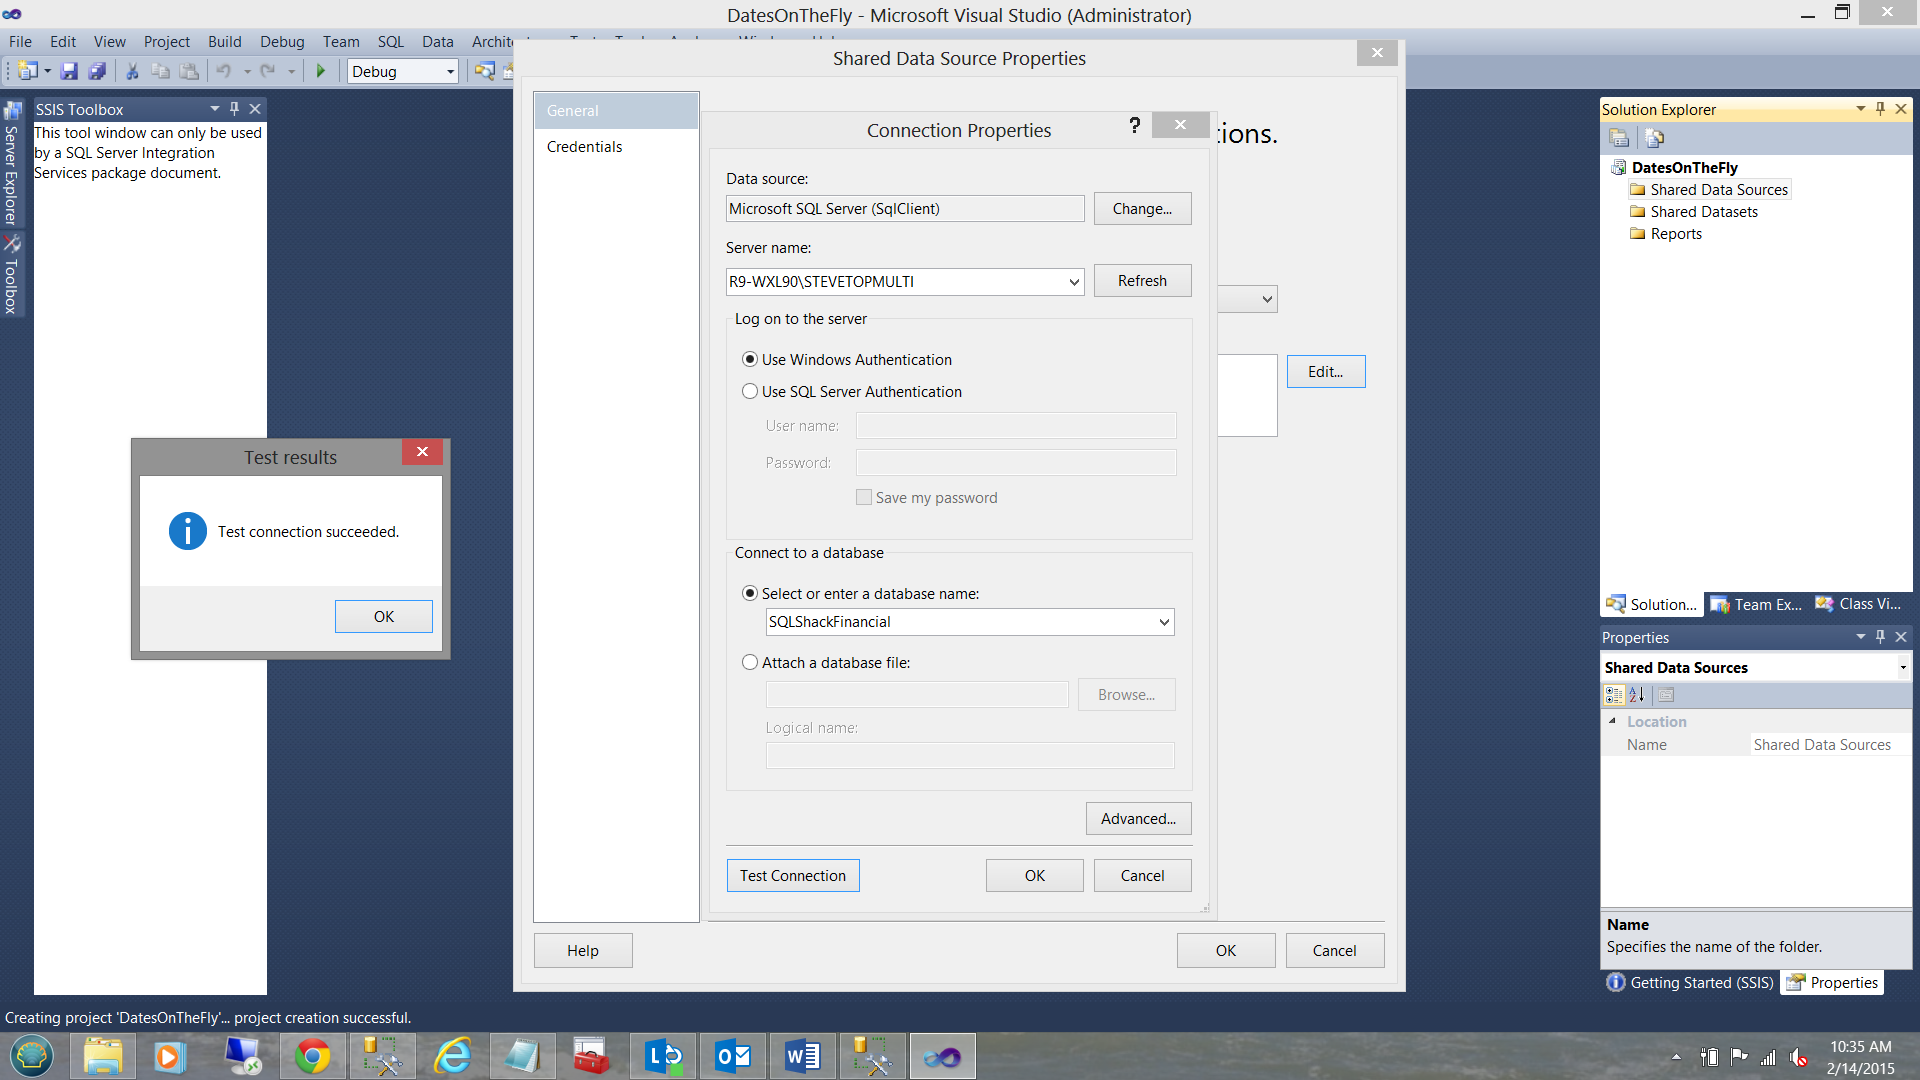
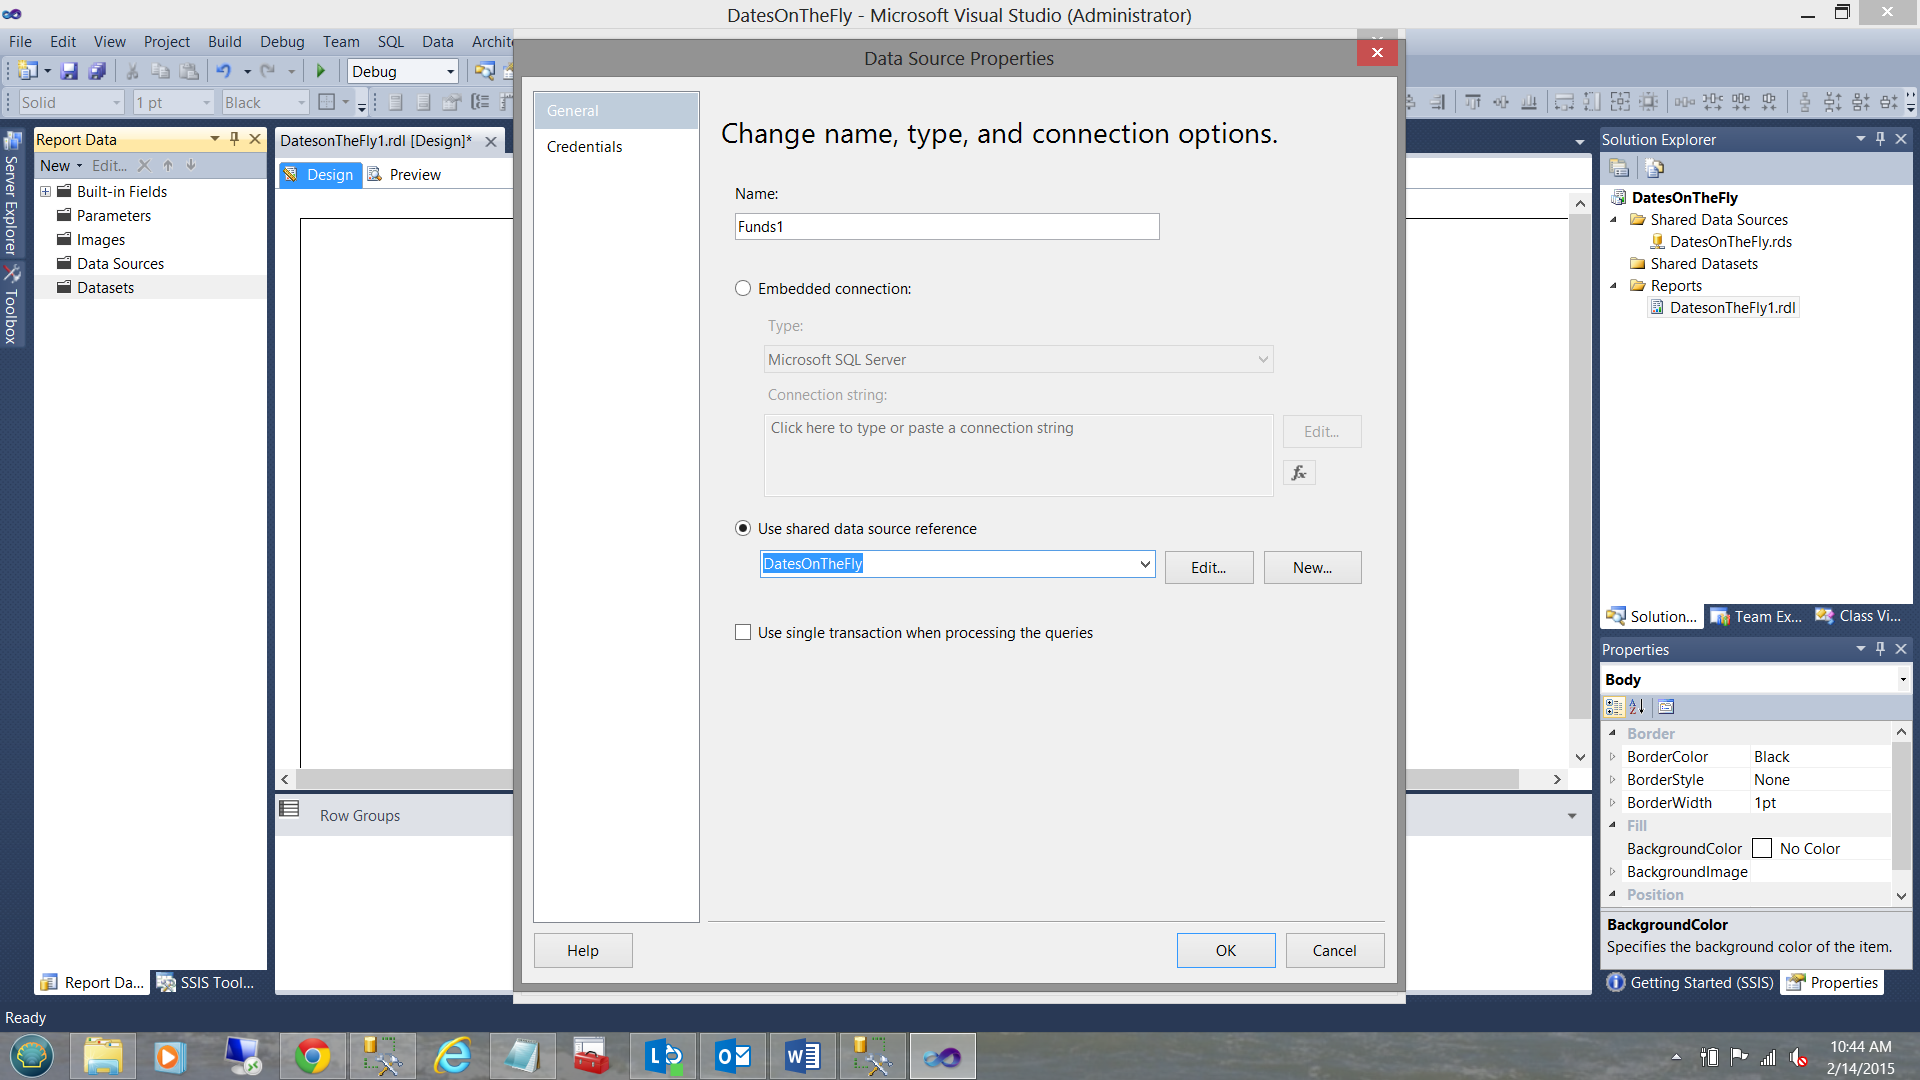
As we have done in past exercises, we create a “Shared Data Source” which we call “DatesOnTheFly” (see above).
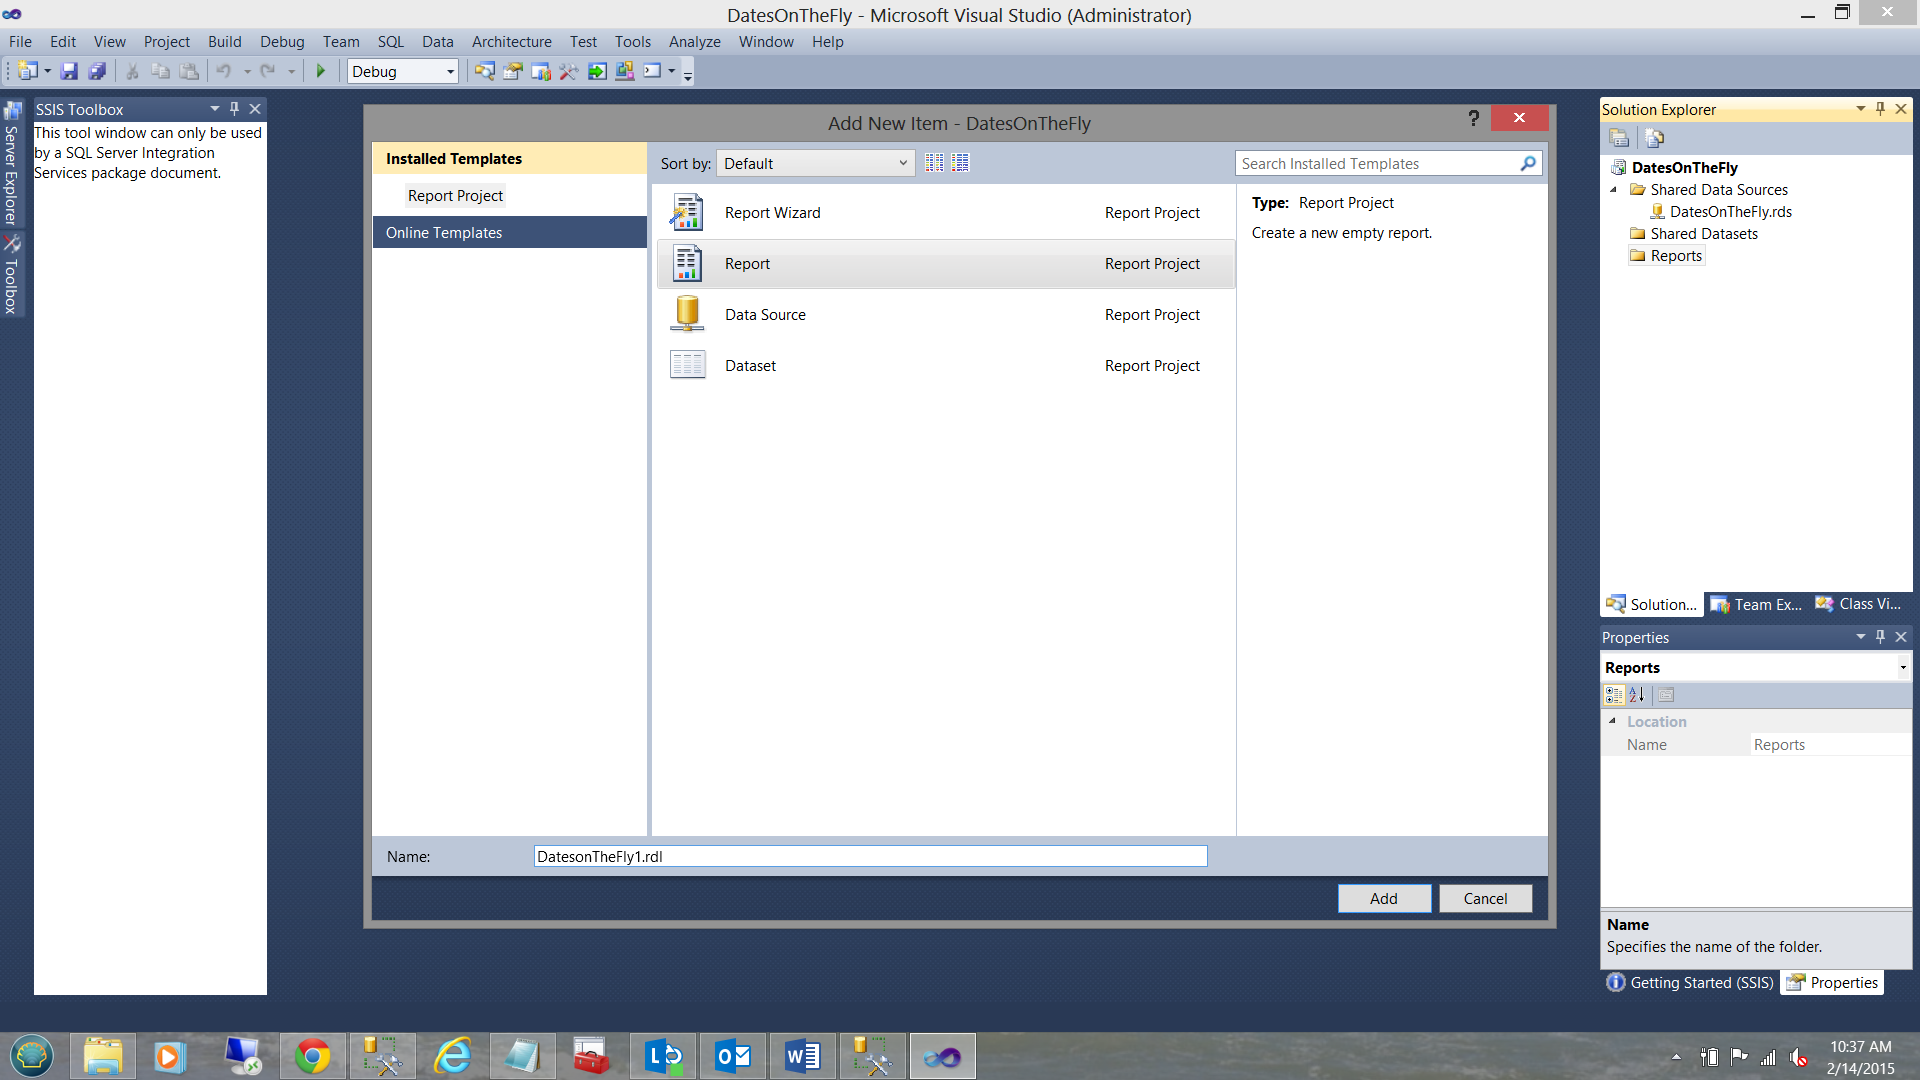
We now create a new report as may be seen above.
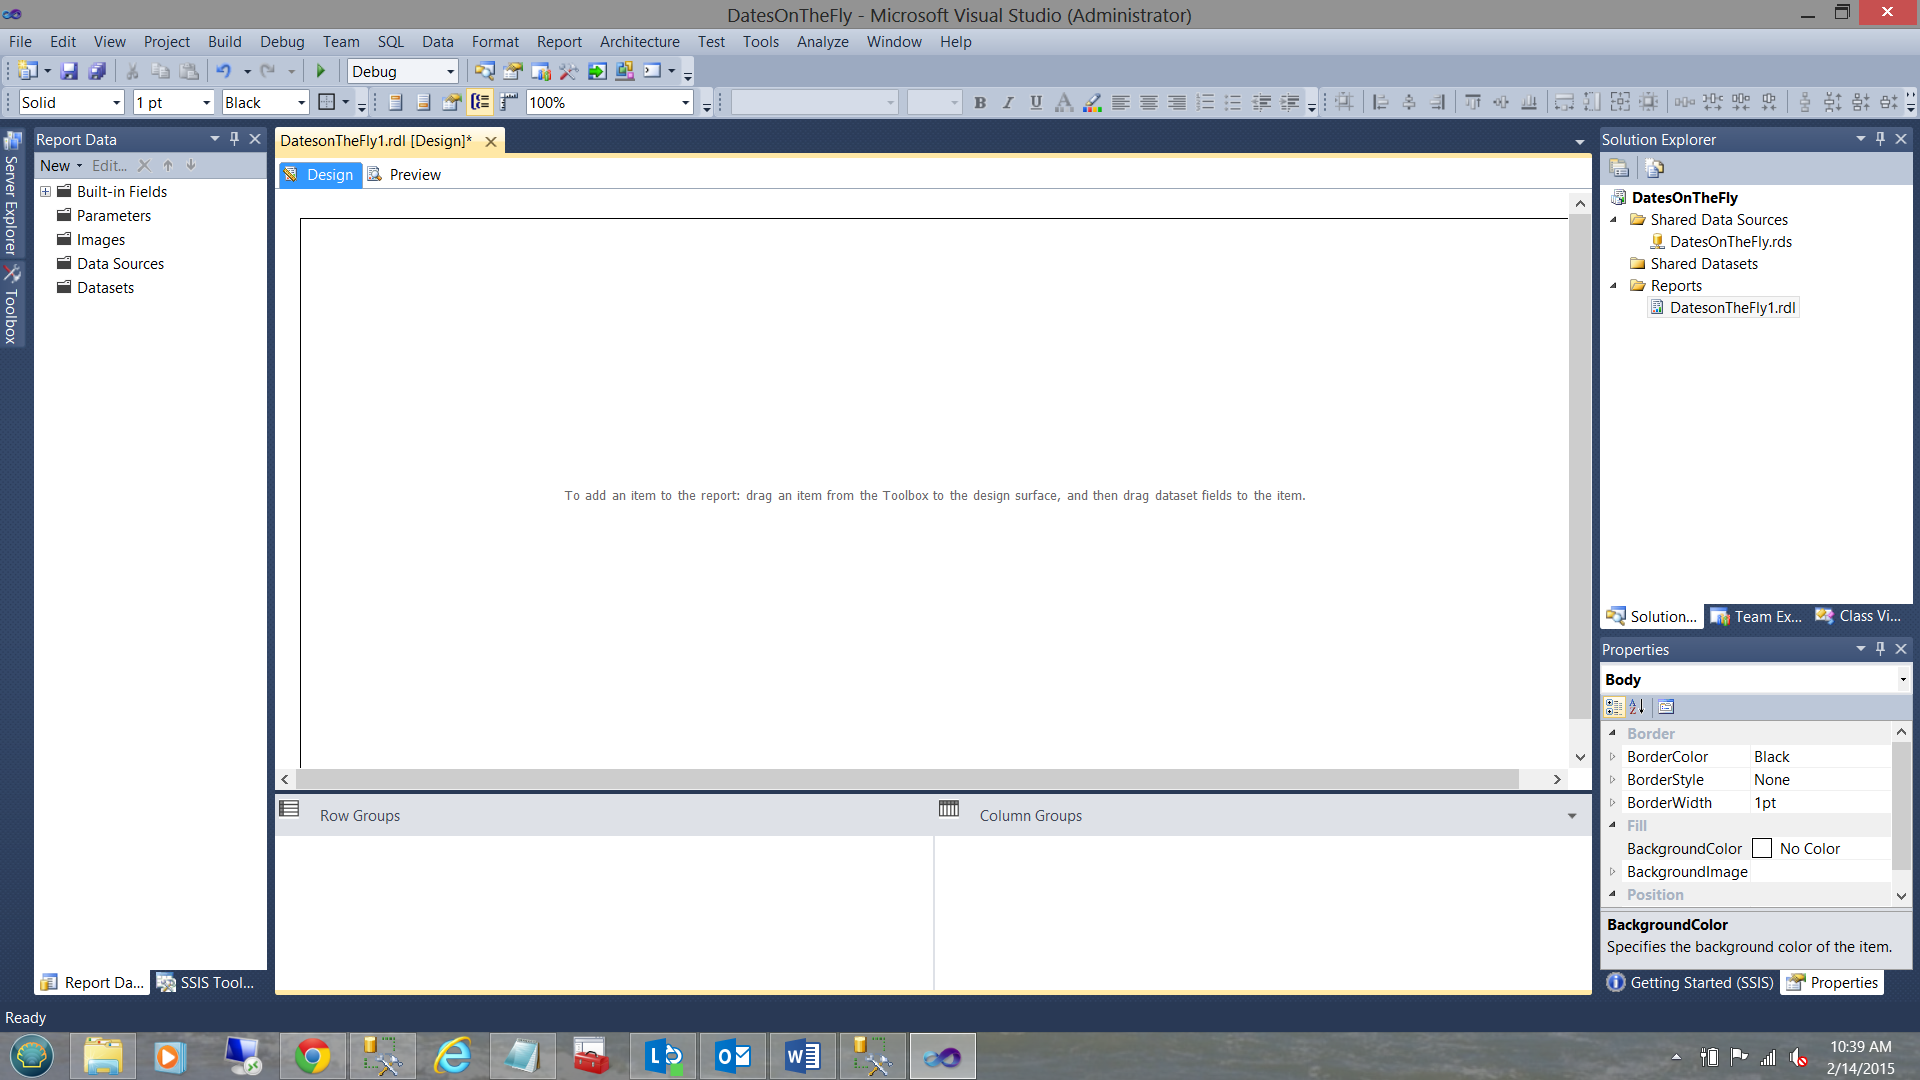
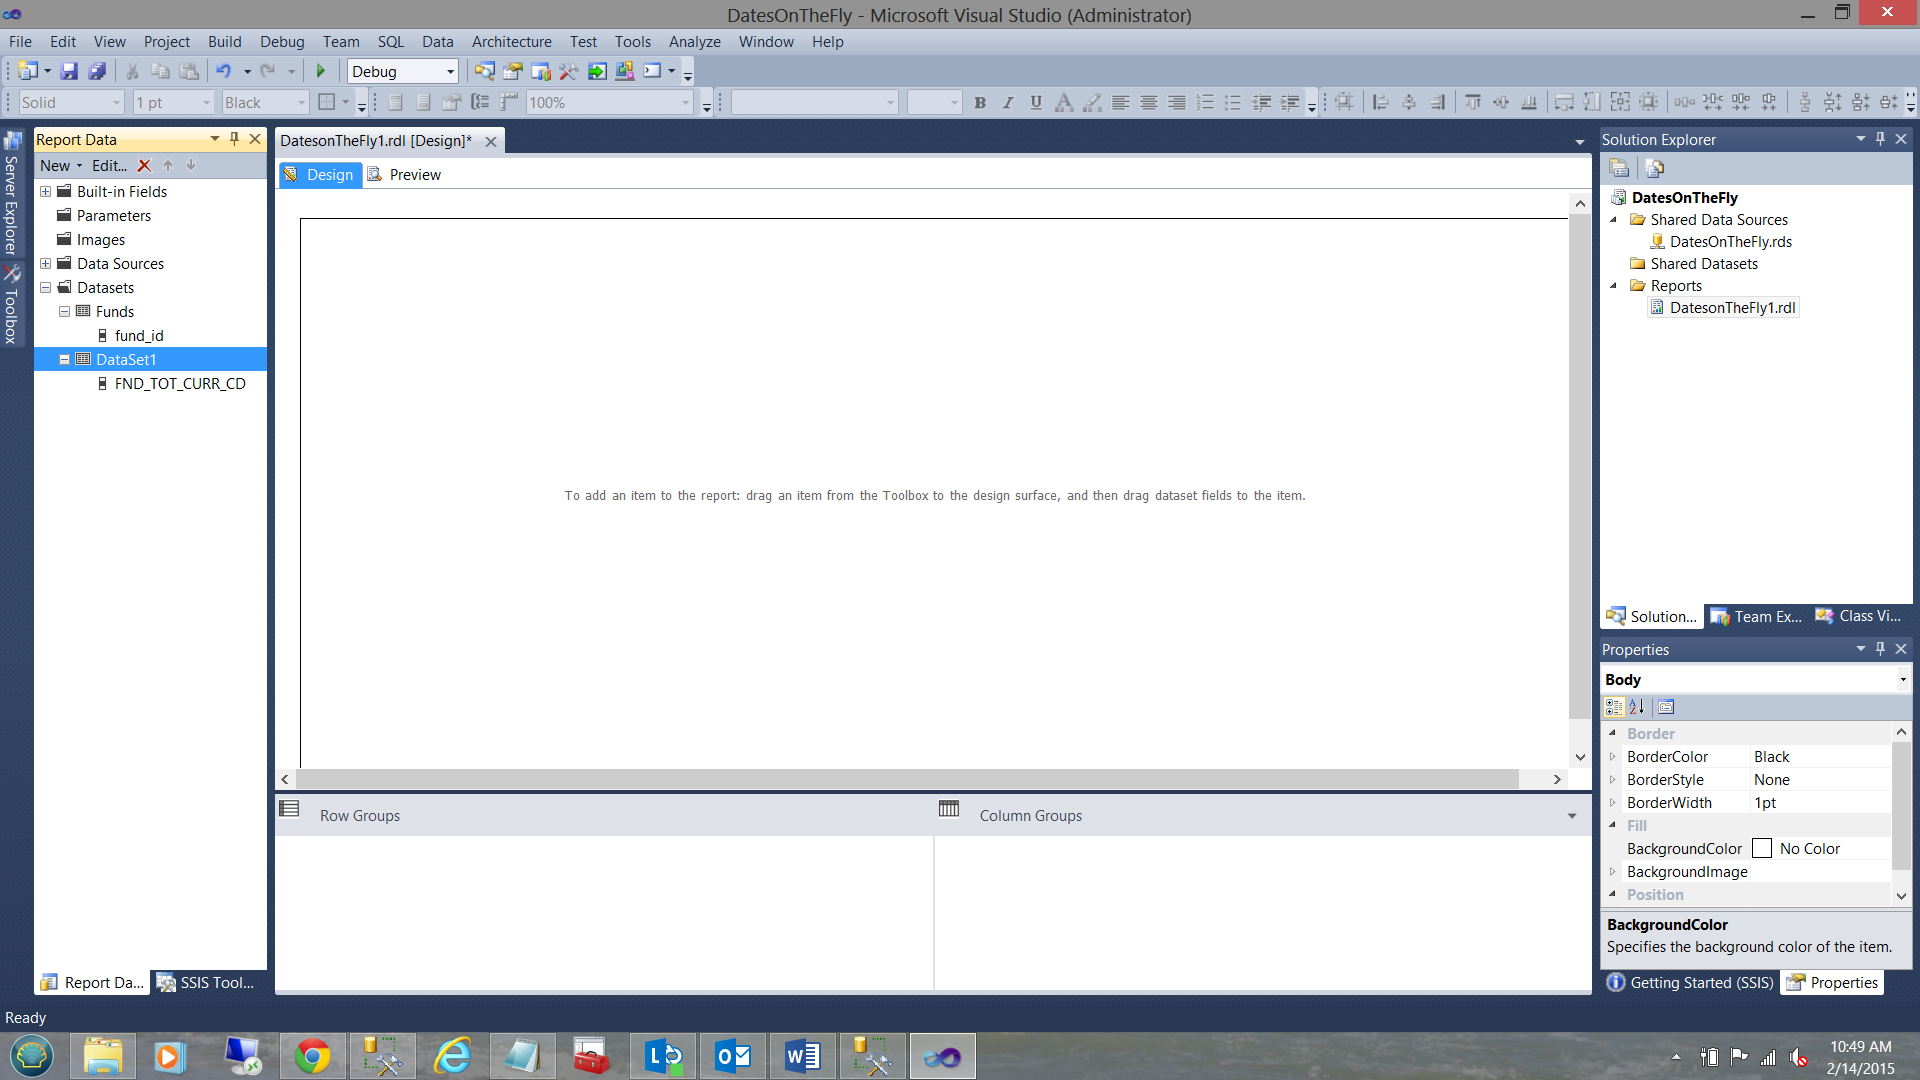
We now find ourselves on our report surface.
We now create two datasets which will be utilized to populate the query list utilized by two parameters that we shall create in a few seconds.
The first dataset will contain a list of the unique funds within our database table.
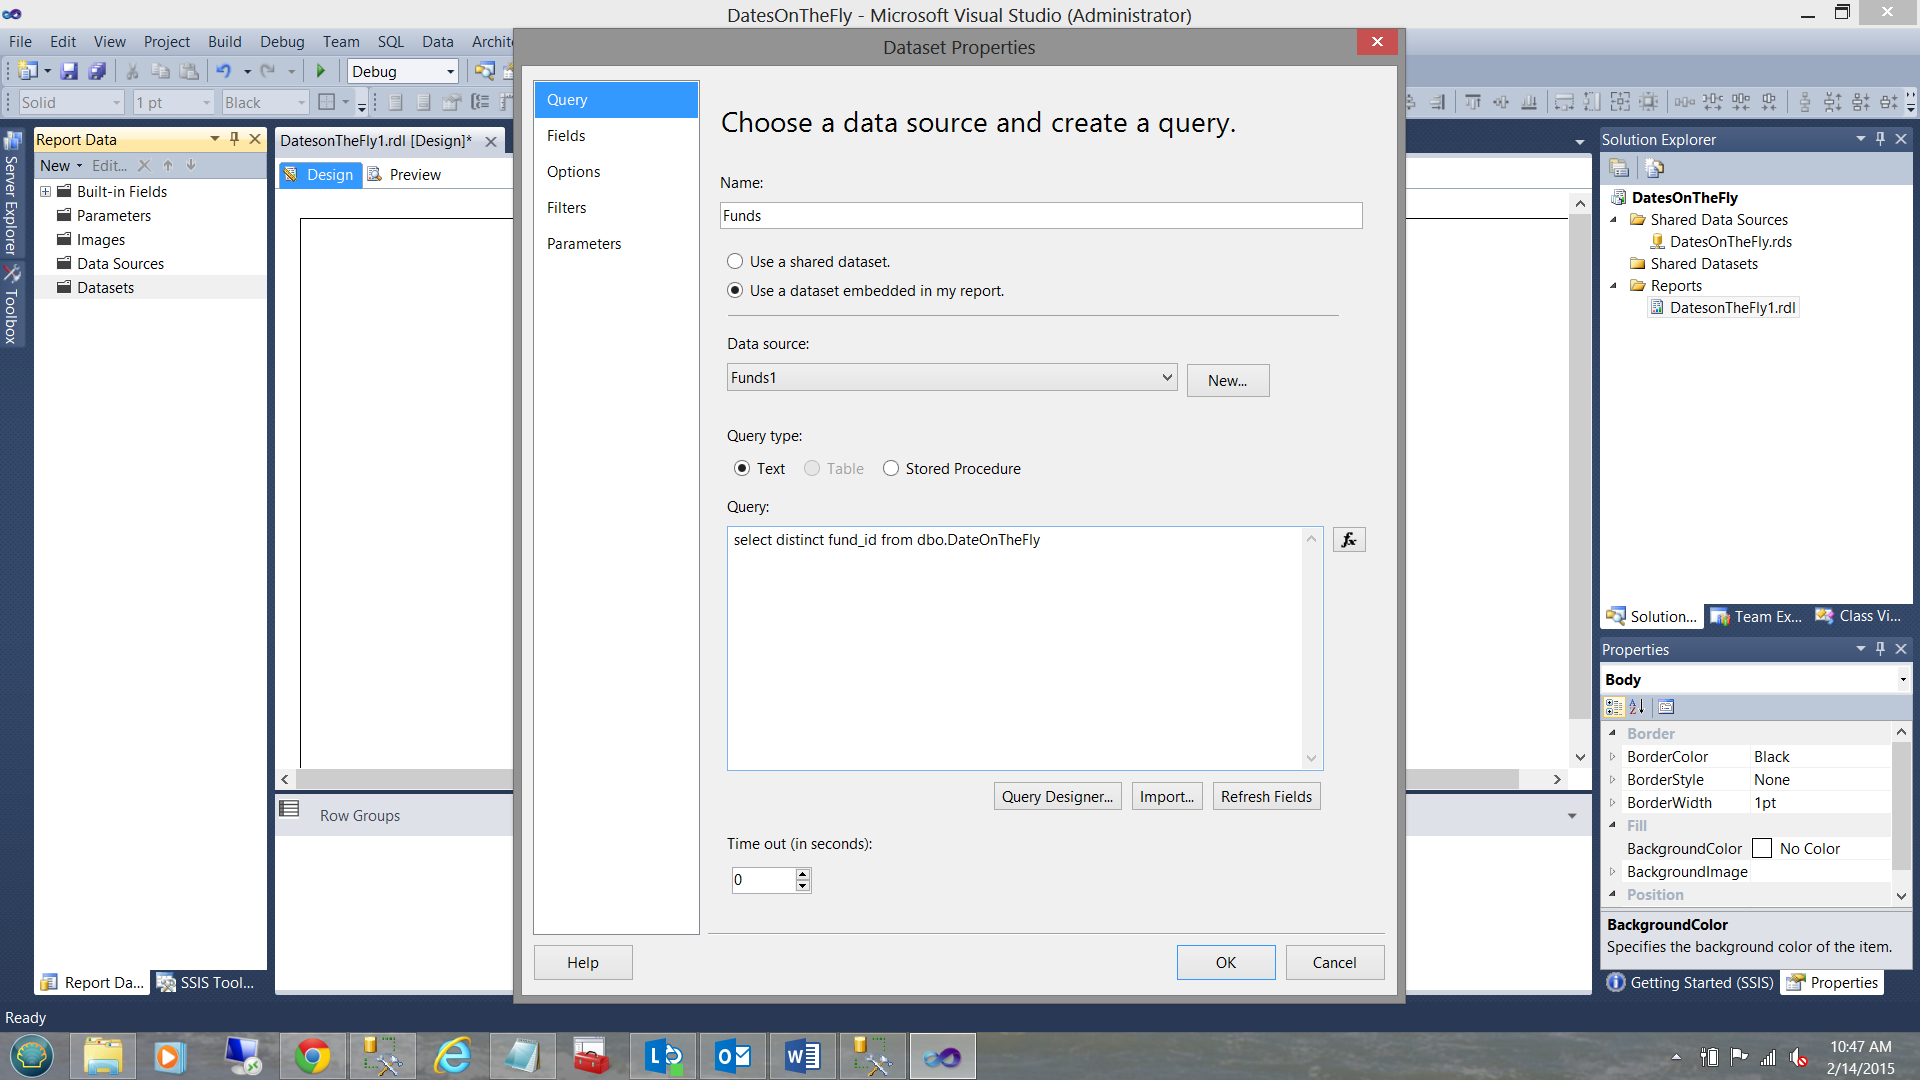
As the reader may see, we pull a distinct copy of each and every fund within the “DateOnTheFly” table.
In a similar manner, we pull distinct copies of the currency codes. Once again, these currency codes will be utilized with the parameters that the end user eventually passes to the stored procedure.
Configuring our parameters
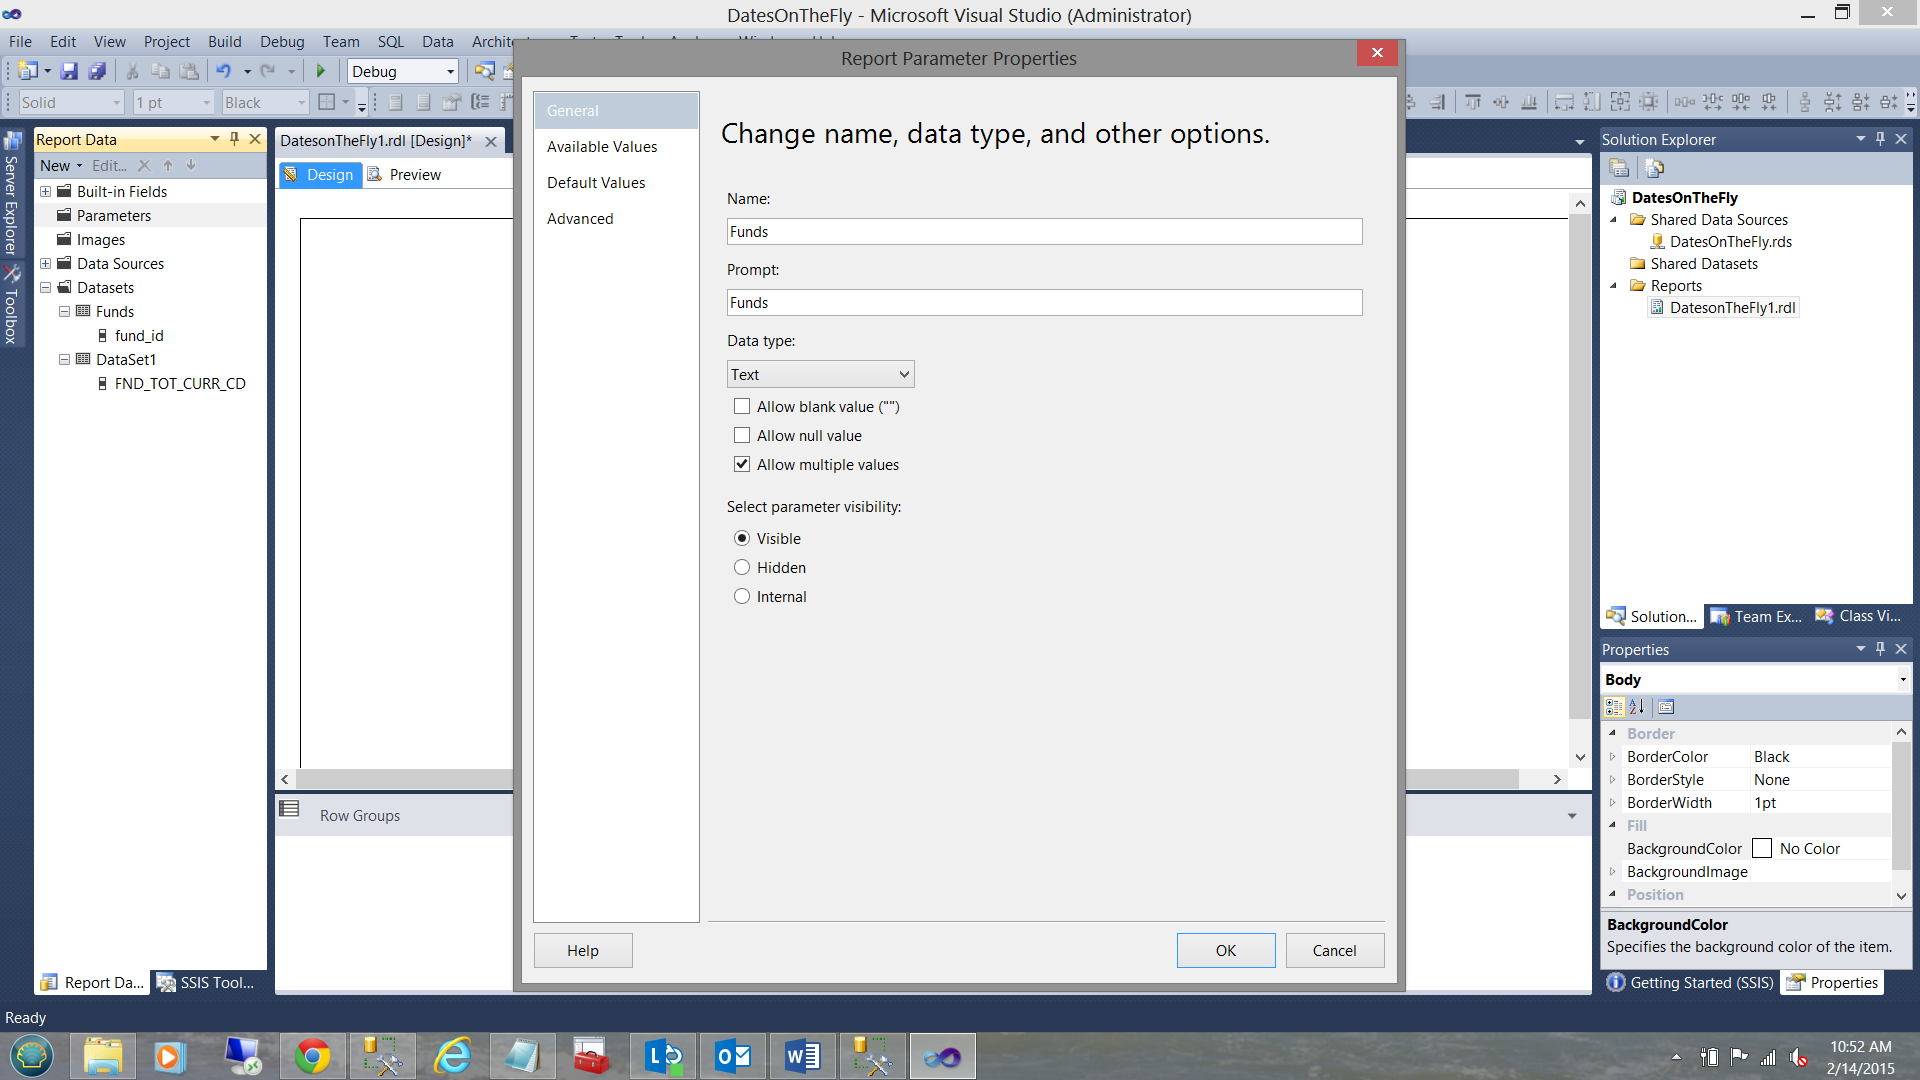
We first create a “Fund” parameter and as we want our end users to be able to select one or more values, we check the “Allow multiple values” checkbox.
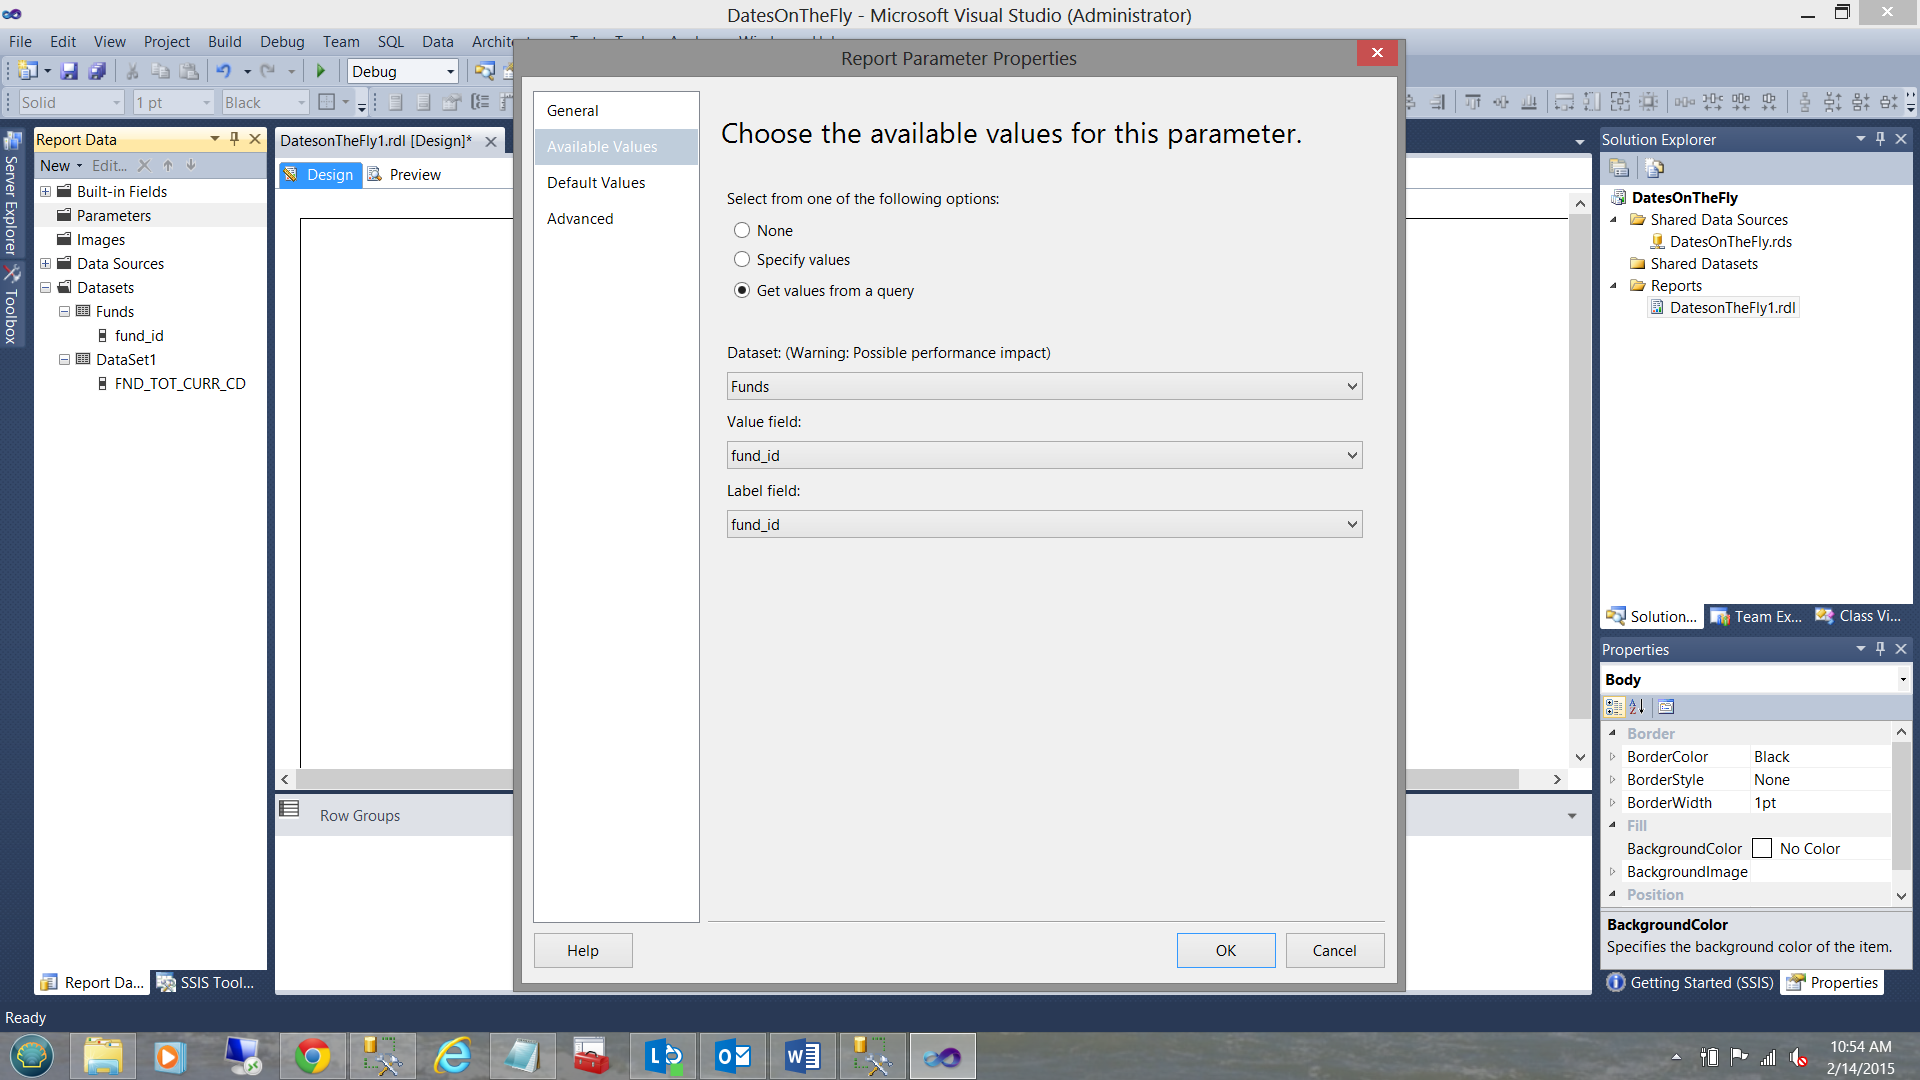
On the available values box, we select “Get values from a query” and select our “Funds” dataset. We click OK to exit the “Report Parameter Properties” dialog box.

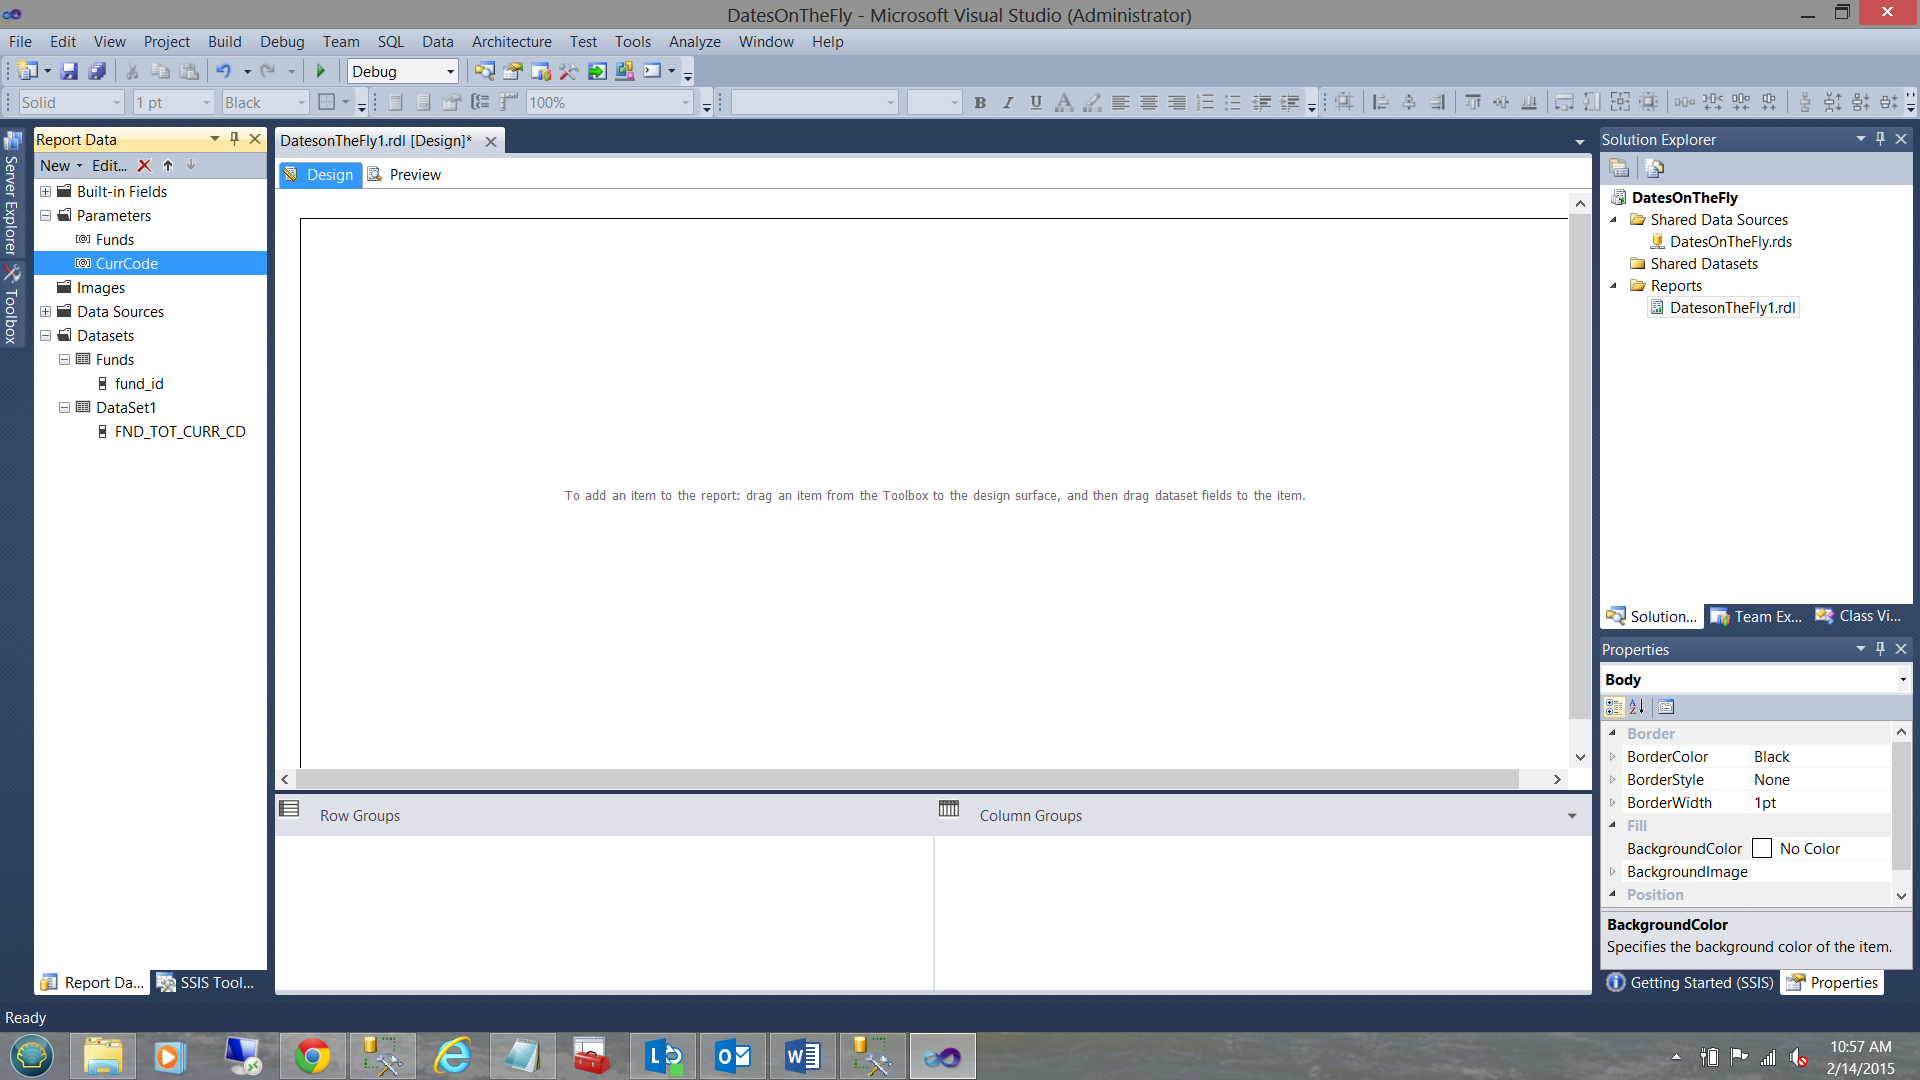
In a similar fashion we create our “CurrCode” Parameter (see below).
Our next task is to construct a dataset to contain our financial data.
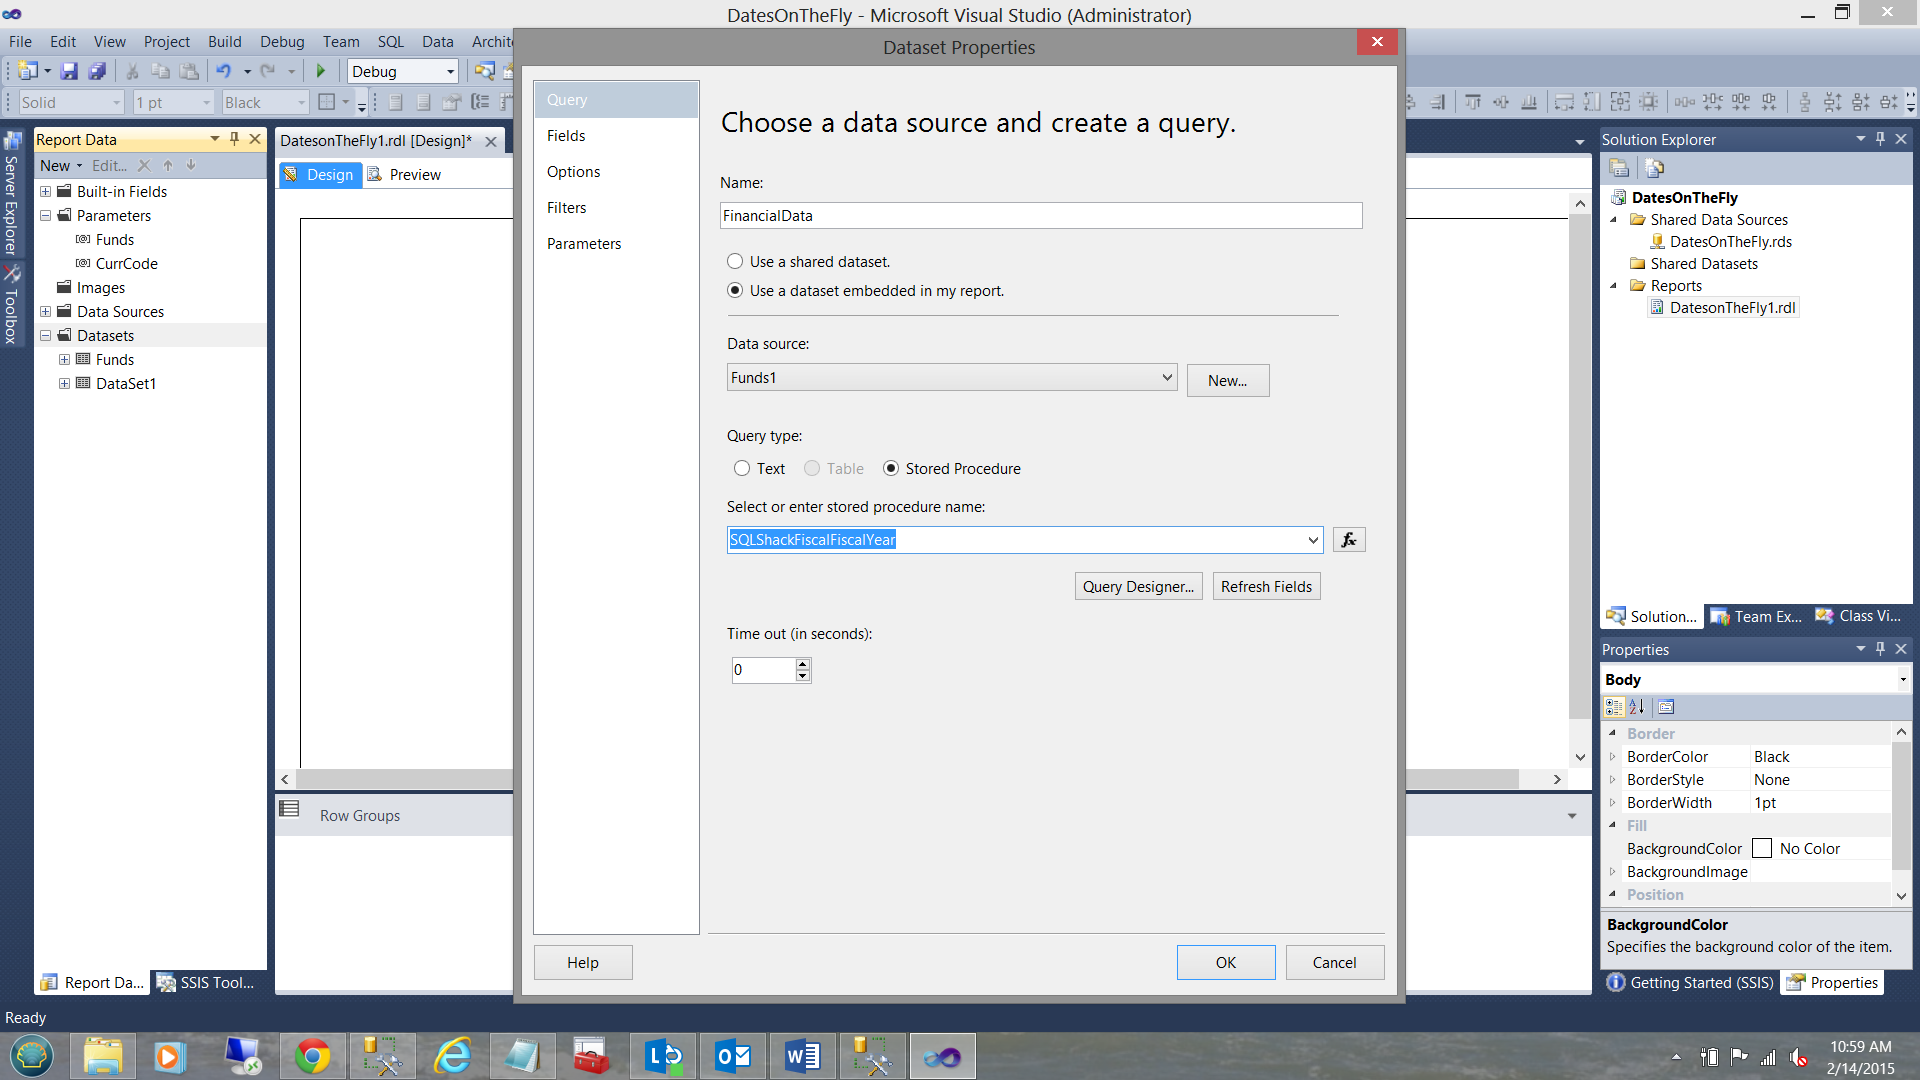
Having converted the query in Addenda 2 to a stored procedure (see Addenda3), we utilize this stored procedure to pull our data.
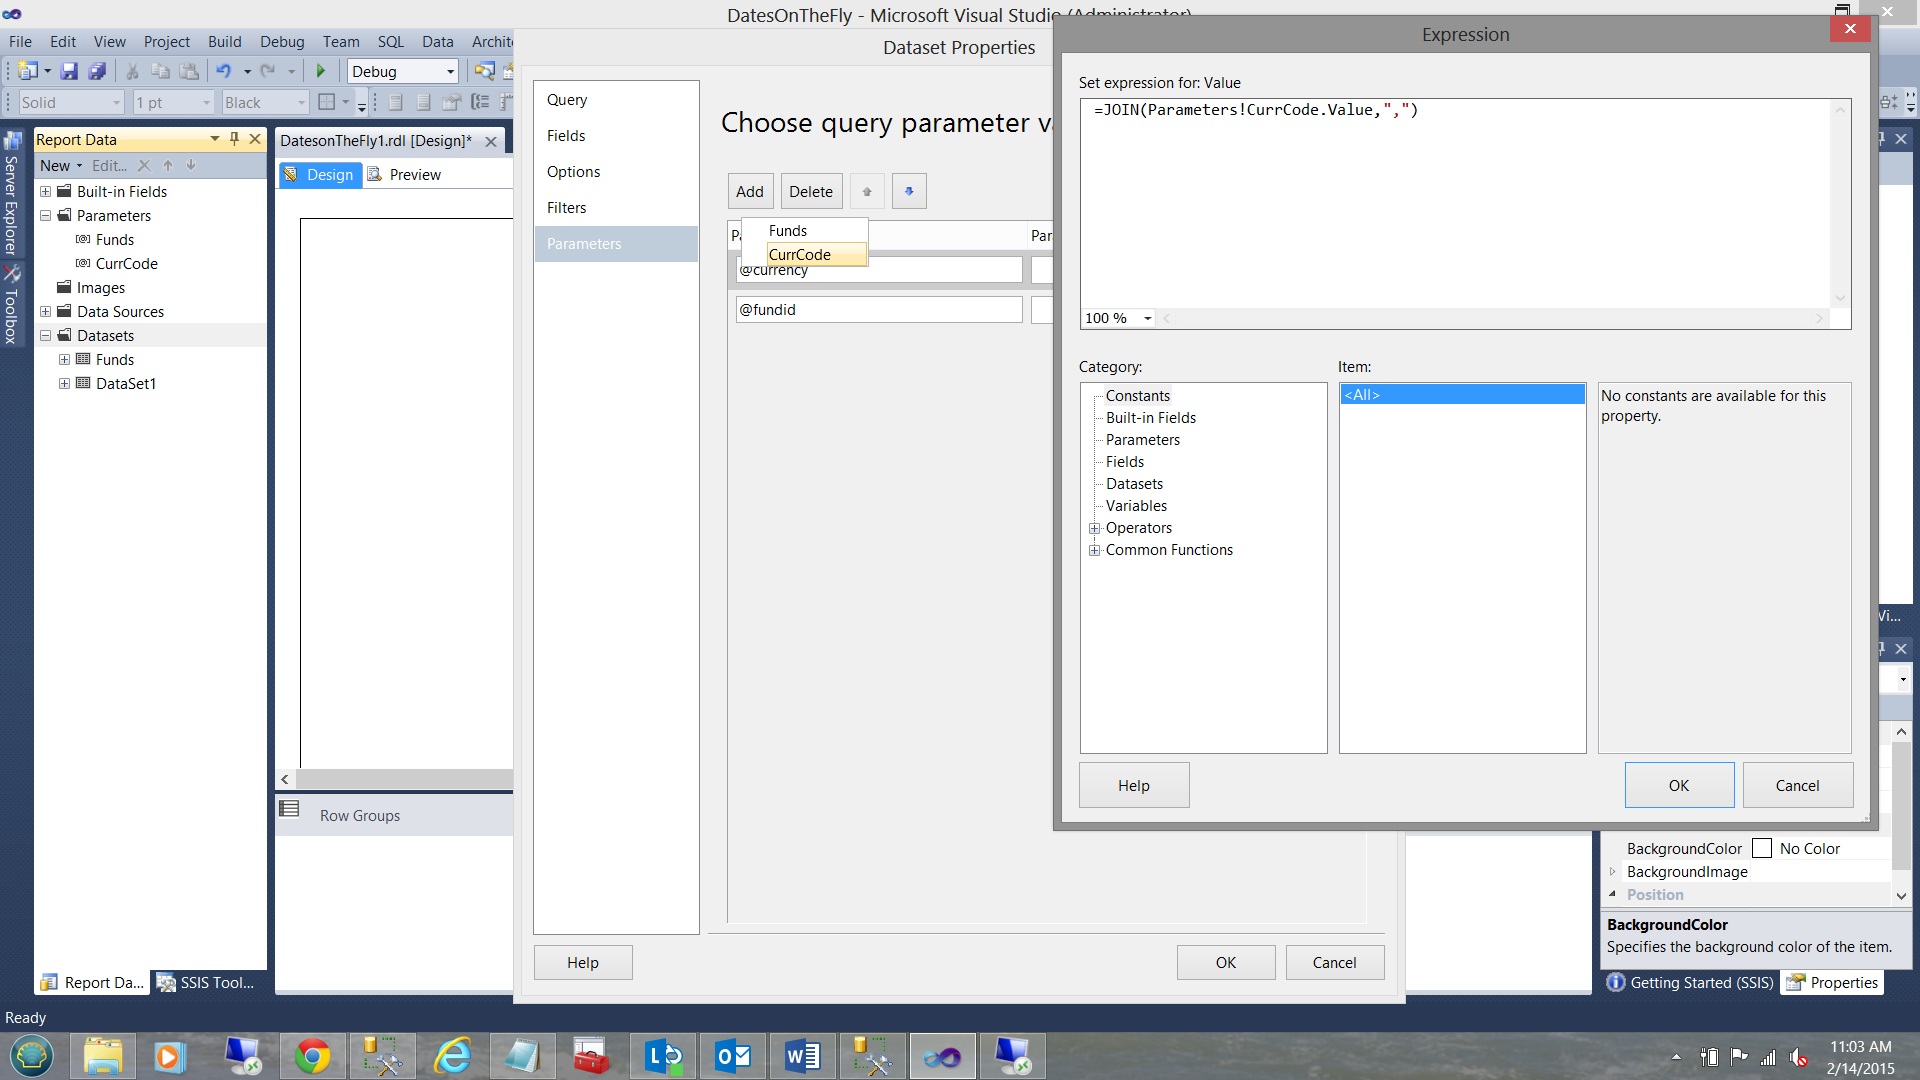
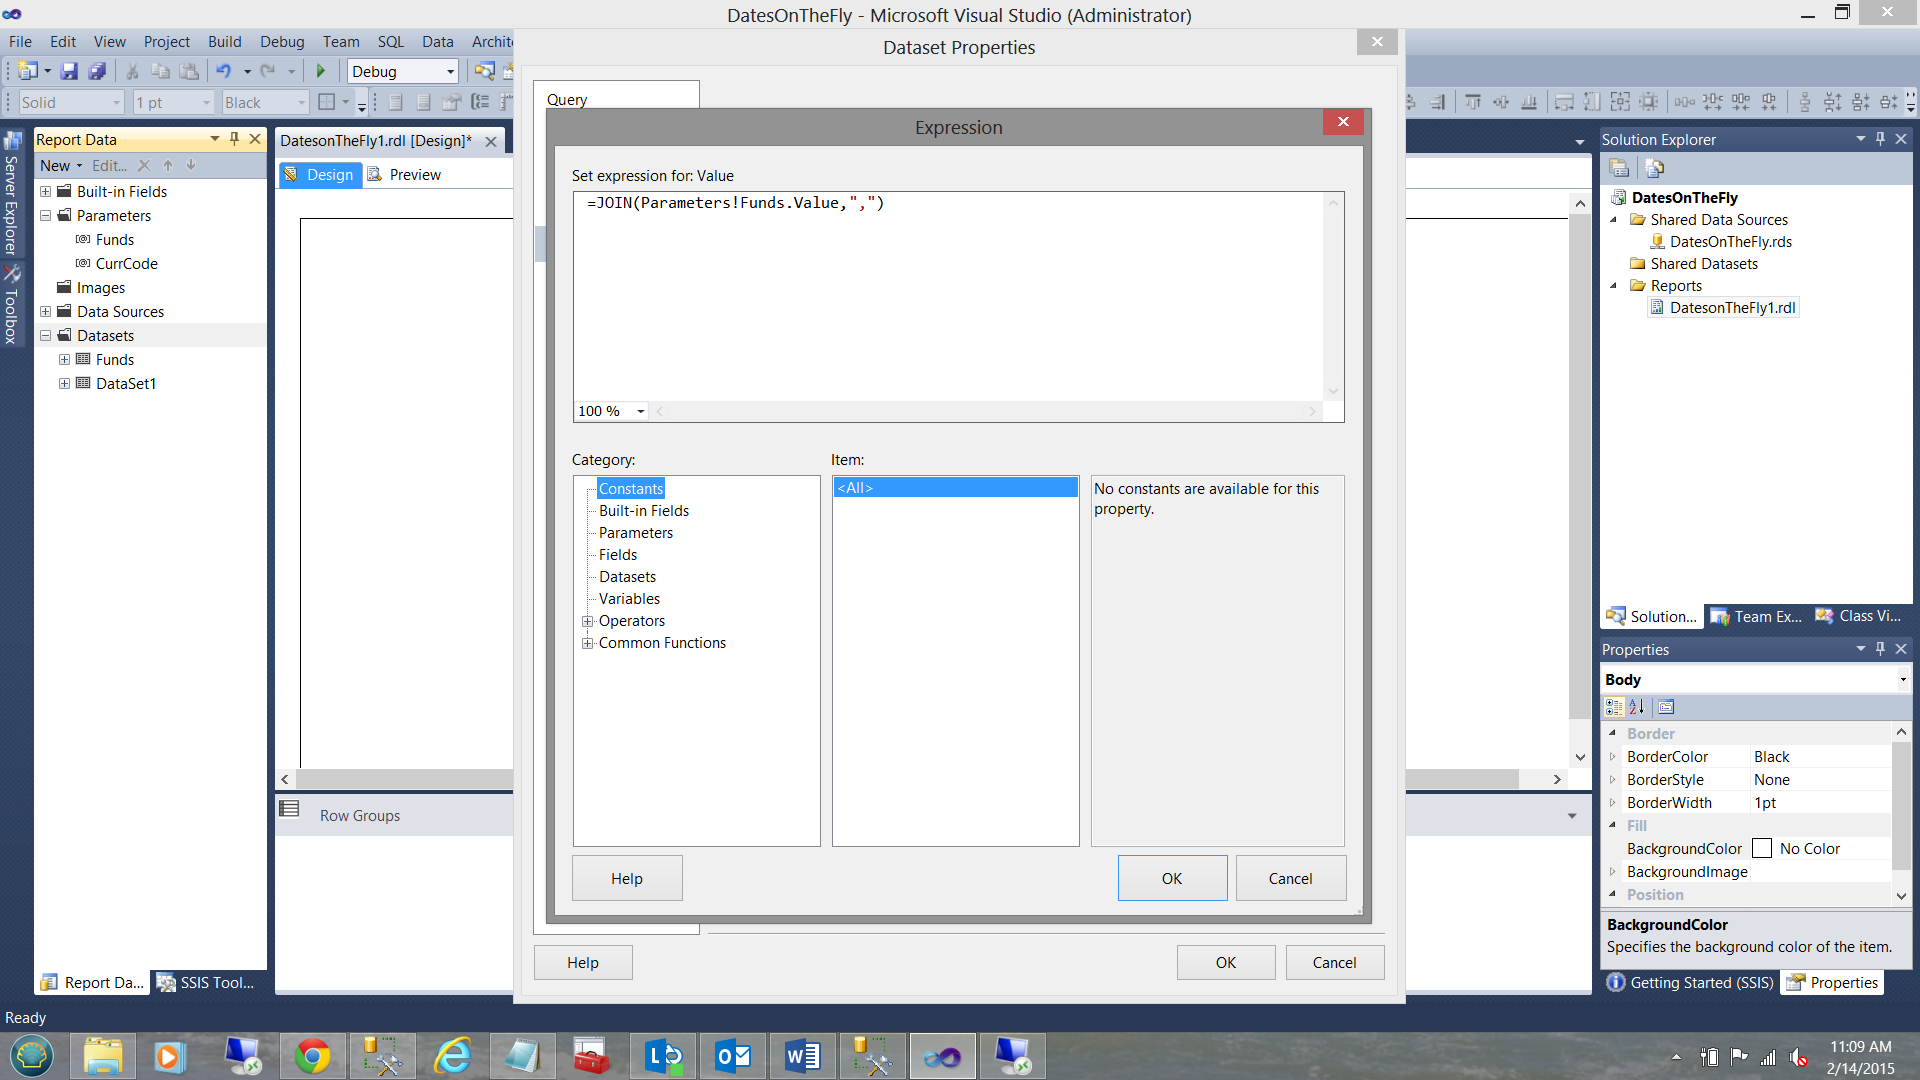
Having configured our dataset to utilize the stored procedure “SQLShackFiscalFiscalYear”, we must now configure the two parameters that are passed to the stored procedure (in order to populate the dataset at runtime). The issue is that we set the parameter to accept multiple values to be sent to the stored procedure. This required concatenating the individual values into a string. This is achieved in by utilizing the “JOIN” statement as may be seen above. A code snippet may be seen below.
|
1 2 3 |
=JOIN(Parameters!CurrCode.Value,",") |
The “Funds” parameter is set up in a similar fashion (see above).
As with everything else, code changes!!
In order for our store procedure (see Addenda 3) to correctly handle Reporting Services multiple selects we need to add two small additional code snippets.
Fund
|
1 2 3 4 5 6 7 8 9 10 11 12 13 14 15 16 17 18 19 20 21 22 23 24 25 26 27 28 29 30 |
-- Split the Fund string declare @Comma CHAR(1) declare @Fund table ( fundid varchar(8) NOT NULL ) Set @Comma = ',' BEGIN DECLARE @Position INT DECLARE @Substringg VARCHAR(8000) SELECT @Position =1 IF (LEN(@fundid)<1) OR @fundid IS NULL RETURN WHILE @Position!=0 BEGIN SET @Position=CHARINDEX(@Comma,@fundid) IF @Position<>0 SET @Substringg=LEFT(@fundid,@Position-1) ELSE SET @Substringg=@fundid IF(LEN(@Substringg)>0) INSERT INTO @Fund(fundid) VALUES(RTRIM(LTRIM(@Substringg))) SET @fundid=RIGHT(@fundid,LEN(@fundid)-@Position) IF LEN(@fundid)=0 BREAK END select fundid as [fundid] Into #fund from @fund END |
CurrencyCode
|
1 2 3 4 5 6 7 8 9 10 11 12 13 14 15 16 17 18 19 20 21 22 23 24 25 26 27 28 29 30 31 |
-- Split the Currency Code string --If we wish to use @Position again as a marker we need to re-initialize it Set @Position = 0 Set @Substringg = '' declare @Currency1 table ( Currency varchar(8) NOT NULL ) Set @Comma = ',' BEGIN --DECLARE @Position INT --DECLARE @Substringg VARCHAR(8000) SELECT @Position =1 IF (LEN(@currency)<1) OR @currency IS NULL RETURN WHILE @Position!=0 BEGIN SET @Position=CHARINDEX(@Comma,@currency) IF @Position<>0 SET @Substringg=LEFT(@currency,@Position-1) ELSE SET @Substringg=@currency IF(LEN(@Substringg)>0) INSERT INTO @currency1 (currency) VALUES(RTRIM(LTRIM(@Substringg))) SET @currency =RIGHT(@currency,LEN(@currency)-@Position) IF LEN(@currency)=0 BREAK END select currency as [currency] Into #currency from @currency1 END |
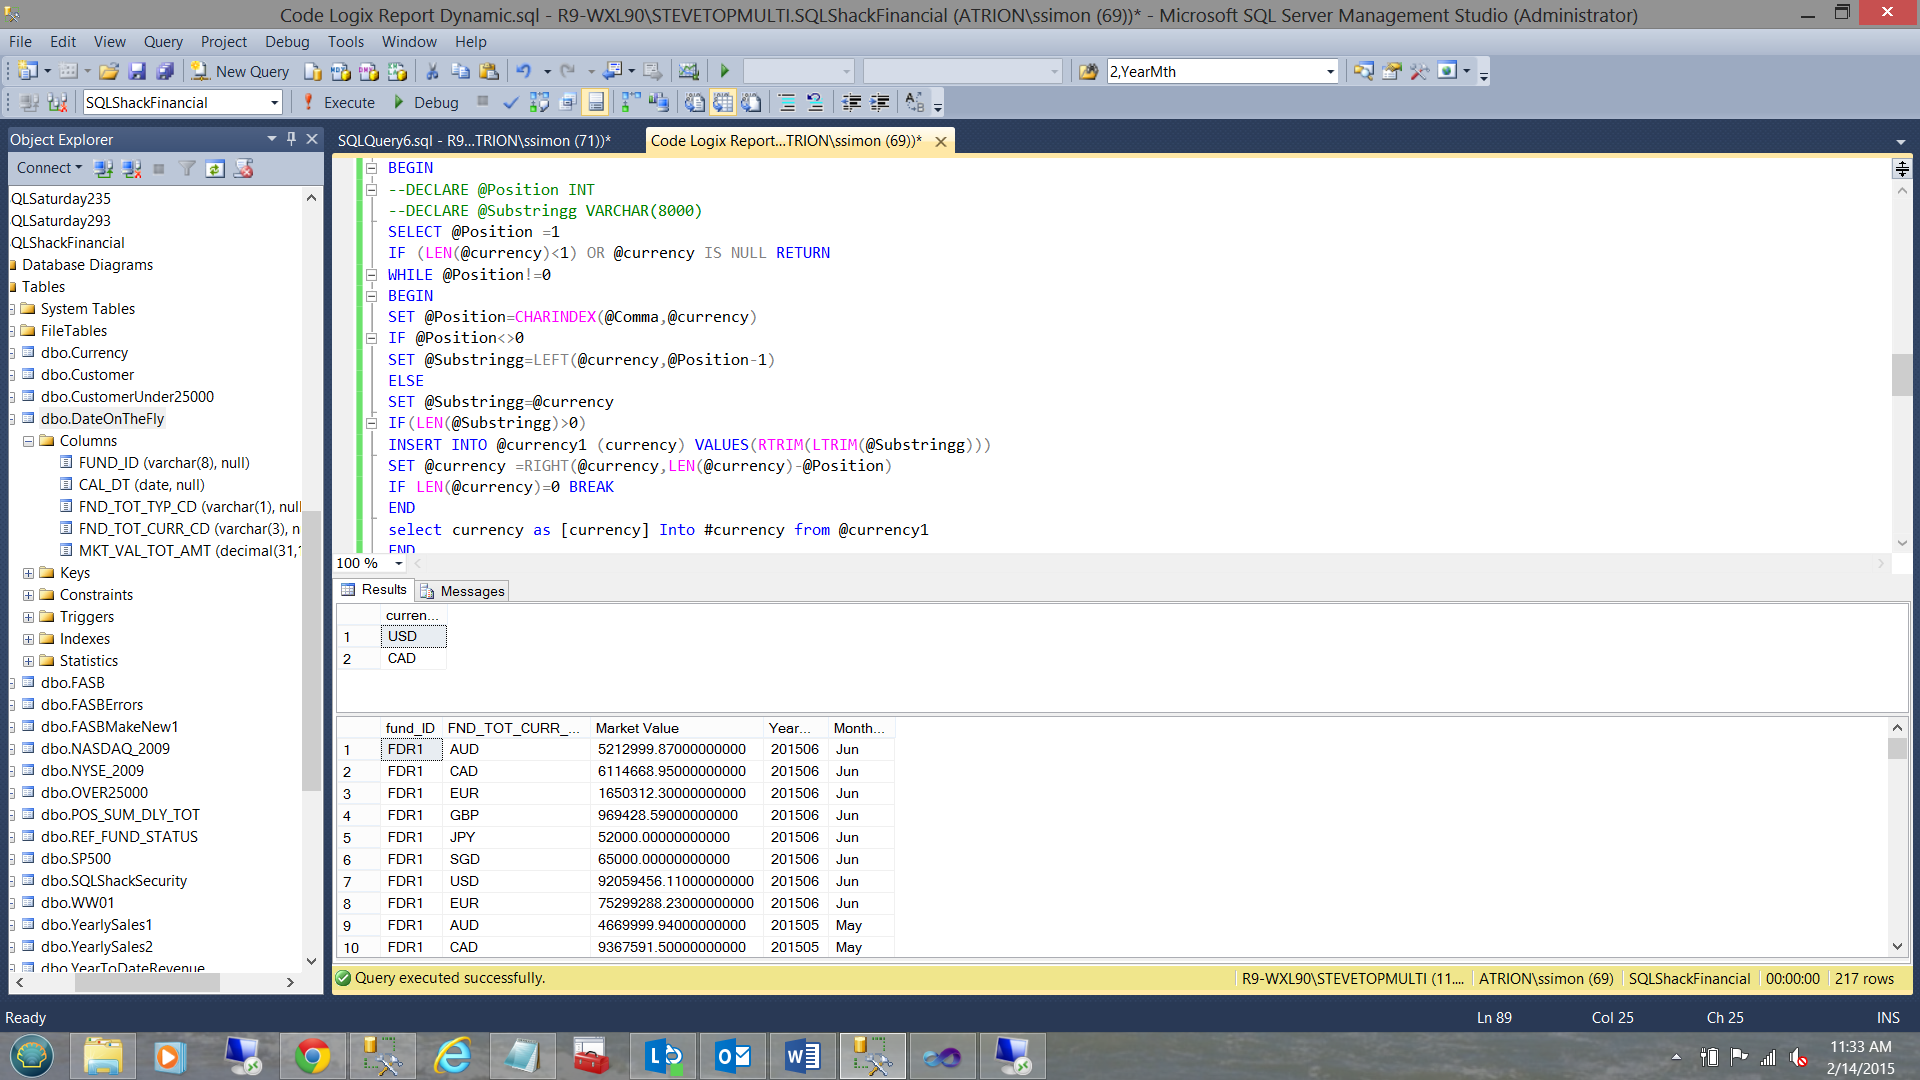
When we run our query (once again), this time including our list of funds, passed by our report, the stripping code adds each code to a table variable and when complete places the values into temporary tables. We can see the results of running the query above. Note the currency codes in the “first select” and the main results in the “second select”. NOTE that no filtering has been put in place. We are going to do this now.
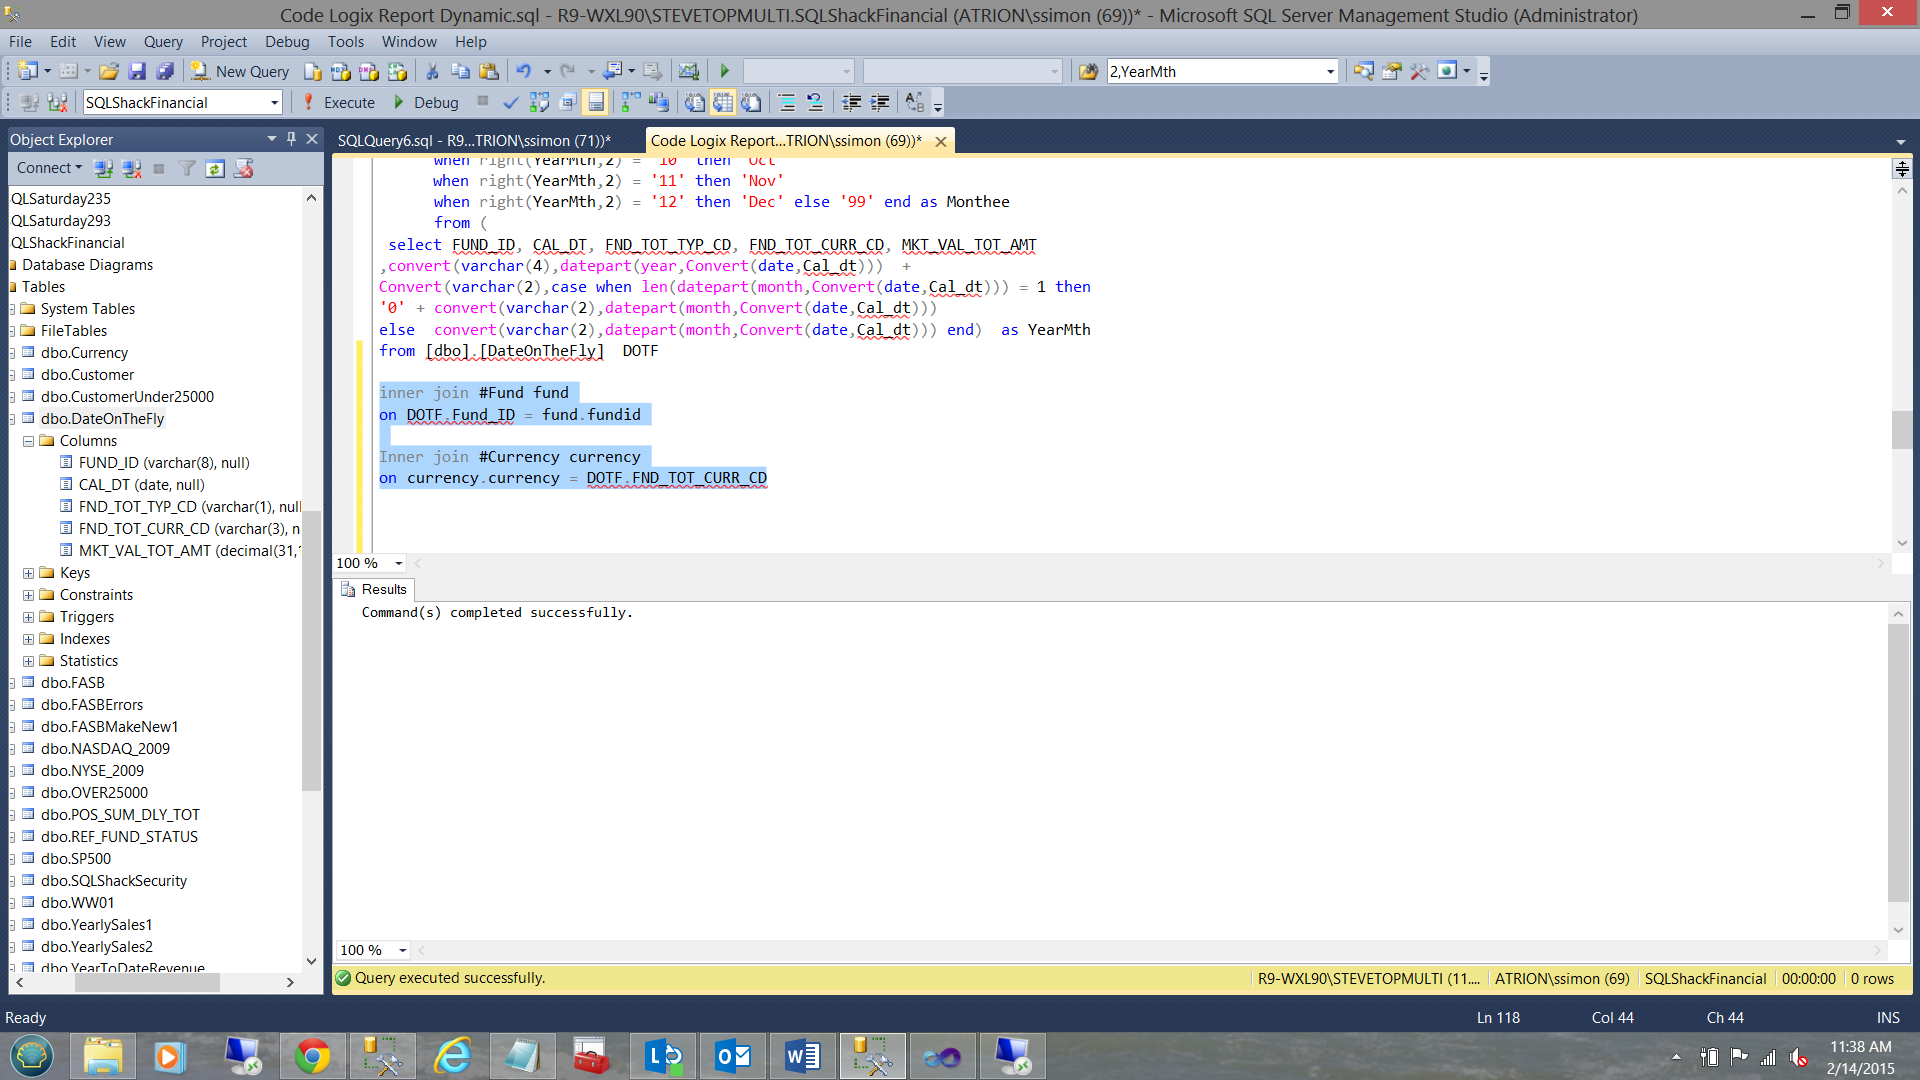
In the screenshot above, the astute reader will note that I have utilized inner joins as a filtering mechanism as opposed to saying “where fund in (‘PAT2’, ‘MIT1’) etc. There is a reason behind my madness. It is left up to the reader to postulate why. As a hint.. what will happen should the user decide to choose more than 1000 funds OR more than 1000 currency codes (if this was possible)?
Meanwhile back on our design screen
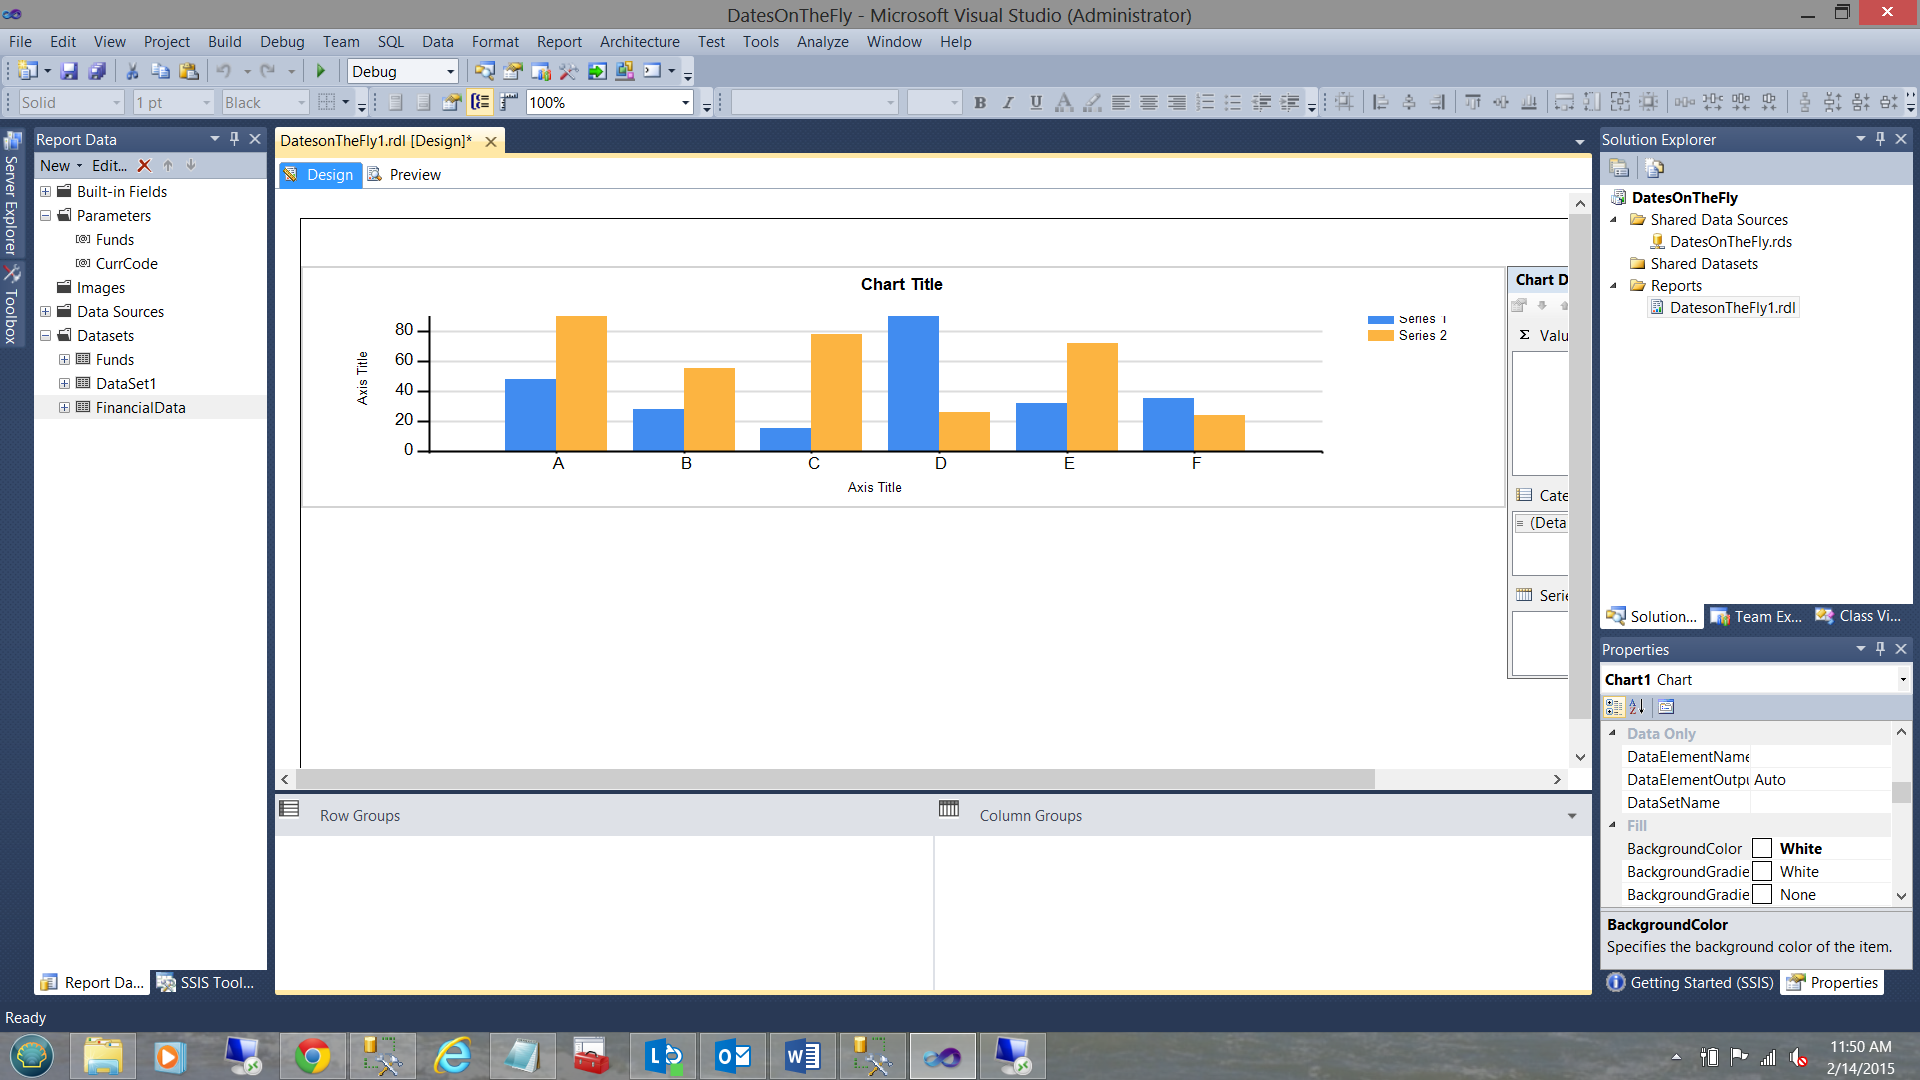
We add a chart to our drawing surface (see above).
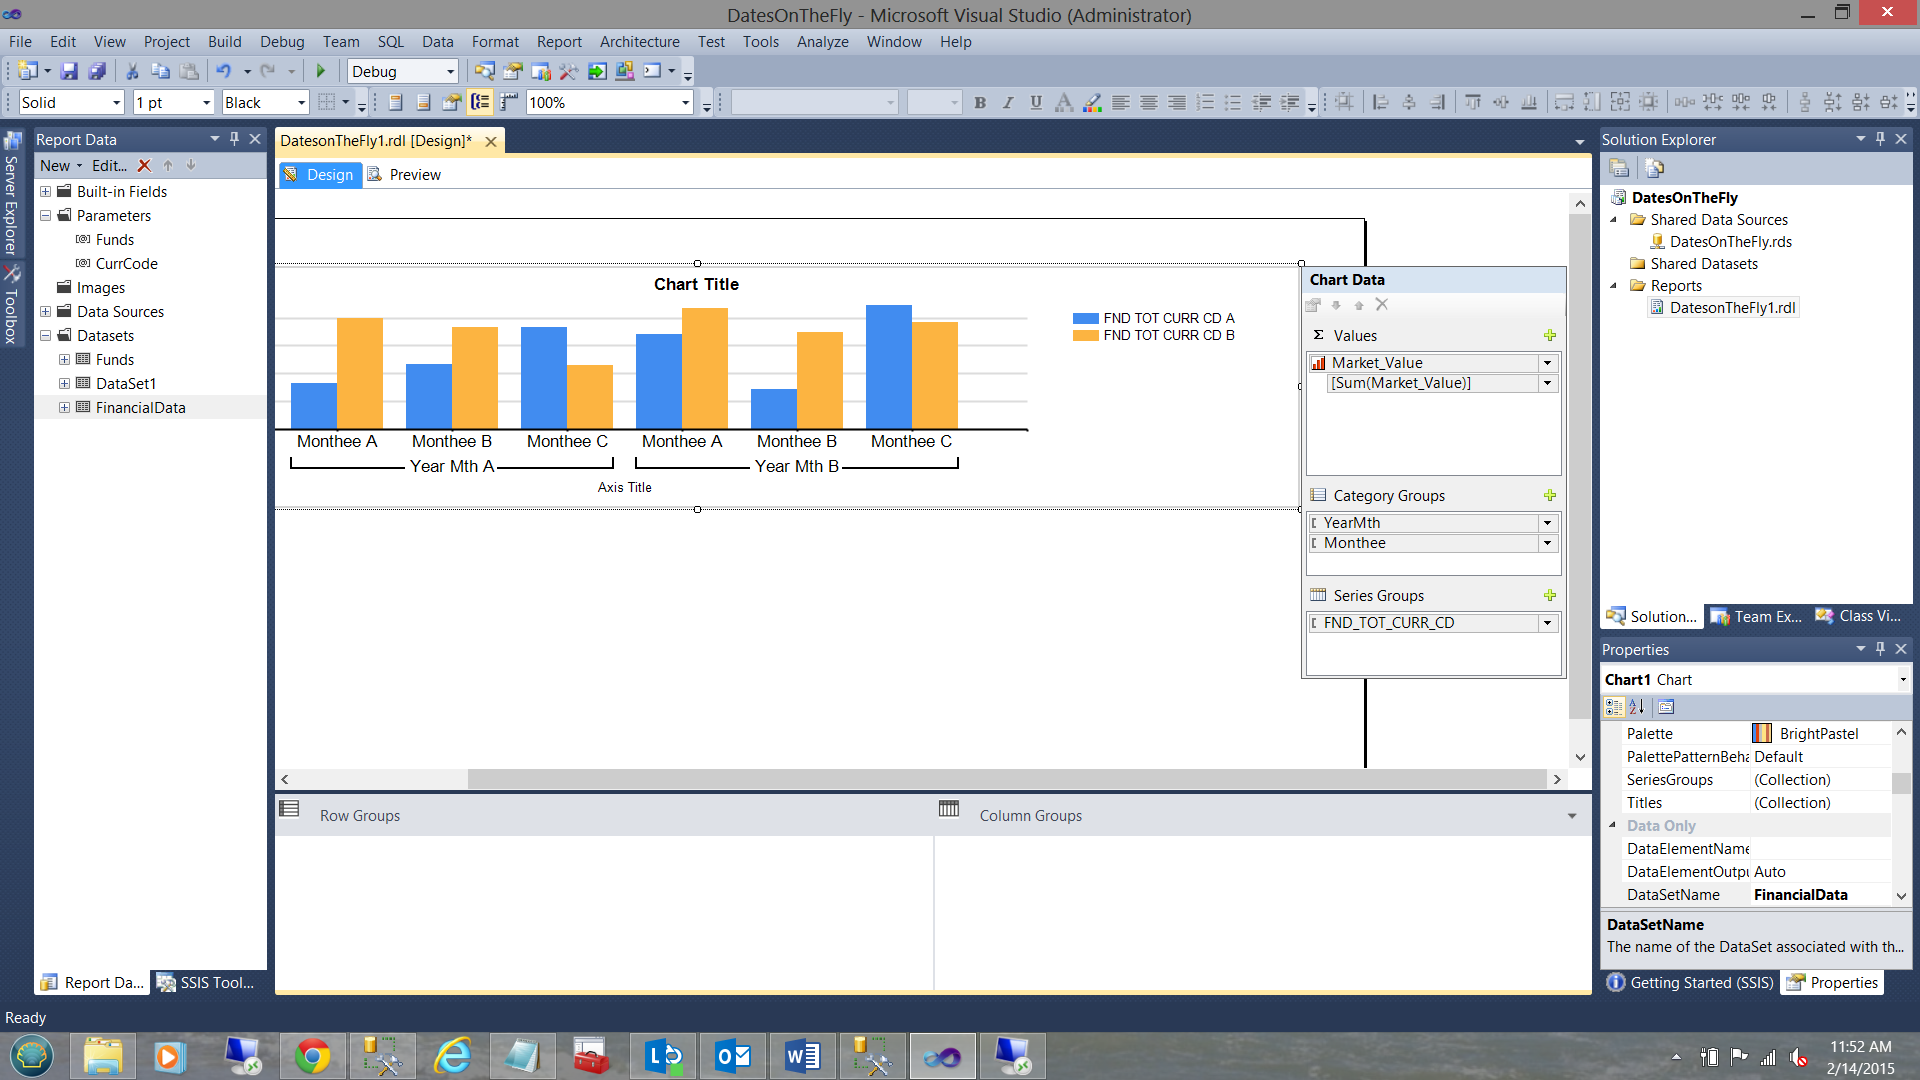
We configure our chart as follows. For the values box of the chart data, we set this to “Market Value”. For the “Category Groups”, we set this to YearMth as the sorting field. This field as discussed is used as a sort field and is HIDDEN to the user.
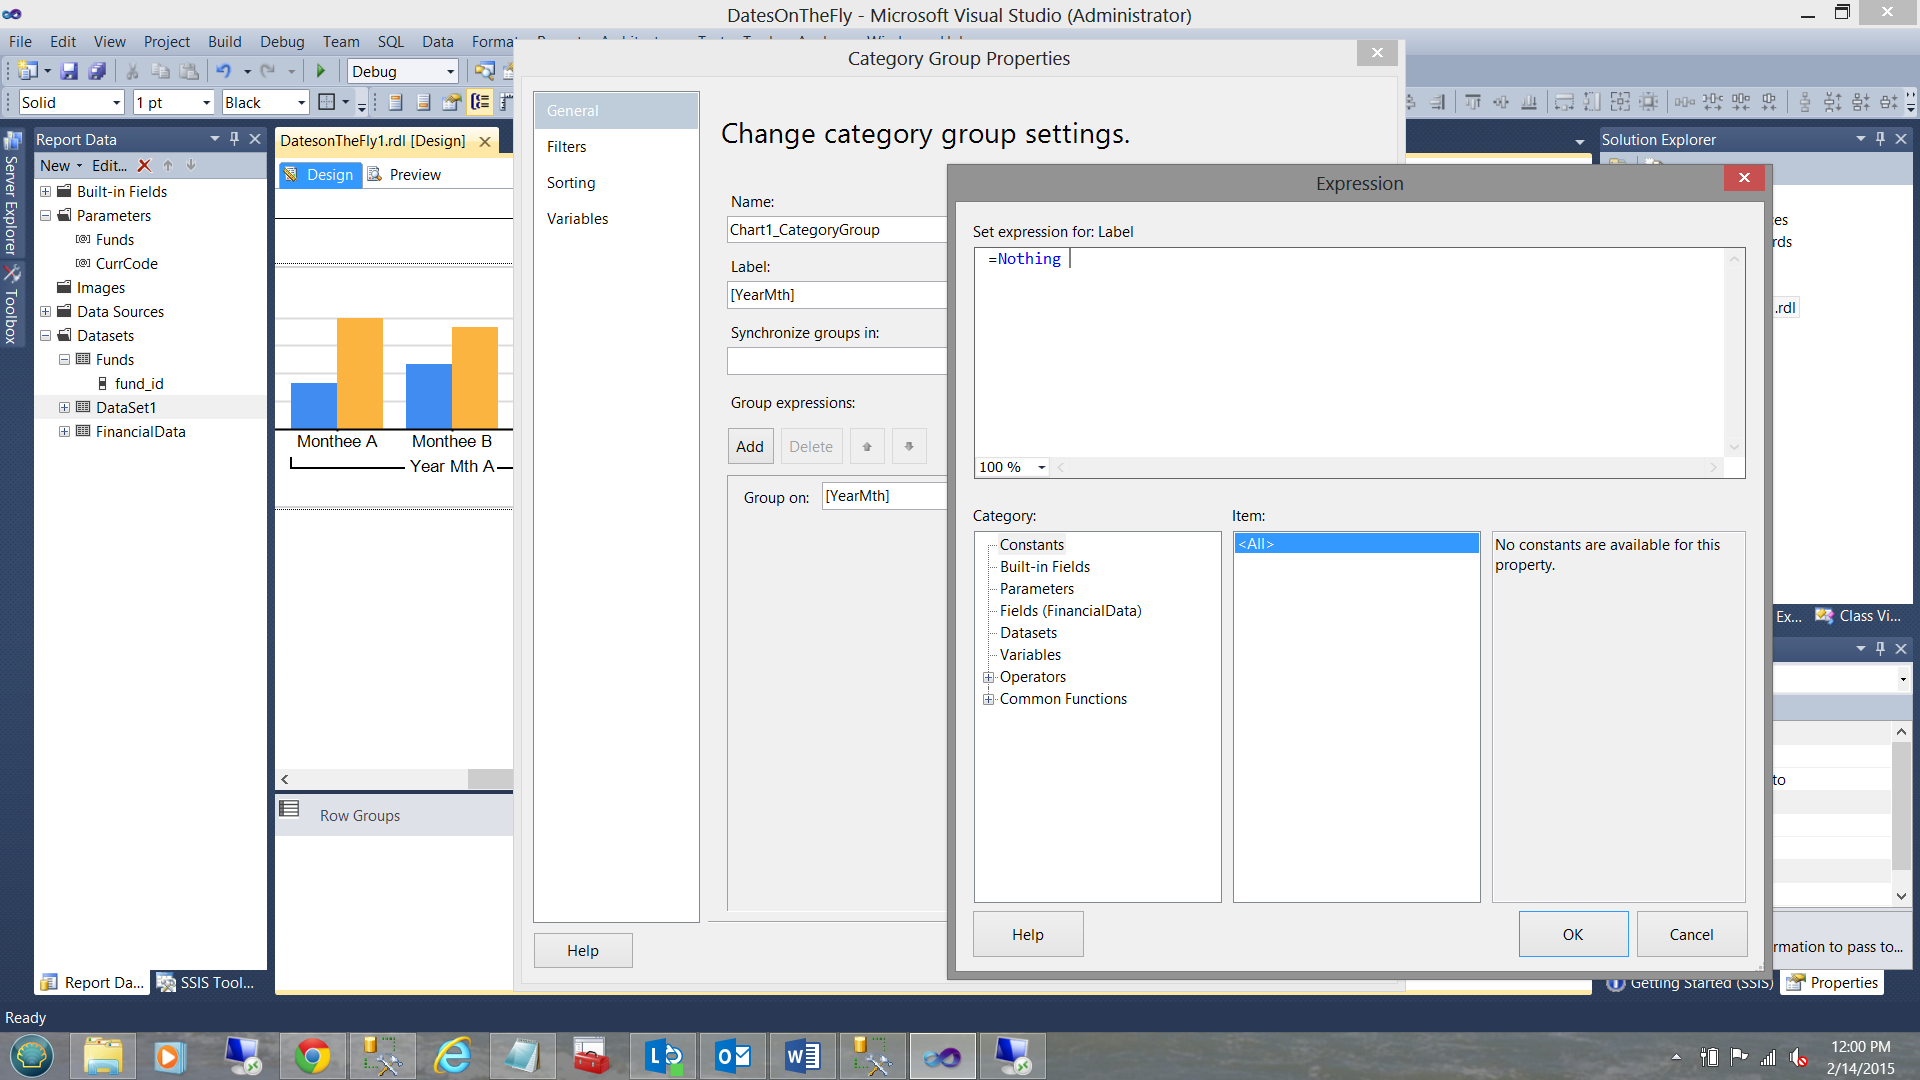
To hide this field, we change its “Label” to nothing (see above).
We also add the “Monthee” field which if we remember correctly contains the calendar month name.
Finally, we set the “Series Group” to the currency code field “FND_TOT_CURR_CD” (see above).
Let us give it a whirl
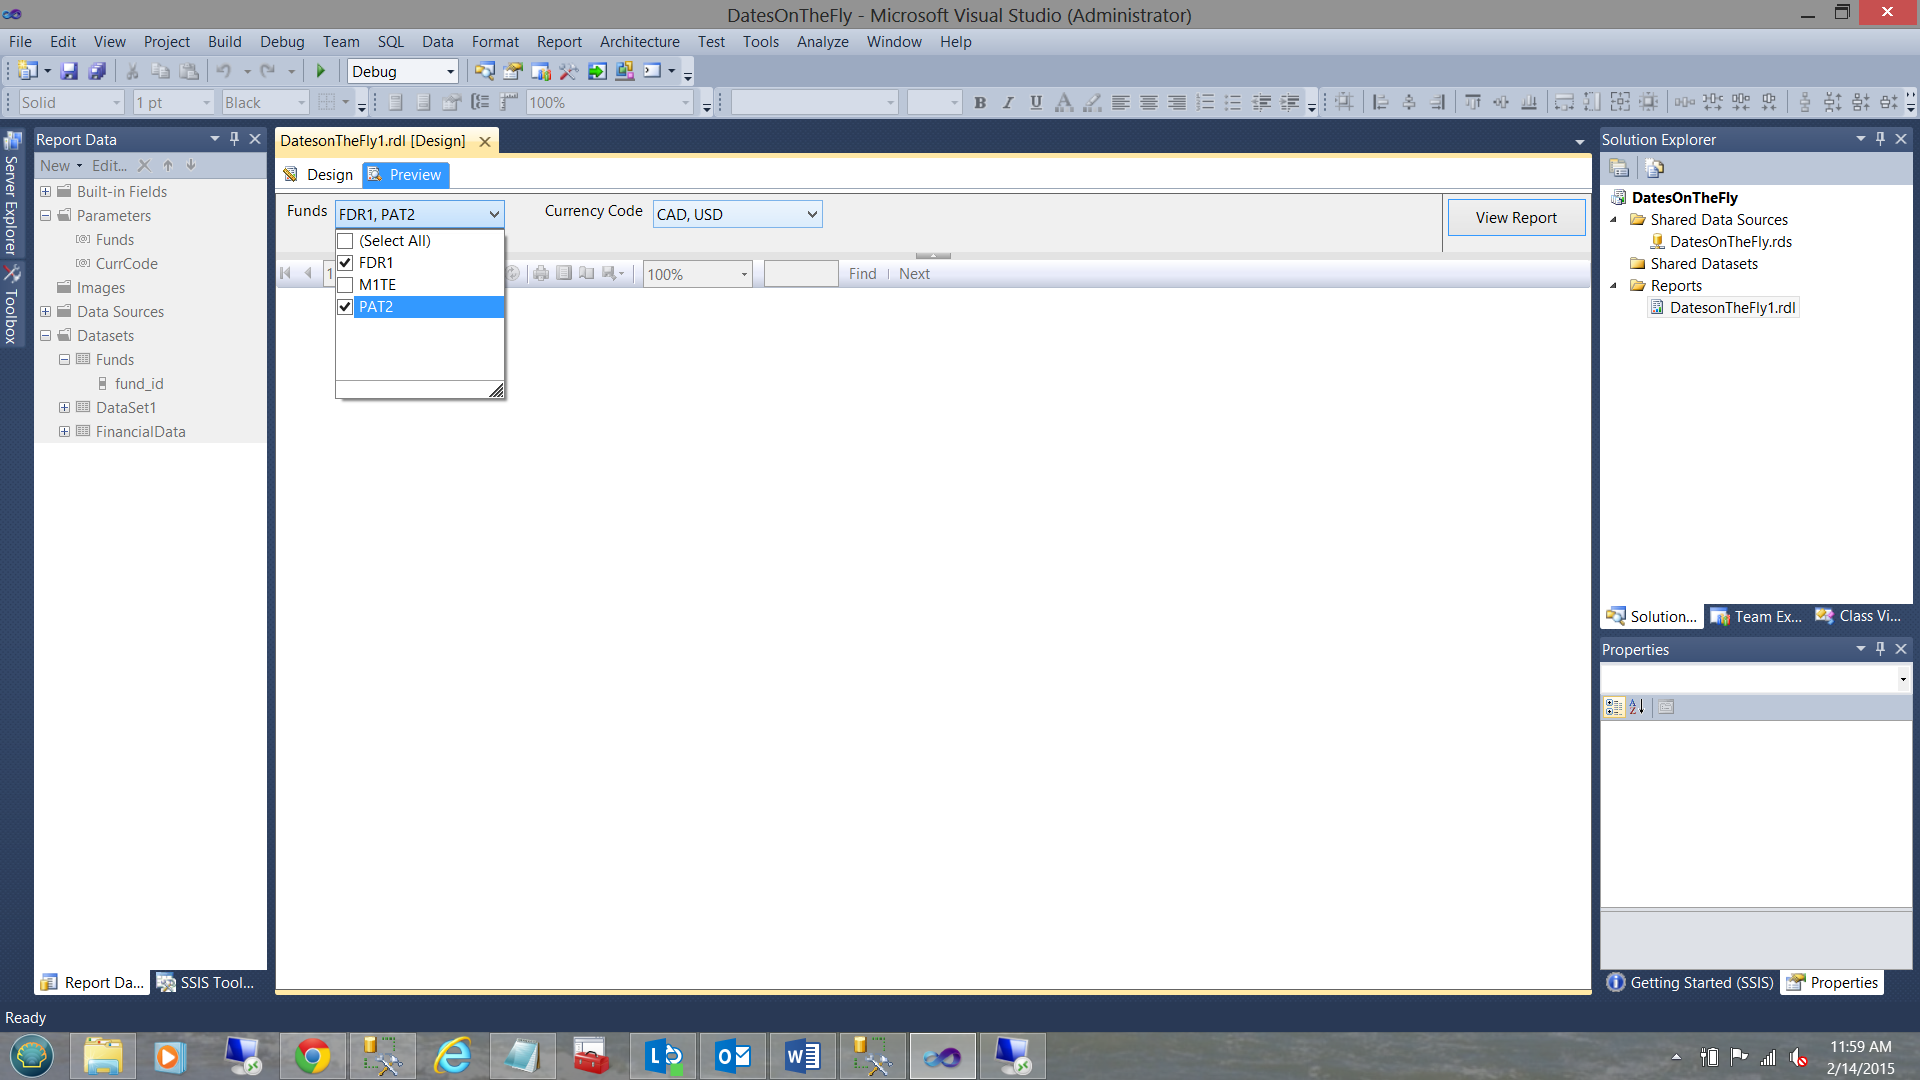
Putting my report into “Preview” mode, I am able to select the parameters that I wish (see above). I now click “View Report”.
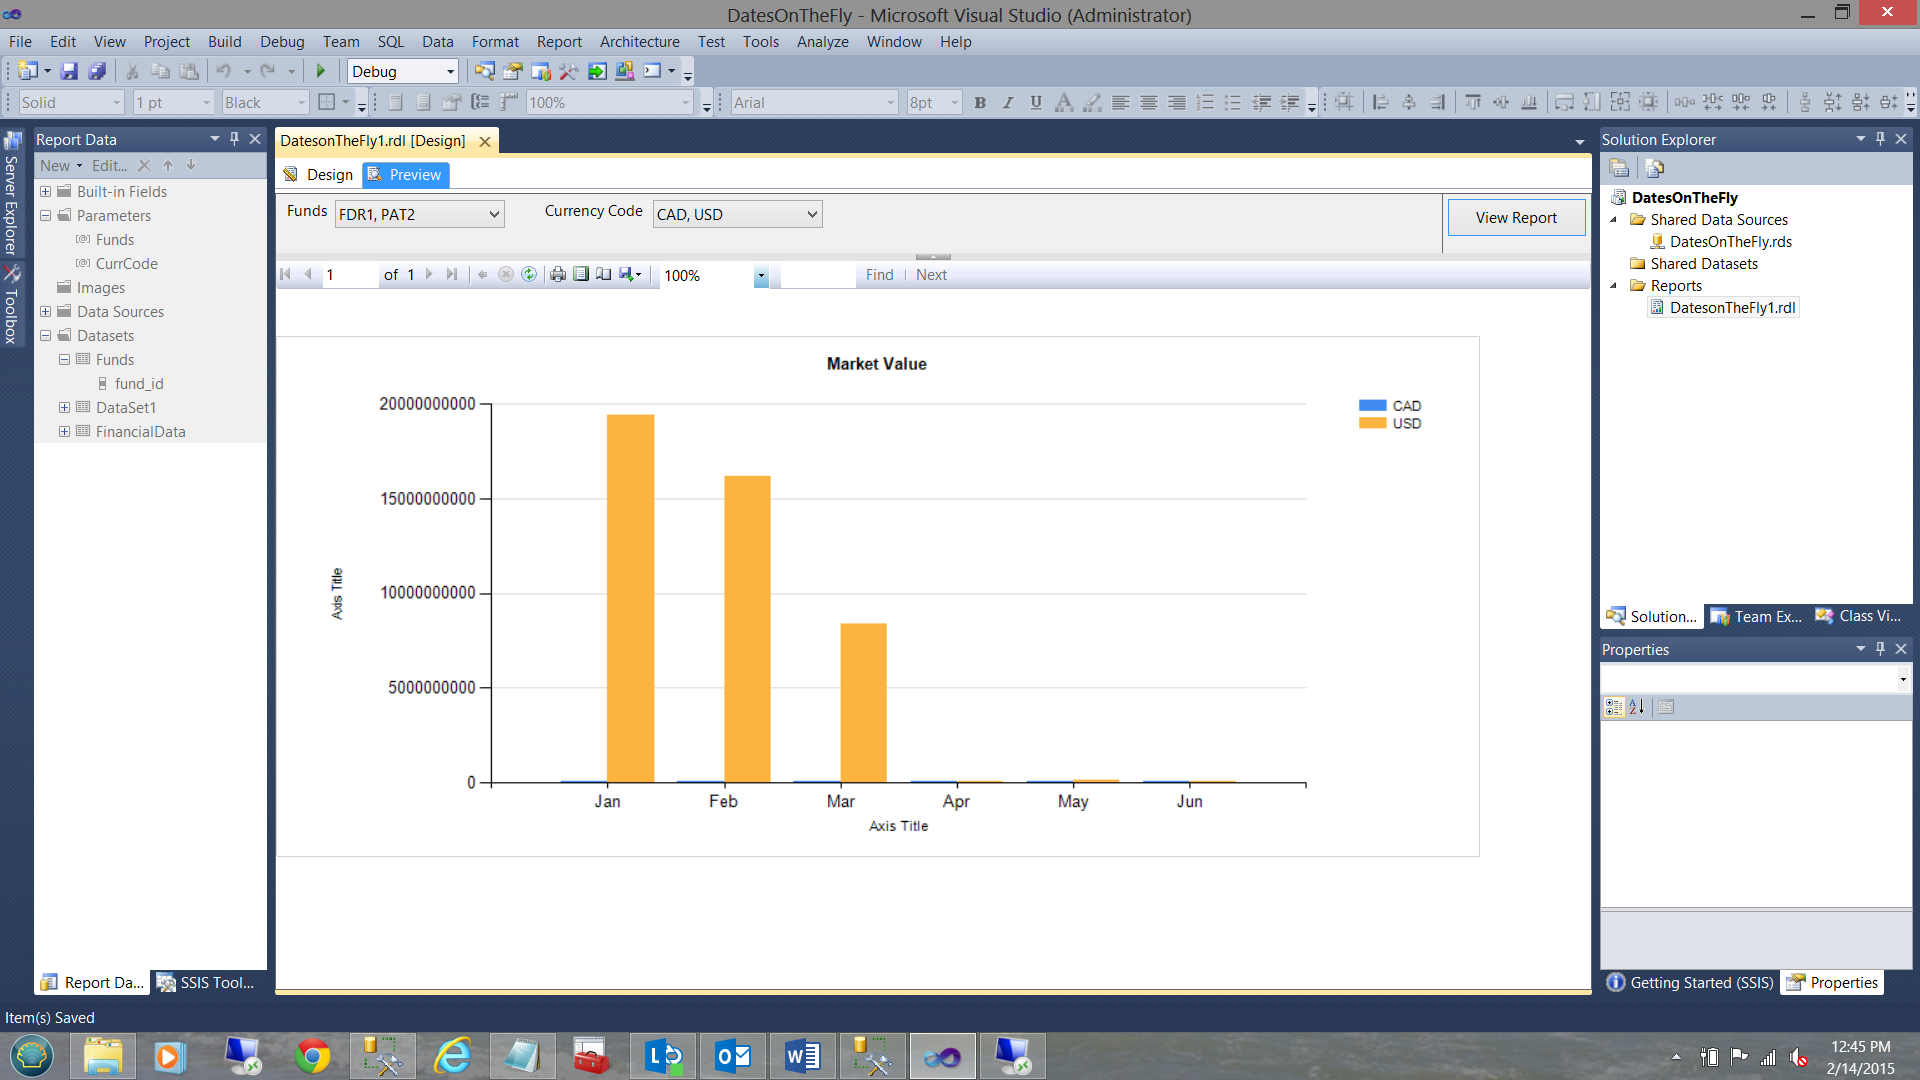
Our final report may be seen above. Note that there are in fact two currencies shown for each month albeit the CAD values are very small.
Conclusions
Thus we come to the end of another “get together”. We have seen that while most reporting is “Date” dependant, oft times it is not necessary to specify a start and end date as this may be calculated from the system date.
We have also seen how this technique may be utilized with stored procedures and Reporting Services alike.
Do try to utilize this technique in your day to day work. It will bear fruit!
In the interim, happy programming!
Addenda 1
|
1 2 3 4 5 6 7 8 9 10 11 12 13 14 15 16 17 18 19 |
use [SQLShackFinancial] go --CREATE procedure [dbo].[SQLShackFiscalFiscalYear] --as declare @beginFiscal date declare @endFiscal date declare @Yearr varchar(4) declare @decider int -- The guts of the code set @decider = datepart(Month,convert(date,getdate())) set @Yearr = datepart(YEAR,Convert(date,Getdate())) set @Decider = 7 set @Yearr = case when @decider >= 7 then datepart(YEAR,Convert(date,Getdate())) else @Yearr -1 end set @Beginfiscal = convert(varchar(4),@Yearr) + '0701' set @Endfiscal = dateadd(d,-1,dateadd(Year,1,@beginFiscal)) select @BeginFiscal as [Beginning Date], @endFiscal as [Ending Date], @decider |
Addenda 2
|
1 2 3 4 5 6 7 8 9 10 11 12 13 14 15 16 17 18 19 20 21 22 23 24 25 26 27 28 29 30 31 32 33 34 35 36 37 38 39 40 41 42 43 44 45 46 47 48 49 50 51 52 53 54 55 56 |
use [SQLShackFinancial] go --CREATE procedure [dbo].[SQLShackFiscalFiscalYear] --as declare @beginFiscal date declare @endFiscal date declare @Yearr varchar(4) declare @decider int -- The guts of the code set @decider = datepart(Month,convert(date,getdate())) set @Yearr = datepart(YEAR,Convert(date,Getdate())) set @Yearr = case when @decider >= 7 then datepart(YEAR,Convert(date,Getdate())) else @Yearr -1 end set @Beginfiscal = convert(varchar(4),@Yearr) + '0701' set @Endfiscal = dateadd(d,-1,dateadd(Year,1,@beginFiscal)) Select fund_ID, FND_TOT_CURR_CD, sum(MKT_VAL_TOT_AMT) as [Market Value] , YearMth, case when right(YearMth,2) = '01' then 'Jan' when right(YearMth,2) = '02' then 'Feb' when right(YearMth,2) = '03' then 'Mar' when right(YearMth,2) = '04' then 'Apr' when right(YearMth,2) = '05' then 'May' when right(YearMth,2) = '06' then 'Jun' when right(YearMth,2) = '07' then 'Jul' when right(YearMth,2) = '08' then 'Aug' when right(YearMth,2) = '09' then 'Sep' when right(YearMth,2) = '10' then 'Oct' when right(YearMth,2) = '11' then 'Nov' when right(YearMth,2) = '12' then 'Dec' else '99' end as Monthee from ( select FUND_ID, CAL_DT, FND_TOT_TYP_CD, FND_TOT_CURR_CD, MKT_VAL_TOT_AMT ,convert(varchar(4),datepart(year,Convert(date,Cal_dt))) + Convert(varchar(2),case when len(datepart(month,Convert(date,Cal_dt))) = 1 then '0' + convert(varchar(2),datepart(month,Convert(date,Cal_dt))) else convert(varchar(2),datepart(month,Convert(date,Cal_dt))) end) as YearMth from [dbo].[DateOnTheFly] where cal_dt between @beginFiscal and @endFiscal )a Group by FUND_ID, FND_TOT_TYP_CD, FND_TOT_CURR_CD,YearMth, case when right(YearMth,2) = '01' then 'Jan' when right(YearMth,2) = '02' then 'Feb' when right(YearMth,2) = '03' then 'Mar' when right(YearMth,2) = '04' then 'Apr' when right(YearMth,2) = '05' then 'May' when right(YearMth,2) = '06' then 'Jun' when right(YearMth,2) = '07' then 'Jul' when right(YearMth,2) = '08' then 'Aug' when right(YearMth,2) = '09' then 'Sep' when right(YearMth,2) = '10' then 'Oct' when right(YearMth,2) = '11' then 'Nov' when right(YearMth,2) = '12' then 'Dec' else '99' end order by YearMth desc |
Addenda 3
|
1 2 3 4 5 6 7 8 9 10 11 12 13 14 15 16 17 18 19 20 21 22 23 24 25 26 27 28 29 30 31 32 33 34 35 36 37 38 39 40 41 42 43 44 45 46 47 48 49 50 51 52 53 54 55 56 57 58 59 60 |
use [SQLShackFinancial] go alter procedure [dbo].[SQLShackFiscalFiscalYear] ( @currency varchar(2000), @fundid varchar(2000) ) as declare @beginFiscal date declare @endFiscal date declare @Yearr varchar(4) declare @decider int -- The guts of the code set @decider = datepart(Month,convert(date,getdate())) set @Yearr = datepart(YEAR,Convert(date,Getdate())) set @Yearr = case when @decider >= 7 then datepart(YEAR,Convert(date,Getdate())) else @Yearr -1 end set @Beginfiscal = convert(varchar(4),@Yearr) + '0701' set @Endfiscal = dateadd(d,-1,dateadd(Year,1,@beginFiscal)) Select fund_ID, FND_TOT_CURR_CD, sum(MKT_VAL_TOT_AMT) as [Market Value] , YearMth, case when right(YearMth,2) = '01' then 'Jan' when right(YearMth,2) = '02' then 'Feb' when right(YearMth,2) = '03' then 'Mar' when right(YearMth,2) = '04' then 'Apr' when right(YearMth,2) = '05' then 'May' when right(YearMth,2) = '06' then 'Jun' when right(YearMth,2) = '07' then 'Jul' when right(YearMth,2) = '08' then 'Aug' when right(YearMth,2) = '09' then 'Sep' when right(YearMth,2) = '10' then 'Oct' when right(YearMth,2) = '11' then 'Nov' when right(YearMth,2) = '12' then 'Dec' else '99' end as Monthee from ( select FUND_ID, CAL_DT, FND_TOT_TYP_CD, FND_TOT_CURR_CD, MKT_VAL_TOT_AMT ,convert(varchar(4),datepart(year,Convert(date,Cal_dt))) + Convert(varchar(2),case when len(datepart(month,Convert(date,Cal_dt))) = 1 then '0' + convert(varchar(2),datepart(month,Convert(date,Cal_dt))) else convert(varchar(2),datepart(month,Convert(date,Cal_dt))) end) as YearMth from [dbo].[DateOnTheFly] where cal_dt between @beginFiscal and @endFiscal )a Group by FUND_ID, FND_TOT_TYP_CD, FND_TOT_CURR_CD,YearMth, case when right(YearMth,2) = '01' then 'Jan' when right(YearMth,2) = '02' then 'Feb' when right(YearMth,2) = '03' then 'Mar' when right(YearMth,2) = '04' then 'Apr' when right(YearMth,2) = '05' then 'May' when right(YearMth,2) = '06' then 'Jun' when right(YearMth,2) = '07' then 'Jul' when right(YearMth,2) = '08' then 'Aug' when right(YearMth,2) = '09' then 'Sep' when right(YearMth,2) = '10' then 'Oct' when right(YearMth,2) = '11' then 'Nov' when right(YearMth,2) = '12' then 'Dec' else '99' end order by YearMth desc |
Addenda 4
|
1 2 3 4 5 6 7 8 9 10 11 12 13 14 15 16 17 18 19 20 21 22 23 24 25 26 27 28 29 30 31 32 33 34 35 36 37 38 39 40 41 42 43 44 45 46 47 48 49 50 51 52 53 54 55 56 57 58 59 60 61 62 63 64 65 66 67 68 69 70 71 72 73 74 75 76 77 78 79 80 81 82 83 84 85 86 87 88 89 90 91 92 93 94 95 96 97 98 99 100 101 102 103 104 105 106 107 108 109 110 111 112 113 114 115 116 117 118 119 120 121 122 123 124 125 126 127 128 129 130 131 132 133 134 135 136 137 138 |
use [SQLShackFinancial] go IF OBJECT_ID(N'tempdb..#Fund') IS NOT NULL BEGIN DROP TABLE #Fund END IF OBJECT_ID(N'tempdb..#Currency') IS NOT NULL BEGIN DROP TABLE #Currency END Go --alter procedure [dbo].[SQLShackFiscalFiscalYear] --( --@currency varchar(2000), --@fundid varchar(2000) --) --as Declare @currency varchar(2000) Declare @fundid varchar(2000) set @Currency = 'USD, CAD' Set @Fundid = 'Pat2, FDR1' declare @beginFiscal date declare @endFiscal date declare @Yearr varchar(4) declare @decider int -- The guts of the code set @decider = datepart(Month,convert(date,getdate())) set @Yearr = datepart(YEAR,Convert(date,Getdate())) set @Yearr = case when @decider >= 7 then datepart(YEAR,Convert(date,Getdate())) else @Yearr -1 end set @Beginfiscal = convert(varchar(4),@Yearr) + '0701' set @Endfiscal = dateadd(d,-1,dateadd(Year,1,@beginFiscal)) declare @Comma CHAR(1) declare @Fund table ( fundid varchar(8) NOT NULL ) Set @Comma = ',' BEGIN DECLARE @Position INT DECLARE @Substringg VARCHAR(8000) SELECT @Position =1 IF (LEN(@fundid)<1) OR @fundid IS NULL RETURN WHILE @Position!=0 BEGIN SET @Position=CHARINDEX(@Comma,@fundid) IF @Position<>0 SET @Substringg=LEFT(@fundid,@Position-1) ELSE SET @Substringg=@fundid IF(LEN(@Substringg)>0) INSERT INTO @Fund(fundid) VALUES(RTRIM(LTRIM(@Substringg))) SET @fundid=RIGHT(@fundid,LEN(@fundid)-@Position) IF LEN(@fundid)=0 BREAK END select fundid as [fundid] Into #fund from @fund END Set @Position = 0 Set @Substringg = '' declare @Currency1 table ( Currency varchar(8) NOT NULL ) Set @Comma = ',' BEGIN --DECLARE @Position INT --DECLARE @Substringg VARCHAR(8000) SELECT @Position =1 IF (LEN(@currency)<1) OR @currency IS NULL RETURN WHILE @Position!=0 BEGIN SET @Position=CHARINDEX(@Comma,@currency) IF @Position<>0 SET @Substringg=LEFT(@currency,@Position-1) ELSE SET @Substringg=@currency IF(LEN(@Substringg)>0) INSERT INTO @currency1 (currency) VALUES(RTRIM(LTRIM(@Substringg))) SET @currency =RIGHT(@currency,LEN(@currency)-@Position) IF LEN(@currency)=0 BREAK END select currency as [currency] Into #currency from @currency1 END Select fund_ID, FND_TOT_CURR_CD, sum(MKT_VAL_TOT_AMT) as [Market Value] , YearMth, case when right(YearMth,2) = '01' then 'Jan' when right(YearMth,2) = '02' then 'Feb' when right(YearMth,2) = '03' then 'Mar' when right(YearMth,2) = '04' then 'Apr' when right(YearMth,2) = '05' then 'May' when right(YearMth,2) = '06' then 'Jun' when right(YearMth,2) = '07' then 'Jul' when right(YearMth,2) = '08' then 'Aug' when right(YearMth,2) = '09' then 'Sep' when right(YearMth,2) = '10' then 'Oct' when right(YearMth,2) = '11' then 'Nov' when right(YearMth,2) = '12' then 'Dec' else '99' end as Monthee from ( select FUND_ID, CAL_DT, FND_TOT_TYP_CD, FND_TOT_CURR_CD, MKT_VAL_TOT_AMT ,convert(varchar(4),datepart(year,Convert(date,Cal_dt))) + Convert(varchar(2),case when len(datepart(month,Convert(date,Cal_dt))) = 1 then '0' + convert(varchar(2),datepart(month,Convert(date,Cal_dt))) else convert(varchar(2),datepart(month,Convert(date,Cal_dt))) end) as YearMth from [dbo].[DateOnTheFly] DOTF inner join #Fund fund on DOTF.Fund_ID = fund.fundid Inner join #Currency currency on currency.currency = DOTF.FND_TOT_CURR_CD where cal_dt between @beginFiscal and @endFiscal )a Group by FUND_ID, FND_TOT_TYP_CD, FND_TOT_CURR_CD,YearMth, case when right(YearMth,2) = '01' then 'Jan' when right(YearMth,2) = '02' then 'Feb' when right(YearMth,2) = '03' then 'Mar' when right(YearMth,2) = '04' then 'Apr' when right(YearMth,2) = '05' then 'May' when right(YearMth,2) = '06' then 'Jun' when right(YearMth,2) = '07' then 'Jul' when right(YearMth,2) = '08' then 'Aug' when right(YearMth,2) = '09' then 'Sep' when right(YearMth,2) = '10' then 'Oct' when right(YearMth,2) = '11' then 'Nov' when right(YearMth,2) = '12' then 'Dec' else '99' end order by YearMth desc |
Steve has presented papers at 8 PASS Summits and one at PASS Europe 2009 and 2010. He has recently presented a Master Data Services presentation at the PASS Amsterdam Rally.
Steve has presented 5 papers at the Information Builders' Summits. He is a PASS regional mentor.
View all posts by Steve Simon
- Reporting in SQL Server – Using calculated Expressions within reports - December 19, 2016
- How to use Expressions within SQL Server Reporting Services to create efficient reports - December 9, 2016
- How to use SQL Server Data Quality Services to ensure the correct aggregation of data - November 9, 2016