
As database professionals, we are often in very close proximity to important processes, data, and applications. While we adopt the mantra of “Do no harm”, many maintenance or reporting tasks that we create carry unseen risks associated with them.
What happens when a drive fills up during daily differential backups? What if an index rebuild job runs abnormally long and interferes with morning processing? How about if a data load process causes extensive resource contention, bringing normal operations to their knees? All of these are planned events, yet can cause considerable disruption to the very processes we are trying to safeguard.
There are many simple ways to protect our important maintenance jobs against situations that could easily bring down production systems. This is a chance to greatly improve our standard practices and avoid unnecessary wake-up-calls at 2am on a Sunday!
What can go wrong?
In the tasks that we regularly perform, a wide variety of bad (yet preventable) things can happen. Here is a short list of examples that can keep us up late at night:
- A data collector job performs an unusually large amount of work, filling up the data drive for a reporting database and leaving it in a state where reports cannot run.
- A large software release results in far more changed data than expected. The transaction log backups become very large during the release, filling up the backup destination drive and causing subsequent backups to fail.
- Following that large release, an index rebuild job finds far more indexes than usual that require rebuilding. This process causes significant log growth, filling up the log file drive and preventing further transactional processing.
- An archiving process takes longer than usual, running into normal production hours and interfering with important daily operations.
- Multiple maintenance jobs run long, running into each other and causing excessive CPU consumption and disk I/O. In addition, each job is slowed down by the resource contention caused by the presence of the other.
Depending on your database environments, some of these may be more relevant than others, and there may be more that aren’t listed here. Note the significance of how jobs can impact each other and cause bigger problems when combined. The large software release mentioned above causes data and log growth, which we can anticipate and mitigate. The index fragmentation caused by the release, though, leads to the index maintenance job having to work far more than is typically expected. Not only must we guard jobs against expected problems, but we need to build in protection against unusual or infrequent situations, especially those caused by the interaction of multiple jobs.
Solution
We can build simple checks into our maintenance jobs that verify available resources as well as what an operation will require prior to execution. This allows us to ensure that our environment can handle what we are about to do, and abort with a meaningful error if resources are inadequate.
To illustrate some of these options, we’ll demo a simple index maintenance stored procedure. Your index maintenance may be significantly more complex, but the techniques shown here will be useful regardless of the intricacy of your maintenance procedures.
|
1 2 3 4 5 6 7 8 9 10 11 12 13 14 15 16 17 18 19 20 21 22 23 24 25 26 27 28 29 30 31 32 33 34 35 36 37 38 39 40 41 42 43 44 45 46 47 48 49 50 51 52 53 54 55 56 57 58 59 60 61 62 63 64 65 66 67 68 69 70 71 72 73 74 75 76 77 78 79 80 81 |
CREATE PROCEDURE dbo.index_maintenance_daily @reorganization_percentage TINYINT = 10, @rebuild_percentage TINYINT = 35 AS BEGIN DECLARE @sql_command NVARCHAR(MAX) = ''; DECLARE @parameter_list NVARCHAR(MAX) = '@reorganization_percentage TINYINT, @rebuild_percentage TINYINT' DECLARE @database_list TABLE (database_name NVARCHAR(MAX) NOT NULL); INSERT INTO @database_list (database_name) SELECT name FROM sys.databases WHERE databases.name NOT IN ('msdb', 'master', 'TempDB', 'model'); CREATE TABLE #index_maintenance ( database_name NVARCHAR(MAX), schema_name NVARCHAR(MAX), object_name NVARCHAR(MAX), index_name NVARCHAR(MAX), index_type_desc NVARCHAR(MAX), avg_fragmentation_in_percent FLOAT, index_operation NVARCHAR(MAX)); SELECT @sql_command = @sql_command + ' USE [' + database_name + '] INSERT INTO #index_maintenance (database_name, schema_name, object_name, index_name, index_type_desc, avg_fragmentation_in_percent, index_operation) SELECT CAST(SD.name AS NVARCHAR(MAX)) AS database_name, CAST(SS.name AS NVARCHAR(MAX)) AS schema_name, CAST(SO.name AS NVARCHAR(MAX)) AS object_name, CAST(SI.name AS NVARCHAR(MAX)) AS index_name, IPS.index_type_desc, IPS.avg_fragmentation_in_percent, -- Be sure to filter as much as possible...this can return a lot of data if you dont filter by database and table. CAST(CASE WHEN IPS.avg_fragmentation_in_percent >= @rebuild_percentage THEN ''REBUILD'' WHEN IPS.avg_fragmentation_in_percent >= @reorganization_percentage THEN ''REORGANIZE'' END AS NVARCHAR(MAX)) AS index_operation FROM sys.dm_db_index_physical_stats(NULL, NULL, NULL, NULL , NULL) IPS INNER JOIN sys.databases SD ON SD.database_id = IPS.database_id INNER JOIN sys.indexes SI ON SI.index_id = IPS.index_id INNER JOIN sys.objects SO ON SO.object_id = SI.object_id AND IPS.object_id = SO.object_id INNER JOIN sys.schemas SS ON SS.schema_id = SO.schema_id WHERE alloc_unit_type_desc = ''IN_ROW_DATA'' AND index_level = 0 AND SD.name = ''' + database_name + ''' AND IPS.avg_fragmentation_in_percent >= @reorganization_percentage AND SI.name IS NOT NULL -- Only review index, not heap data. AND SO.is_ms_shipped = 0 -- Do not perform maintenance on system objects ORDER BY SD.name ASC;' FROM @database_list WHERE database_name IN (SELECT name FROM sys.databases); EXEC sp_executesql @sql_command, @parameter_list, @reorganization_percentage, @rebuild_percentage; SELECT @sql_command = ''; SELECT @sql_command = @sql_command + ' USE [' + database_name + '] ALTER INDEX [' + index_name + '] ON [' + schema_name + '].[' + object_name + '] ' + index_operation + '; ' FROM #index_maintenance; SELECT * FROM #index_maintenance ORDER BY avg_fragmentation_in_percent; EXEC sp_executesql @sql_command; DROP TABLE #index_maintenance; END |
This stored procedure takes two parameters that indicate at what level of fragmentation an index should be reorganized and rebuilt. Using that information, every index in every non-system database will be checked and operated on, if fragmentation is high enough. This would presumably be run on a daily or weekly schedule at an off-hours time when system usage is low.
No limits are set in this stored proc. As a result, it could chew up any amount of log space, run for 18 hours, or cause unwanted contention. Since it runs at an off-hours time, we would most likely be asleep and not be able to respond quickly to a problem when it arises. With the fear of these situations instilled, let’s consider some ways to prevent them before they can manifest themselves.
Excessive log space consumption
The first situation to address is log usage. Index operations are logged and can generate significant log file growth that could potentially fill up a log drive if left unchecked. Since we iterate through indexes one-by-one, we have the luxury of taking a moment before each one to check on disk space and verify that we are good to go. By checking available disk space as well as the size of the index to be operated on, we can ensure that we leave exactly as much space as we want behind.
Introduced in SQL Server 2008R2 SP 1 was the dynamic management view sys.dm_os_volue_stats, which takes parameters for a database ID and file ID, returning the total and available disk space on the respective drive for that file. We can use that here in order to check how much space is remaining prior to an index operation by evaluating the following TSQL:
|
1 2 3 4 5 6 7 8 |
SELECT CAST(CAST(available_bytes AS DECIMAL) / (1024 * 1024 * 1024) AS BIGINT) AS gb_free FROM sys.master_files AS f CROSS APPLY sys.dm_os_volume_stats(f.database_id, f.file_id) WHERE f.database_id = DB_ID() AND f.type_desc = 'LOG'; |
This returns the free space on the log drive, in gigabytes. Our next step is to add index size to the stored procedure above and compare the two in order to determine if enough space exists to support an operation. For this example, we’ll assume that we must maintain 100GB free on the log drive at all times, therefore any index operation that would bring free space below that amount should not occur. The resulting stored procedure, shown below, shows how we can guard against filling up the log drive while rebuilding indexes:
|
1 2 3 4 5 6 7 8 9 10 11 12 13 14 15 16 17 18 19 20 21 22 23 24 25 26 27 28 29 30 31 32 33 34 35 36 37 38 39 40 41 42 43 44 45 46 47 48 49 50 51 52 53 54 55 56 57 58 59 60 61 62 63 64 65 66 67 68 69 70 71 72 73 74 75 76 77 78 79 80 81 82 83 84 85 86 87 88 89 90 91 92 93 94 95 96 97 98 99 100 101 102 103 104 105 106 107 108 109 110 111 |
IF EXISTS (SELECT * FROM sys.procedures WHERE procedures.name = 'index_maintenance_daily') BEGIN DROP PROCEDURE dbo.index_maintenance_daily; END GO CREATE PROCEDURE dbo.index_maintenance_daily @reorganization_percentage TINYINT = 10, @rebuild_percentage TINYINT = 35, @log_space_free_required_gb INT = 100 AS BEGIN SET NOCOUNT ON; DECLARE @sql_command NVARCHAR(MAX) = ''; DECLARE @parameter_list NVARCHAR(MAX) = '@reorganization_percentage TINYINT, @rebuild_percentage TINYINT' DECLARE @database_list TABLE (database_name NVARCHAR(MAX) NOT NULL); INSERT INTO @database_list (database_name) SELECT name FROM sys.databases WHERE databases.name NOT IN ('msdb', 'master', 'TempDB', 'model'); CREATE TABLE #index_maintenance ( database_name NVARCHAR(MAX), schema_name NVARCHAR(MAX), object_name NVARCHAR(MAX), index_name NVARCHAR(MAX), index_type_desc NVARCHAR(MAX), avg_fragmentation_in_percent FLOAT, index_operation NVARCHAR(MAX), size_in_GB BIGINT); SELECT @sql_command = @sql_command + ' USE [' + database_name + '] INSERT INTO #index_maintenance (database_name, schema_name, object_name, index_name, index_type_desc, avg_fragmentation_in_percent, index_operation,size_in_GB) SELECT CAST(SD.name AS NVARCHAR(MAX)) AS database_name, CAST(SS.name AS NVARCHAR(MAX)) AS schema_name, CAST(SO.name AS NVARCHAR(MAX)) AS object_name, CAST(SI.name AS NVARCHAR(MAX)) AS index_name, IPS.index_type_desc, IPS.avg_fragmentation_in_percent, -- Be sure to filter as much as possible...this can return a lot of data if you dont filter by database and table. CAST(CASE WHEN IPS.avg_fragmentation_in_percent >= @rebuild_percentage THEN ''REBUILD'' WHEN IPS.avg_fragmentation_in_percent >= @reorganization_percentage THEN ''REORGANIZE'' END AS NVARCHAR(MAX)) AS index_operation, (page_count * 8 / 1024 / 1024) AS size_in_GB FROM sys.dm_db_index_physical_stats(NULL, NULL, NULL, NULL , NULL) IPS INNER JOIN sys.databases SD ON SD.database_id = IPS.database_id INNER JOIN sys.indexes SI ON SI.index_id = IPS.index_id INNER JOIN sys.objects SO ON SO.object_id = SI.object_id AND IPS.object_id = SO.object_id INNER JOIN sys.schemas SS ON SS.schema_id = SO.schema_id WHERE alloc_unit_type_desc = ''IN_ROW_DATA'' AND index_level = 0 AND SD.name = ''' + database_name + ''' AND IPS.avg_fragmentation_in_percent >= @reorganization_percentage AND SI.name IS NOT NULL -- Only review index, not heap data. AND SO.is_ms_shipped = 0 -- Do not perform maintenance on system objects ORDER BY SD.name ASC;' FROM @database_list WHERE database_name IN (SELECT name FROM sys.databases); EXEC sp_executesql @sql_command, @parameter_list, @reorganization_percentage, @rebuild_percentage; SELECT @sql_command = 'DECLARE @log_drive_space_free_gb INT; DECLARE @error_message VARCHAR(MAX);'; SELECT @sql_command = @sql_command + ' USE [' + database_name + ']; SELECT @log_drive_space_free_gb = CAST(CAST(available_bytes AS DECIMAL) / (1024 * 1024 * 1024) AS BIGINT) FROM sys.master_files AS f CROSS APPLY sys.dm_os_volume_stats(f.database_id, f.file_id) WHERE f.database_id = DB_ID() AND f.type_desc = ''LOG''; SELECT @error_message = ''Not enough space available to process maintenance on ' + index_name + ' while executing the nightly index maintenance job. '' + CAST(@log_drive_space_free_gb AS VARCHAR(MAX)) + ''GB are currently free.'' IF @log_drive_space_free_gb - ' + CAST(size_in_GB AS VARCHAR(MAX)) + ' < @log_space_free_required_gb BEGIN RAISERROR(@error_message, 16, 1); RETURN; END ALTER INDEX [' + index_name + '] ON [' + schema_name + '].[' + object_name + '] ' + index_operation + ';' FROM #index_maintenance; SELECT @parameter_list = '@log_space_free_required_gb INT' SELECT * FROM #index_maintenance ORDER BY avg_fragmentation_in_percent; EXEC sp_executesql @sql_command, @parameter_list, @log_space_free_required_gb; DROP TABLE #index_maintenance; END |
The updated version of this stored procedure checks the size of the index to be rebuilt, the amount of free space on the log drive, and our required free space. With that information, it determines if we should proceed or immediately exit the stored procedure without taking actions on any further indexes. If this happens, we receive an error message like this:
Msg 50000, Level 16, State 1, Line 126
Not enough space available to process maintenance on PK_ProductCostHistory_ProductID_StartDate while executing the nightly index maintenance job. 97GB are currently free.
More information could be added to the error message to assist in troubleshooting, or to address specific needs in your environment. The key result was that the stored procedure immediately threw an error and exited, halting any further log growth from it and preventing an unpleasant late night wake-up-call.
Long job run times
The timing of maintenance jobs is important. We want them to run during off-hours times when usage from production workloads and other maintenance procedures are minimal. We also want those jobs to end before our busier times begin. For this example, let’s assume that we want a particular job to start at 1am and be finished by no later than 7am. There are two ways to approach this challenge:
- Proactively: Add TSQL to the maintenance proc, similar to above, that will end it if a certain time is exceeded.
- Reactively: Add a parallel job that actively monitors maintenance jobs, ending them if they run too long (or if any other unacceptable conditions arise).
We can easily make a case for both options. The proactive solution gracefully ends the job when we get past 7am, but it is not infallible. If a specific index took an unusually long time, then the job would continue until that index has completed. Only then would the job end, preventing the remaining indexes from being rebuilt.
The active monitoring solution can stop a job at any time, regardless of its progress. This job would be something to maintain over time and ensure it works correctly—if it were to accidentally end an important job at the wrong time, the cost of that mistake could be high. Also, jobs stopped by this process would need to be tolerant of ending at any point. An archiving or ETL process that is interrupted in the middle could inadvertently leave inconsistent data behind, unless it were designed to be robust and prevent that situation from arising.
The proactive solution is similar to our log growth TSQL in the last example. Prior to each index operation, we want to check either the job runtime or the current time and take action based on it. For this example, we’ll do both, checking that the time is not between 7am and 1am, and that the stored procedure itself has not run for more than 6 hours.
The following TSQL statement checks the current time and will return from the current proc if it is no longer within the allotted maintenance period:
|
1 2 3 4 5 6 7 8 |
DECLARE @current_time TIME = CAST(CURRENT_TIMESTAMP AS TIME); IF @current_time > '07:00:00' OR @current_time < '01:00:00' BEGIN PRINT 'This job is running outside of the allotted maintenance period (1:00am-7:00am). Current time: ' + CAST(@current_time AS VARCHAR(MAX)) RETURN END |
Variables can be added to take the place of the times so that they can be passed in as parameters from a job. Currently it is almost 7pm local time, so running this TSQL will provide the expected output:
This job is running outside of the allotted maintenance period (1:00am-7:00am). Current time: 18:59:08.3230000
Alternatively, had it been 3am, running the TSQL above would have resulted in no output as we would be within the bounds set by our maintenance/business rules.
Checking the job’s runtime is also relatively simple, and can be done with an artificial timestamp. We’ll check and verify that the current time is not more than six hours greater than the job’s start time as follows:
|
1 2 3 4 5 6 7 8 9 10 |
DECLARE @job_start_time DATETIME = CURRENT_TIMESTAMP; --...Insert maintenance TSQL here DECLARE @current_time DATETIME = CURRENT_TIMESTAMP; IF DATEDIFF(HOUR, @job_start_time, @current_time) >= 6 BEGIN PRINT 'This job has exceeded the maximum runtime allowed (6 hours). Start time: ' + CAST(@job_start_time AS VARCHAR(MAX)) + ' Current Time: ' + CAST(@current_time AS VARCHAR(MAX)); RETURN END |
The start time is logged as soon as the proc begins. Whenever we want to check the current runtime, we can do so with the TSQL above. In the event that over six hours has passed, the DATEDIFF check will return true and a message will be printed and the proc will end.
RAISERROR can be used if you’d like your job to throw an error message to the error logs (and fail noticeably). Alternatively, if you have a custom error log for detailed job information, the messages and details above can be sent there as well. RAISERROR alternatives for the hour check scenario above would look like this:
|
1 2 3 4 5 6 7 8 9 10 |
DECLARE @current_time TIME = CAST(CURRENT_TIMESTAMP AS TIME); DECLARE @message VARCHAR(MAX); IF @current_time > '07:00:00' OR @current_time < '01:00:00' BEGIN SELECT @message = 'This job is running outside of the allotted maintenance period (1:00am-7:00am). Current time: ' + CAST(@current_time AS VARCHAR(MAX)); RAISERROR(@message, 16, 1); RETURN; END |
Similarly, the duration check can be written to raise an error as well:
|
1 2 3 4 5 6 7 8 9 10 11 12 |
DECLARE @job_start_time DATETIME = CURRENT_TIMESTAMP; DECLARE @message VARCHAR(MAX); --...Insert maintenance TSQL here DECLARE @current_time DATETIME = CURRENT_TIMESTAMP; IF DATEDIFF(HOUR, @job_start_time, @current_time) >= 6 BEGIN SELECT @message = 'This job has exceeded the maximum runtime allowed (6 hours). Start time: ' + CAST(@job_start_time AS VARCHAR(MAX)) + ' Current Time: ' + CAST(@current_time AS VARCHAR(MAX)); RAISERROR(@message, 16, 1); RETURN END |
The resulting error would appear like this:
Msg 50000, Level 16, State 1, Line 250
This job has exceeded the maximum runtime allowed (6 hours). Start time: Jan 13 2016 7:14PM Current Time: Jan 13 2016 7:14PM
An alternate (albeit more complex) way to acquire similar information would be to query msdb for job data, assuming your TSQL is running within a job. This information is stored in a pair of system tables that can be joined together:
|
1 2 3 4 5 6 7 8 |
SELECT sysjobs.name, sysjobactivity.* FROM msdb.dbo.sysjobactivity INNER JOIN msdb.dbo.sysjobs ON sysjobactivity.job_id = sysjobs.job_id |
This returns run history on all jobs, a sample of which looks like this:

From this data, we can check for the current job by name, the most current instance of which has a start_execution_date populated, but no stop_execution_date. Manipulating this data is a bit more complex than checking time or duration as we demonstrated previously, but could be desirable when runtimes are sporadic, or business rules vary with each separate run.
These options can both easily be inserted into the index maintenance stored procedure shown earlier. The result will have built-in protection against log growth and unacceptable runtimes:
|
1 2 3 4 5 6 7 8 9 10 11 12 13 14 15 16 17 18 19 20 21 22 23 24 25 26 27 28 29 30 31 32 33 34 35 36 37 38 39 40 41 42 43 44 45 46 47 48 49 50 51 52 53 54 55 56 57 58 59 60 61 62 63 64 65 66 67 68 69 70 71 72 73 74 75 76 77 78 79 80 81 82 83 84 85 86 87 88 89 90 91 92 93 94 95 96 97 98 99 100 101 102 103 104 105 106 107 108 109 110 111 112 113 114 115 116 117 118 119 120 121 122 123 124 125 126 127 128 |
IF EXISTS (SELECT * FROM sys.procedures WHERE procedures.name = 'index_maintenance_daily') BEGIN DROP PROCEDURE dbo.index_maintenance_daily; END GO CREATE PROCEDURE dbo.index_maintenance_daily @reorganization_percentage TINYINT = 10, @rebuild_percentage TINYINT = 35, @log_space_free_required_gb INT = 100 AS BEGIN SET NOCOUNT ON; DECLARE @job_start_time DATETIME = CURRENT_TIMESTAMP; DECLARE @sql_command NVARCHAR(MAX) = ''; DECLARE @parameter_list NVARCHAR(MAX) = '@reorganization_percentage TINYINT, @rebuild_percentage TINYINT' DECLARE @database_list TABLE (database_name NVARCHAR(MAX) NOT NULL); INSERT INTO @database_list (database_name) SELECT name FROM sys.databases WHERE databases.name NOT IN ('msdb', 'master', 'TempDB', 'model'); CREATE TABLE #index_maintenance ( database_name NVARCHAR(MAX), schema_name NVARCHAR(MAX), object_name NVARCHAR(MAX), index_name NVARCHAR(MAX), index_type_desc NVARCHAR(MAX), avg_fragmentation_in_percent FLOAT, index_operation NVARCHAR(MAX), size_in_GB BIGINT); SELECT @sql_command = @sql_command + ' USE [' + database_name + '] INSERT INTO #index_maintenance (database_name, schema_name, object_name, index_name, index_type_desc, avg_fragmentation_in_percent, index_operation,size_in_GB) SELECT CAST(SD.name AS NVARCHAR(MAX)) AS database_name, CAST(SS.name AS NVARCHAR(MAX)) AS schema_name, CAST(SO.name AS NVARCHAR(MAX)) AS object_name, CAST(SI.name AS NVARCHAR(MAX)) AS index_name, IPS.index_type_desc, IPS.avg_fragmentation_in_percent, -- Be sure to filter as much as possible...this can return a lot of data if you dont filter by database and table. CAST(CASE WHEN IPS.avg_fragmentation_in_percent >= @rebuild_percentage THEN ''REBUILD'' WHEN IPS.avg_fragmentation_in_percent >= @reorganization_percentage THEN ''REORGANIZE'' END AS NVARCHAR(MAX)) AS index_operation, (page_count * 8 / 1024 / 1024) AS size_in_GB FROM sys.dm_db_index_physical_stats(NULL, NULL, NULL, NULL , NULL) IPS INNER JOIN sys.databases SD ON SD.database_id = IPS.database_id INNER JOIN sys.indexes SI ON SI.index_id = IPS.index_id INNER JOIN sys.objects SO ON SO.object_id = SI.object_id AND IPS.object_id = SO.object_id INNER JOIN sys.schemas SS ON SS.schema_id = SO.schema_id WHERE alloc_unit_type_desc = ''IN_ROW_DATA'' AND index_level = 0 AND SD.name = ''' + database_name + ''' AND IPS.avg_fragmentation_in_percent >= @reorganization_percentage AND SI.name IS NOT NULL -- Only review index, not heap data. AND SO.is_ms_shipped = 0 -- Do not perform maintenance on system objects ORDER BY SD.name ASC;' FROM @database_list WHERE database_name IN (SELECT name FROM sys.databases); EXEC sp_executesql @sql_command, @parameter_list, @reorganization_percentage, @rebuild_percentage; SELECT @sql_command = 'DECLARE @log_drive_space_free_gb INT; DECLARE @error_message VARCHAR(MAX); DECLARE @current_time TIME;'; SELECT @sql_command = @sql_command + ' USE [' + database_name + ']; SELECT @log_drive_space_free_gb = CAST(CAST(available_bytes AS DECIMAL) / (1024 * 1024 * 1024) AS BIGINT) FROM sys.master_files AS f CROSS APPLY sys.dm_os_volume_stats(f.database_id, f.file_id) WHERE f.database_id = DB_ID() AND f.type_desc = ''LOG''; SELECT @error_message = ''Not enough space available to process maintenance on ' + index_name + ' while executing the nightly index maintenance job. '' + CAST(@log_drive_space_free_gb AS VARCHAR(MAX)) + ''GB are currently free.'' IF @log_drive_space_free_gb - ' + CAST(size_in_GB AS VARCHAR(MAX)) + ' < @log_space_free_required_gb BEGIN RAISERROR(@error_message, 16, 1); RETURN; END IF DATEDIFF(HOUR, ''' + CAST(@job_start_time AS VARCHAR(MAX)) + ''', @current_time) >= 6 BEGIN SELECT @error_message = ''This job has exceeded the maximum runtime allowed (6 hours). Start time: ''''' + CAST(@job_start_time AS VARCHAR(MAX)) + ''''' Current Time: '' + CAST(@current_time AS VARCHAR(MAX)); RAISERROR(@error_message, 16, 1); RETURN END SELECT @current_time = CAST(CURRENT_TIMESTAMP AS TIME); IF @current_time > ''07:00:00'' OR @current_time < ''01:00:00'' BEGIN SELECT @error_message = ''This job is running outside of the allotted maintenance period (1:00am-7:00am). Current time: '' + CAST(@current_time AS VARCHAR(MAX)); RAISERROR(@error_message, 16, 1); RETURN END ALTER INDEX [' + index_name + '] ON [' + schema_name + '].[' + object_name + '] ' + index_operation + ';' FROM #index_maintenance; SELECT @parameter_list = '@log_space_free_required_gb INT' SELECT * FROM #index_maintenance ORDER BY avg_fragmentation_in_percent; EXEC sp_executesql @sql_command, @parameter_list, @log_space_free_required_gb; DROP TABLE #index_maintenance; END |
Prior to each index rebuild/reorganize operation, after free log space is verified, the duration of the stored procedure is checked, and then the time of day that it is running. These verification processes take a trivial amount of time to run, and provide a great deal of insurance against resource-intensive operations running into critical production operation hours.
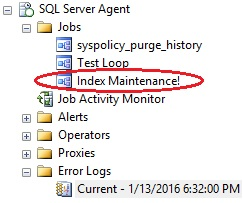
An alternative to the built-in approach is the parallel job, which runs periodically and checks that our maintenance jobs are operating within parameters. If any unacceptable situation is detected, then the responsible job can be forcibly ended. This is very useful if the offending job is stuck in a large operation and unable to reach one of the verification checkpoints that we created in our previous examples. To illustrate this, I have created a job that runs the index maintenance proc above:
From here, we will build the TSQL for a verification job that will run every 30 seconds and kill the index maintenance job if it is running and any unacceptable conditions (such as low log space or a long runtime) exist. The following stored procedure will encapsulate all of the logic presented above:
|
1 2 3 4 5 6 7 8 9 10 11 12 13 14 15 16 17 18 19 20 21 22 23 24 25 26 27 28 29 30 31 32 33 34 35 36 37 38 39 40 41 42 43 44 45 46 47 48 49 50 51 52 53 54 55 56 57 58 59 60 61 62 63 64 65 66 67 68 69 70 71 72 73 74 75 76 |
IF EXISTS (SELECT * FROM sys.procedures WHERE procedures.name = 'job_verification') BEGIN DROP PROCEDURE dbo.job_verification; END GO CREATE PROCEDURE dbo.job_verification @log_space_free_required_gb INT = 100, @job_to_check VARCHAR(MAX) = 'Index Maintenance!' AS BEGIN SET NOCOUNT ON; DECLARE @log_drive_space_free_gb INT; DECLARE @job_start_time DATETIME; DECLARE @error_message VARCHAR(MAX); DECLARE @current_time TIME; DECLARE @sql_command VARCHAR(MAX); DECLARE @stop_job BIT = 0; -- This will be switched to 1 if any job-ending criteria is met SELECT -- Get free log space @log_drive_space_free_gb = CAST(CAST(available_bytes AS DECIMAL) / (1024 * 1024 * 1024) AS BIGINT) FROM sys.master_files AS f CROSS APPLY sys.dm_os_volume_stats(f.database_id, f.file_id) WHERE f.database_id = DB_ID() AND f.type_desc = 'LOG'; -- If current free log space is below our allowed threshold, proceed to check if maintenance job is running IF @log_drive_space_free_gb < @log_space_free_required_gb BEGIN SELECT @error_message = 'Not enough space available to process maintenance while executing the nightly index maintenance job. ' + CAST(@log_drive_space_free_gb AS VARCHAR(MAX)) + 'GB are currently free.'; SELECT @stop_job = 1; END -- Get the start time for the index maintenance job, if it is running. SELECT @job_start_time = sysjobactivity.start_execution_date FROM msdb.dbo.sysjobs_view INNER JOIN msdb.dbo.sysjobactivity ON sysjobs_view.job_id = sysjobactivity.job_id WHERE sysjobs_view.name = @job_to_check AND sysjobactivity.run_Requested_date IS NOT NULL AND sysjobactivity.stop_execution_date IS NULL AND sysjobactivity.session_id = (SELECT MAX(session_id) FROM msdb.dbo.sysjobs_view INNER JOIN msdb.dbo.sysjobactivity ON sysjobs_view.job_id = sysjobactivity.job_id WHERE sysjobs_view.name = @job_to_check) -- If the job has been running for more than six hours, then set the error message and flag it to be ended. IF (DATEDIFF(HOUR, @job_start_time, @current_time) >= 6) AND @job_start_time IS NOT NULL BEGIN SELECT @error_message = 'This job has exceeded the maximum runtime allowed (6 hours). Start time: ' + CAST(@job_start_time AS VARCHAR(MAX)) + ' Current Time: ' + CAST(CURRENT_TIMESTAMP AS VARCHAR(MAX)); SELECT @stop_job = 1; END SELECT @current_time = CAST(CURRENT_TIMESTAMP AS TIME); IF @current_time > '07:00:00' OR @current_time < '01:00:00' BEGIN SELECT @error_message = 'This job is running outside of the allotted maintenance period (1:00am-7:00am). Current time: ' + CAST(@current_time AS VARCHAR(MAX)); SELECT @stop_job = 1; END -- Verify that the maintenance job is running first, before attempting to stop it (If a condition above was met first). IF @stop_job = 1 AND EXISTS ( SELECT * FROM msdb.dbo.sysjobs_view INNER JOIN msdb.dbo.sysjobactivity ON sysjobs_view.job_id = sysjobactivity.job_id WHERE sysjobs_view.name = @job_to_check AND sysjobactivity.run_Requested_date IS NOT NULL AND sysjobactivity.stop_execution_date IS NULL AND sysjobactivity.session_id = (SELECT MAX(session_id) FROM msdb.dbo.sysjobs_view INNER JOIN msdb.dbo.sysjobactivity ON sysjobs_view.job_id = sysjobactivity.job_id WHERE sysjobs_view.name = @job_to_check)) BEGIN -- If job is running, then end it immediately and raise an error with details. EXEC msdb.dbo.sp_stop_job @job_name = @job_to_check; RAISERROR(@error_message, 16, 1); RETURN; END END |
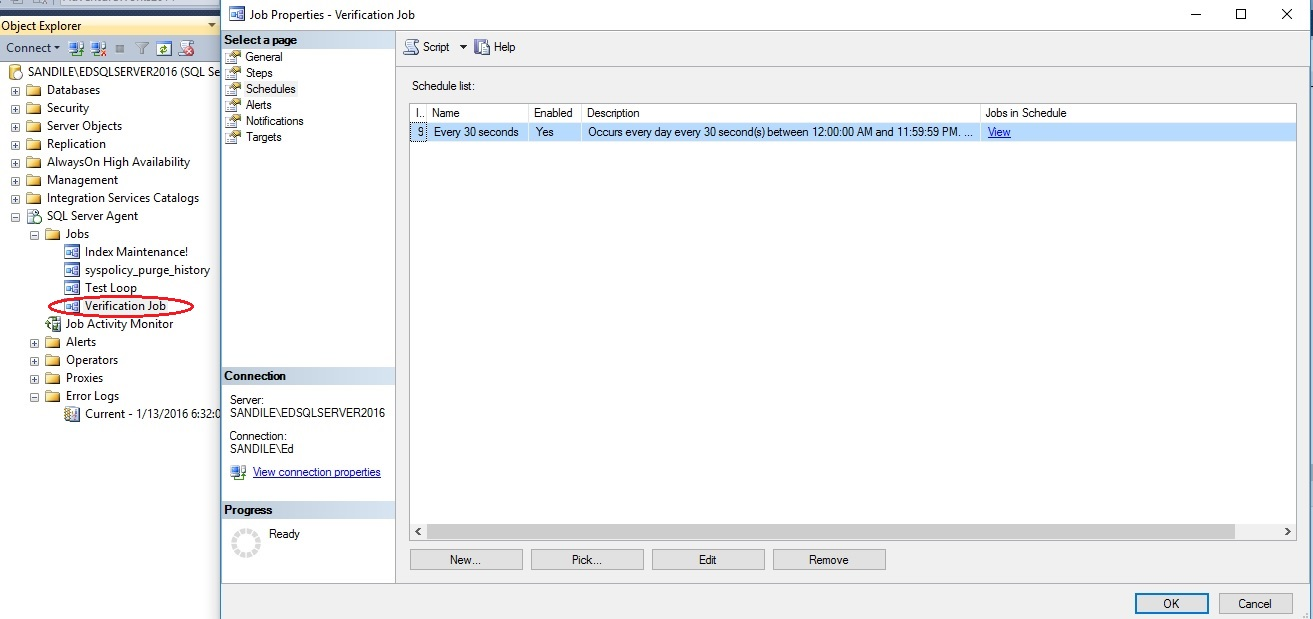
Next, we’ll create a job that runs every 30 seconds and calls the stored procedure above:
A look at the job history will show the first handful of successful job runs:
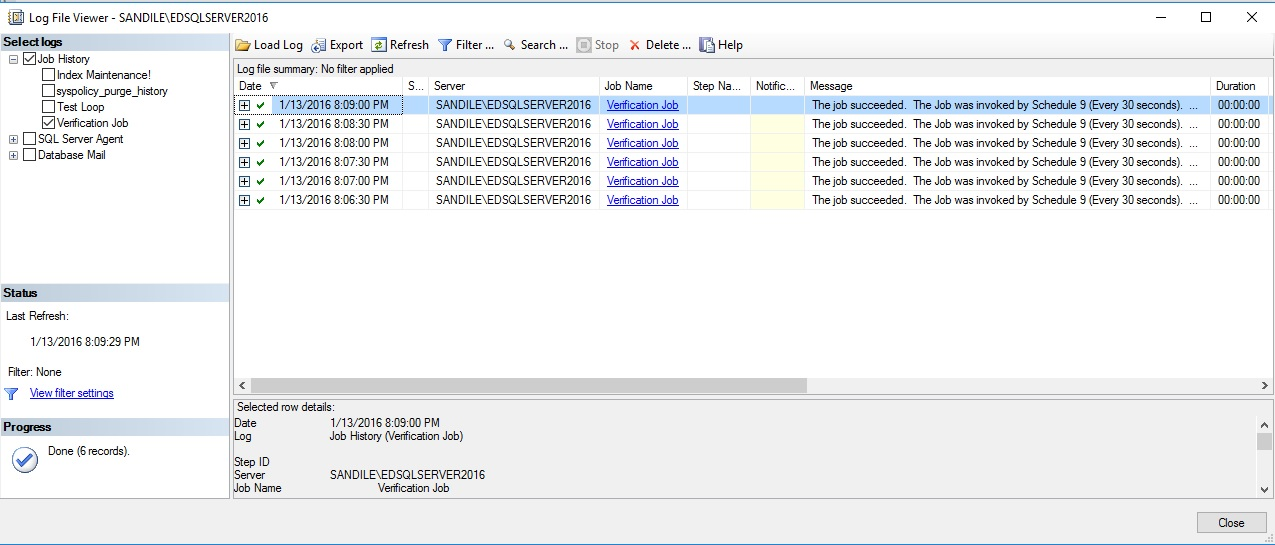
As expected, this verification process doesn’t even require a second to complete. As it is only verifying disk and job metadata and is able to do so extremely quickly and efficiently. Let’s say I were to start my index maintenance job and check back in 30 seconds:
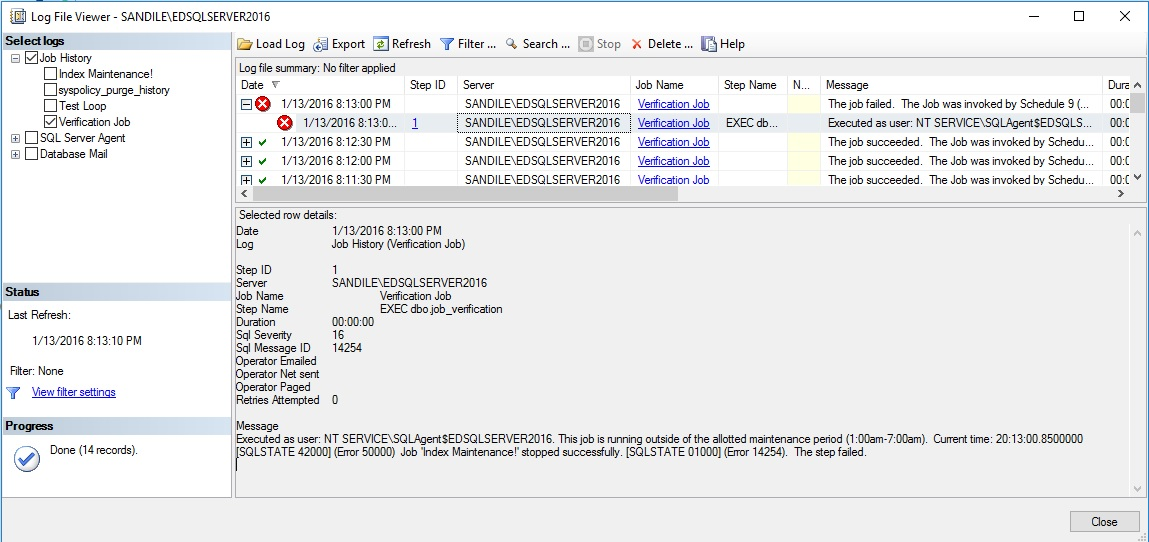
The verification job sees that the index maintenance job should not be running and uses msdb.dbo.sp_stop_job to immediately end it. In addition, the error message thrown within the verification job is visible from within the job history, reminding us that the job is running outside of the allotted maintenance period.
This technique can be expanded as far as your imagination takes you. A surrogate job such as this can be used to monitor any condition in SQL Server and take the appropriate action immediately. In addition to simply ending jobs or writing errors to the SQL Server error log, we could also take other actions such as:
- Send an email to a DBA, developer, or on-call operator (if it is a serious problem).
- The email target could vary depending on the error. For example, a disk space error could also email the SAN administrator, while a TSQL error would only email the responsible DBA.
- Disable a frequently running job, alerting a DBA that it will require attention as soon as possible.
- Perform a log backup and/or file shrink, if conditions exist where these operations may be necessary.
- Write additional data to the Windows Application Event Log.
- Execute another stored procedure or job that assists in remediating the situation encountered.
The flexibility introduced here is immense and can prevent critical production problems from ever manifesting themselves. If you decide to try it out, be sure to get creative and get the verification process to manage as many of the manual tasks that you’re typically stuck with when these situations arise. Use this not only to prevent disasters, but also to simplify your job and mitigate error-prone manual processes.
An email at 9am letting you know of unexpected index maintenance problems overnight is 100% preferable over a 2:00am wake-up call when a disk runs out of space and SQL Server is unable to write to its transaction log files!
Backup disk space
Backups are by nature going to result in disk space being eaten up whenever they run. Most of the backup routines we build involve full backups (once or maybe twice a week), differential backups (daily on non-full backup days), and/or transaction log backups, which run frequently and backup changes since the last log backup. Regardless of the specifics in your environment, there are a few generalizations that we can make:
- Data will get larger over time, and hence backups will increase in size.
- Anything that causes significant data change will also cause transaction log backup sizes to increase.
- If a backup target is shared with other applications, then they could potentially interfere or use up space.
- The more time that has passed since the last differential/transaction log backup, the larger they will be and the longer they will take.
- If cleanup of the target backup drive does not occur regularly, it will eventually fill up, causing backup failures.
Each of these situations lends themselves to possible solutions, such as not sharing the backup drive with other programs, or testing log growth on release scripts prior to the final production deployment. While we can mitigate risk, the potential always exists for drives to fill up. If they do, then all further backups will fail, leaving holes in the backup record that could prove detrimental in the event of a disaster or backup data request.
As with log space, we can monitor backup size and usage in order to make intelligent decisions about how a job should proceed. This can be managed from within a backup stored procedure using xp_cmdshell, if usage of that system stored procedure is tolerated. Alternatively, Powershell can be used to monitor drive space as well. An alternative solution that I am particularly fond of is to create a tiny unused or minimally used database on the server you’re backing up and put the data and log files on the backup drive. This allows you to use dm_os_volume_stats to monitor disk usage directly within the backup process without any security compromises.
For an example of this solution, we will use my local C drive as the backup drive and the F drive as the target for all other database data files. Since our data files are on the F drive, we can easily view the space available like this:
|
1 2 3 4 5 6 7 8 |
SELECT CAST(CAST(available_bytes AS DECIMAL) / (1024 * 1024 * 1024) AS BIGINT) AS gb_free FROM sys.master_files AS f CROSS APPLY sys.dm_os_volume_stats(f.database_id, f.file_id) WHERE f.database_id = DB_ID() AND f.type_desc = 'ROWS'; |
This returns the free space on the drive corresponding to the database I am querying from, in this case AdventureWorks2014. The result is exactly what I am looking for:

With 14.5TB free, we’re in good shape for quite a while. How about our backup drive? If we are willing to use xp_cmdshell, we can gather that information fairly easily:
|
1 2 3 4 5 6 7 8 9 10 11 12 |
DECLARE @results TABLE (output_data NVARCHAR(MAX)); INSERT INTO @results (output_data) EXEC xp_cmdshell 'DIR C:'; SELECT * FROM @results WHERE output_data LIKE '%bytes free%'; |
The result of this query is a single row with the number of directories and bytes free:
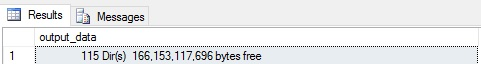
Unfortunately, xp_cmdshell is a security hole, allowing direct access to the OS from SQL Server. While some environments can tolerate its use, many cannot. As a result, let’s present an alternative that may feel a bit like cheating at first, but provides better insight into disk space without the need to enable any additional features:
|
1 2 3 4 5 6 7 8 9 10 11 12 13 14 15 |
CREATE DATABASE DBTest ON ( NAME = DBTest_Data, FILENAME = 'C:\SQLData\DBTest.mdf', SIZE = 10MB, MAXSIZE = 10MB, FILEGROWTH = 10MB) LOG ON ( NAME = DBTest_Log, FILENAME = 'C:\SQLData\DBTest.ldf', SIZE = 5MB, MAXSIZE = 5MB, FILEGROWTH = 5MB); |
This creates a database called DBTest on my C drive, with some relatively small data and log file sizes. If you plan on creating a more legitimate database to be used by any actual processes, then adjust the file sizes and autogrow settings as needed. With a database on this drive, we can run the DMV query from earlier and get free space on this drive:
|
1 2 3 4 5 6 7 8 9 10 |
USE DBTest; SELECT CAST(CAST(available_bytes AS DECIMAL) / (1024 * 1024 * 1024) AS BIGINT) AS gb_free FROM sys.master_files AS f CROSS APPLY sys.dm_os_volume_stats(f.database_id, f.file_id) WHERE f.database_id = DB_ID() AND f.type_desc = 'ROWS'; |
The result is exactly what we were looking for earlier, with no need for any OS-level commands via xp_cmdshell or Powershell:
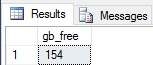
I currently have 154GB free, and the only cost of this data was the creation of a tiny database on the backup drive. With this tool in hand, we can look at a simple backup stored procedure and add logic in to manage space while it is running:
|
1 2 3 4 5 6 7 8 9 10 11 12 13 14 15 16 17 18 19 20 21 22 23 24 25 26 27 28 29 30 31 32 33 34 35 36 37 38 39 40 41 42 |
USE AdventureWorks2014; GO IF EXISTS (SELECT * FROM sys.procedures WHERE procedures.name = 'full_backup_plan') BEGIN DROP PROCEDURE dbo.full_backup_plan; END GO CREATE PROCEDURE dbo.full_backup_plan @backup_location NVARCHAR(MAX) = 'C:\SQLBackups\' -- Default backup folder AS BEGIN SET NOCOUNT ON; DECLARE @current_time TIME = CAST(CURRENT_TIMESTAMP AS TIME); DECLARE @current_day TINYINT = DATEPART(DW, CURRENT_TIMESTAMP); DECLARE @datetime_string NVARCHAR(MAX) = FORMAT(CURRENT_TIMESTAMP , 'MMddyyyyHHmmss'); DECLARE @sql_command NVARCHAR(MAX) = ''; DECLARE @database_list TABLE (database_name NVARCHAR(MAX) NOT NULL, recovery_model_desc NVARCHAR(MAX)); INSERT INTO @database_list (database_name, recovery_model_desc) SELECT name, recovery_model_desc FROM sys.databases WHERE databases.name NOT IN ('msdb', 'master', 'TempDB', 'model'); SELECT @sql_command = @sql_command + ' BACKUP DATABASE [' + database_name + '] TO DISK = ''' + @backup_location + database_name + '_' + @datetime_string + '.bak''; ' FROM @database_list; PRINT @sql_command; EXEC sp_executesql @sql_command; END |
This simple stored procedure will perform a full backup of all databases on the server, with the exception of msdb, tempdb, model, and master. What we want to do is verify free space before running backups, similar to earlier. If space is unacceptably low, then end the job and notify the correct people immediately. By maintaining enough space on the drive, we prevent running out completely and causing regular transaction log backups to fail. The test for space on the backup drive incorporates our dm_os_volume_stats query from earlier and assumes that we must maintain 25GB free at all times:
|
1 2 3 4 5 6 7 8 9 10 11 12 13 14 15 16 17 18 19 20 21 22 23 24 25 26 27 28 29 30 31 32 33 34 35 36 37 38 39 40 41 42 43 44 45 46 47 48 49 50 51 52 53 54 55 56 57 58 59 60 61 62 63 64 |
IF EXISTS (SELECT * FROM sys.procedures WHERE procedures.name = 'full_backup_plan') BEGIN DROP PROCEDURE dbo.full_backup_plan; END GO CREATE PROCEDURE dbo.full_backup_plan @backup_location NVARCHAR(MAX) = 'C:\SQLBackups\', -- Default backup folder @backup_free_space_required_gb INT = 25 -- Default GB allowed on the backup drive AS BEGIN SET NOCOUNT ON; DECLARE @current_time TIME = CAST(CURRENT_TIMESTAMP AS TIME); DECLARE @current_day TINYINT = DATEPART(DW, CURRENT_TIMESTAMP); DECLARE @datetime_string NVARCHAR(MAX) = FORMAT(CURRENT_TIMESTAMP , 'MMddyyyyHHmmss'); DECLARE @sql_command NVARCHAR(MAX) = ''; DECLARE @database_list TABLE (database_name NVARCHAR(MAX) NOT NULL, recovery_model_desc NVARCHAR(MAX)); INSERT INTO @database_list (database_name, recovery_model_desc) SELECT name, recovery_model_desc FROM sys.databases WHERE databases.name NOT IN ('msdb', 'master', 'TempDB', 'model'); SELECT @sql_command = @sql_command + ' DECLARE @backup_drive_space_free BIGINT; DECLARE @current_db_size BIGINT; DECLARE @error_message NVARCHAR(MAX);' SELECT @sql_command = @sql_command + ' USE [DBTest]; SELECT @backup_drive_space_free = CAST(CAST(available_bytes AS DECIMAL) / (1024 * 1024 * 1024) AS BIGINT) FROM sys.master_files AS f CROSS APPLY sys.dm_os_volume_stats(f.database_id, f.file_id) WHERE f.database_id = DB_ID() AND f.type_desc = ''ROWS''; USE [' + database_name + ']; SELECT @current_db_size = SUM(size) * 8 / 1024 / 1024 FROM sysfiles; IF @backup_drive_space_free - @current_db_size < ' + CAST(@backup_free_space_required_gb AS NVARCHAR(MAX)) + ' BEGIN SELECT @error_message = ''Not enough space available to process backup on ' + database_name + ' while executing the full backup maintenance job. '' + CAST(@backup_drive_space_free AS VARCHAR(MAX)) + ''GB are currently free.''; RAISERROR(@error_message, 16, 1); RETURN; END BACKUP DATABASE [' + database_name + '] TO DISK = ''' + @backup_location + database_name + '_' + @datetime_string + '.bak''; ' FROM @database_list; PRINT @sql_command; EXEC sp_executesql @sql_command; END |
Within the dynamic SQL, and prior to each backup, we check the current free space on the backup drive, the size of the database we are about to back up, and compare those values (in GB) to the allowable free space set in the stored procedure parameters. In the event that the backup we are about to take is too large, an error will be thrown. We can, in addition, take any number of actions to alert the responsible parties, such as emails, pager services, and/or additional logging.
In the event that I try to back up a particularly large database, the expected error will be thrown:
Msg 50000, Level 16, State 1, Line 656 Not enough space available to process backup on AdventureWorks2014 while executing the full backup maintenance job. 141GB are currently free.
Since backup failures are far more serious than an index rebuild not running, we would want to err on the side of caution and make sure the right people were notified as quickly as possible. The parallel job solution from earlier could also be used to monitor backup jobs and, in the event that free space was too low send out alerts as needed and/or end the job.
Conclusion
Our ability to proactively monitor and manage potentially messy situations has few limits. With some creativity, we could monitor for locking, blocking, IO volume, data space used, and more. Whenever a job fails or we are woken up at 2am by an unfortunate on-call situation, our first thoughts should be to determine how to prevent that late night from happening again. A combination of smart alerting and proactive management of jobs will ensure that our database server never gets into an unrecoverable situation.
You likely have other monitoring tools that watch over a variety of OS, disk, and SQL Server metrics. This is a good thing, and having redundant monitoring ensures that a failure in one does not render all alerting data irrelevant. The solutions presented above are the tip of the iceberg in terms of customized monitoring and automated response and should complement those other systems, not replace them.
Always consider how different jobs interact and time them such that there is no overlap in sensitive or resource intensive tasks. Backups, index rebuilds, ETL processes, updating statistics, archiving, software releases, and data collection processes should be timed in such a way that they do not impact each other, nor do they affect normal business processing. When there is a risk of poor timing, build in short-circuit mechanisms that prevent intolerable situations from arising.
In an ideal universe, we would always catch disk space issues long before they become a threat to our day-to-day processing, but we know that the real world doesn’t work like this. Exceptions will happen, so be prepared! Make common processes robust enough to withstand those inevitable circumstances and your job will become significantly easier. As a bonus, you’ll impress your coworkers and managers with time & cost-saving measures!

In his free time, Ed enjoys video games, sci-fi & fantasy, traveling, and being as big of a geek as his friends will tolerate.
View all posts by Ed Pollack
- SQL Server Database Metrics - October 2, 2019
- Using SQL Server Database Metrics to Predict Application Problems - September 27, 2019
- SQL Injection: Detection and prevention - August 30, 2019