

Microsoft Power BI is a data analytics and visualization tool that can be used to visualize data in the form of different types of reports, without writing a single line of code.
Data that you want to visualize using Power BI can be imported from a wide variety of sources including flat files, CSV files, excel sheets, websites and different types of databases e.g. MS SQL Server, MySQL, PostgreSQL etc.
In this article, you will see how to import data from MS SQL Server and MySQL into Power BI. You will also see how to plot simple reports using the datasets imported from MS SQL Server and MySQL.
Creating dummy data in SQL Server
Let’s first create a dummy dataset in SQL Server. You will be importing this dataset in Power BI.
Execute the following command on MS SQL Server Management Studio (SSMS) or any other SQL Server client that has access to a SQL Server instance.
The following script creates a dummy database i.e. StudentDB on an SQL Server instance.
|
1 |
CREATE DATABASE StudentDB |
The following script adds a table Students to the StudentDB database that you just created. The Students table contains five columns i.e: Id, Name, Age, Gender and Department.
|
1 2 3 4 5 6 7 8 9 |
USE StudentDB CREATE TABLE Students ( Id INT PRIMARY KEY IDENTITY(1,1), Name VARCHAR (50) NOT NULL, Age INT, Gender VARCHAR (50), Department VARCHAR (50) NOT NULL, ) |
Finally, we will add some dummy records in the Students table. To do so, execute the following script:
|
1 2 3 4 5 6 7 8 9 10 11 |
INSERT INTO Students VALUES ( 'Jon', 18, 'Male', 'Engineering'), ( 'Mike', 19, 'Male', 'Law'), ( 'Nick', 19, 'Male', 'Literature'), ( 'Sally', 20, 'Female','Engineering'), ( 'Laura', 22, 'Female','Engineering'), ( 'Elisabeth', 18, 'Female','Law'), ( 'Jane', 17, 'Female','Law'), ( 'Josh', 20, 'Male','Engineering'), ('Will', 19, 'Male','Literature'), ('Rachel', 22, 'Female','Literature') |
Having created a very simple dummy dataset, the next step is to import the StudentDB database into Power BI.
Importing data from SQL Server to Power BI
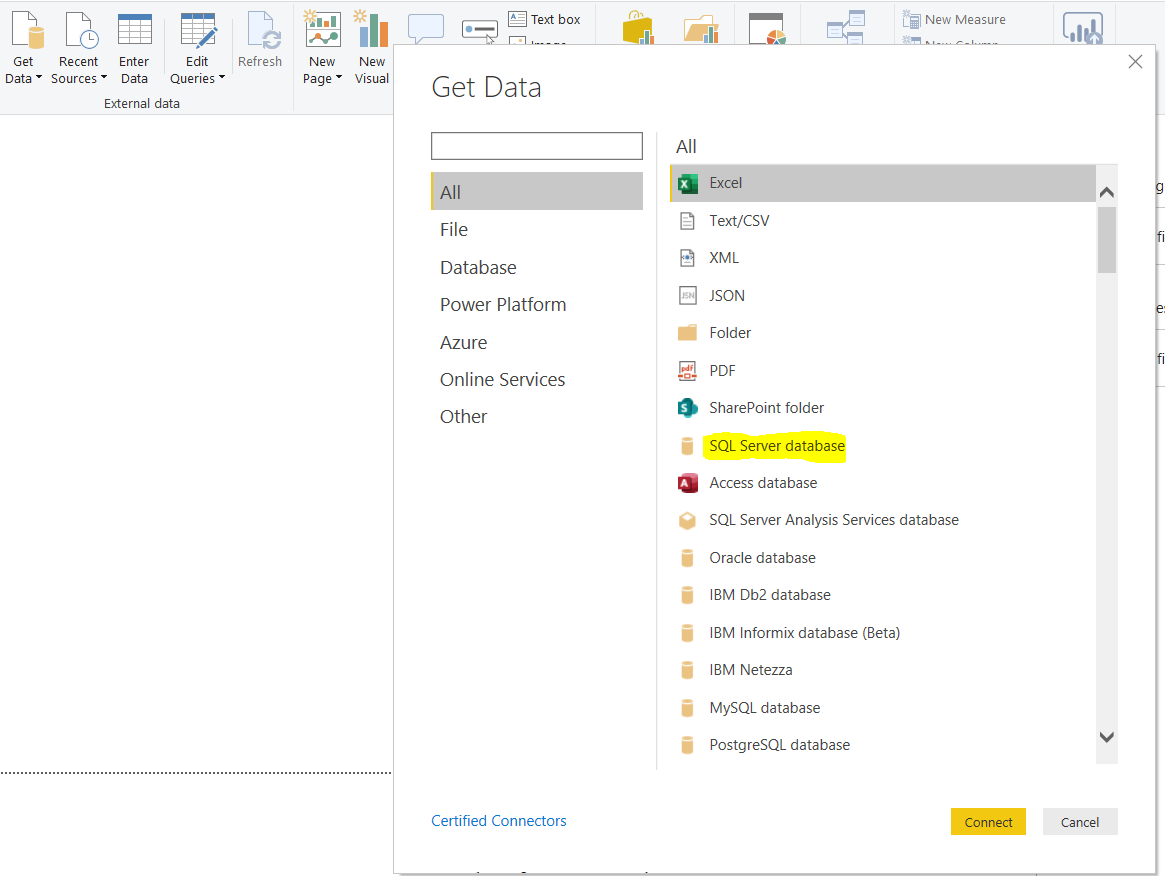
To import any dataset into Power BI, you need to click on the “Get Data” button from the menu bar.
Once you do that, you will see a list of data sources to select from. For an import from SQL Server, click on the “SQL Server Database” option. This is shown in the screenshot below.
You should see the following dialogue box. Enter the SQL Server instance name that you want to import data from, along with the database name and click OK.
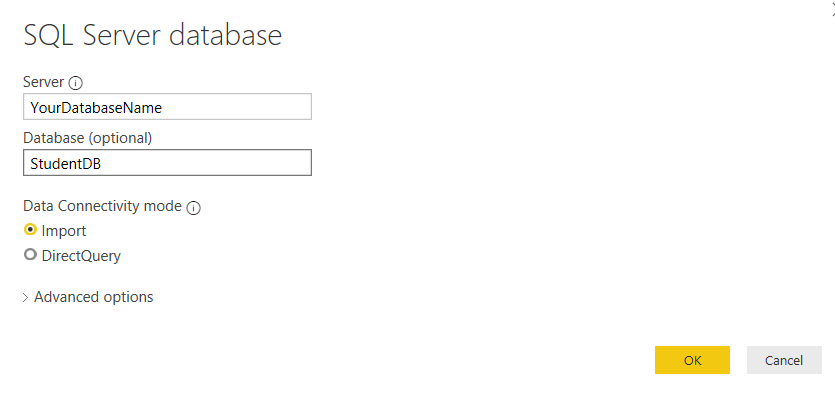
There are two different modes of data connectivity: 1) Import and 2) DirectQuery.
Using the Import option means that an image of the database is imported. Any changes that occur in the database after the image is imported in Power BI are not reflected in Power BI.
Using the DirectQuery option means that all the queries are directly executed on the database and so you always have up to date data.
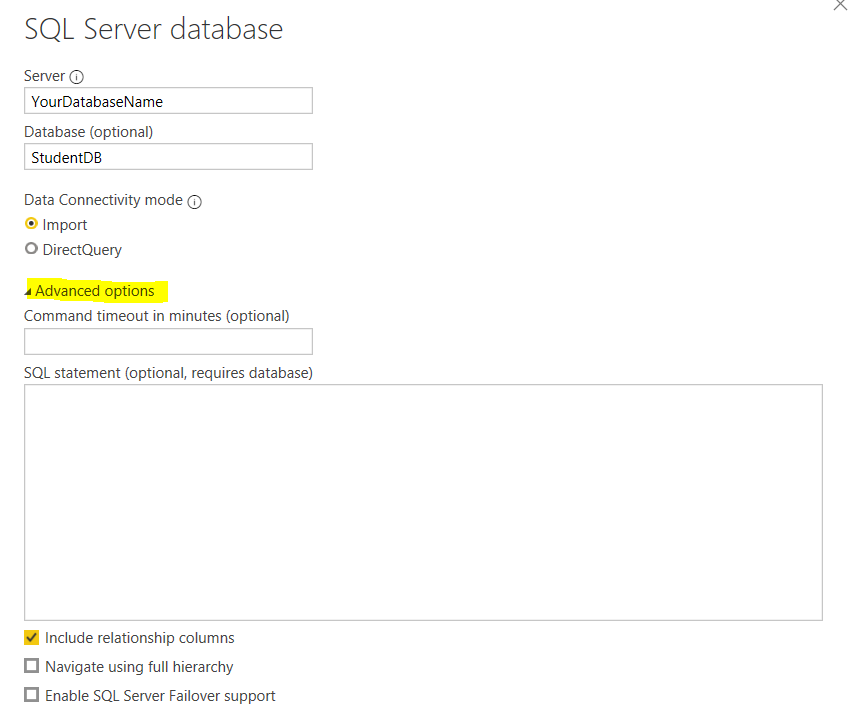
In this article, we will use the Import option. If you click the Advanced options link (highlighted below), you will see more import options. For example, you can execute SQL statements to import customized data. The advanced options are shown in the following screenshot.
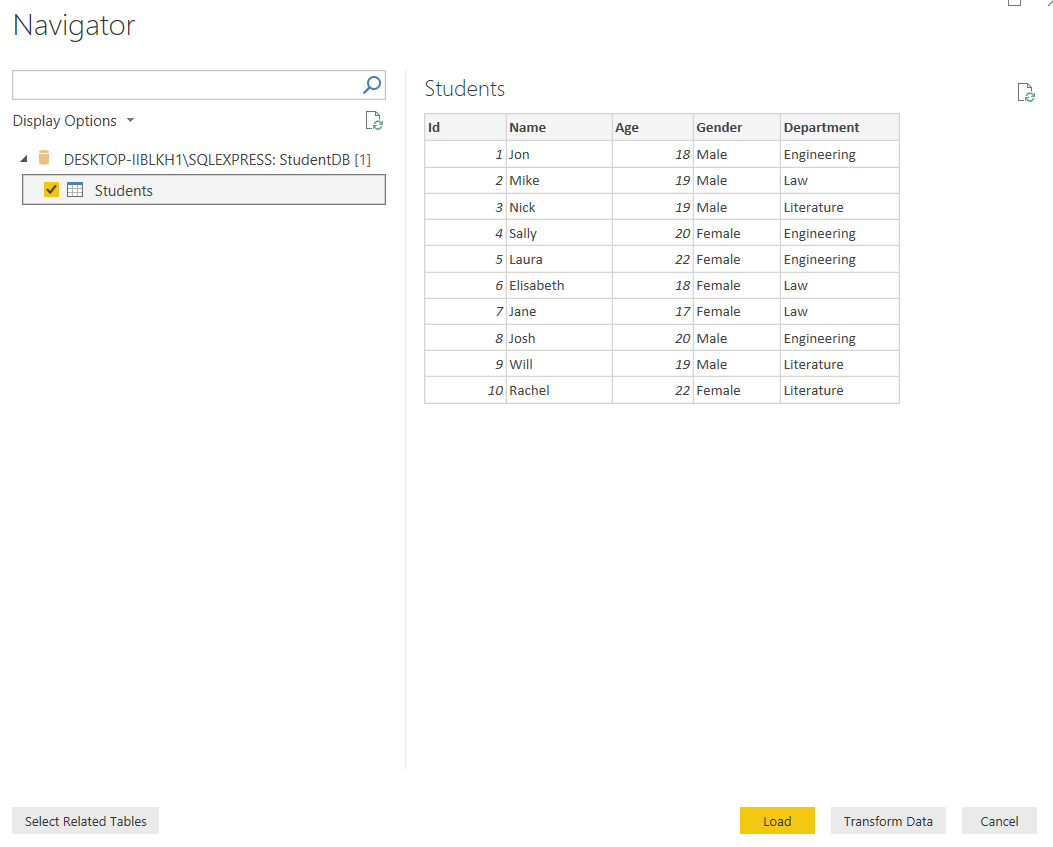
Shortly after you click the OK button, you will see that the StudentDB dataset has been imported and that the Students table is displayed in the Navigator as shown below.
To import the table, tick the checkbox next to the Students table name and click the Load button.
You should then see the Reports view as below.
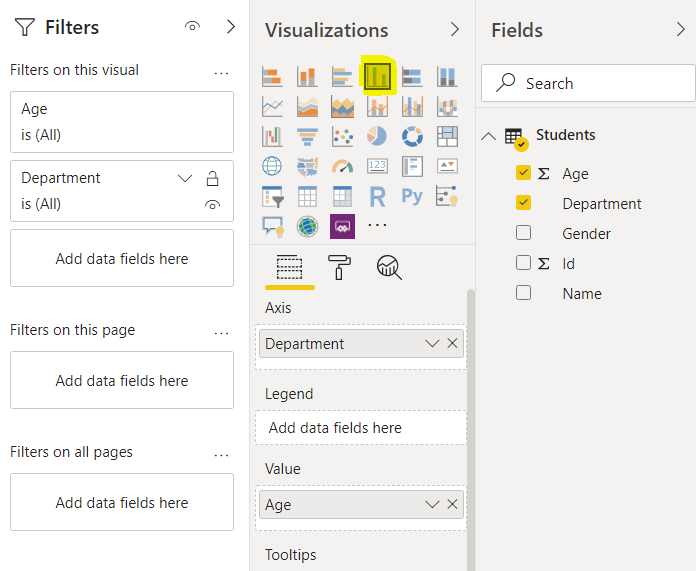
To create a graph you simply select the type of graph you would like from visualizations and drag the table columns you would like to visualize into the appropriate sections below ( ‘Axis’, ‘Legend’, Value’ etc) to plot a graph.
In the screenshot below, we have selected a “Clustered Column Chart”, using the ‘department’ data for the Axis and ‘Age’ for the Value field.
By default, you should see the sum of ages for the students in different departments as shown below:
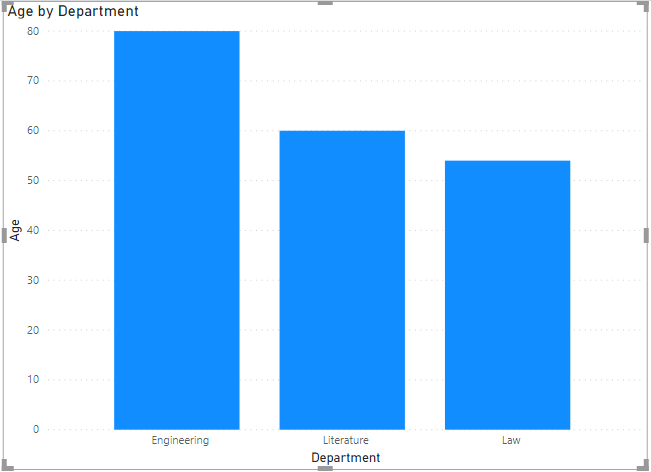
The result shows that in our dataset, the sum of the ages of the students from the Engineering department is higher than the sums of the ages for the Literature and Law departments.
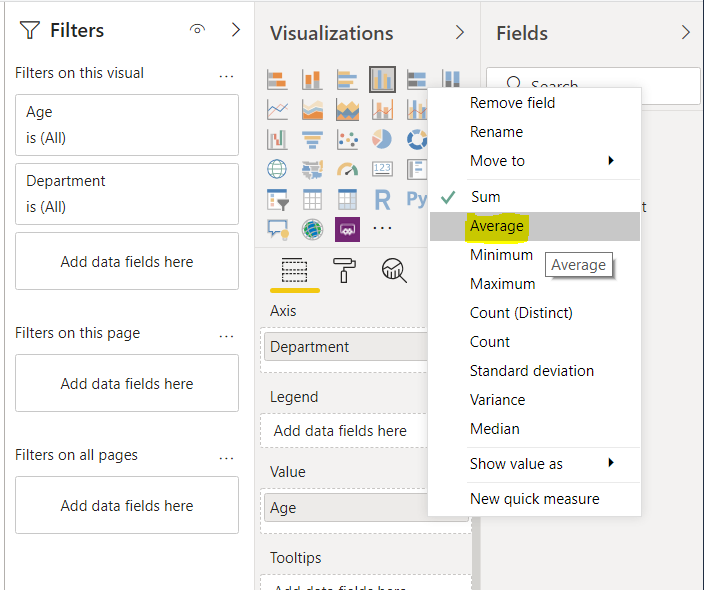
If you want to see the average student age, instead of the sum of their ages, click the downward triangle next to the Value field and it will bring up a list of options relating to the data selected.
In this case, select ‘Average’.
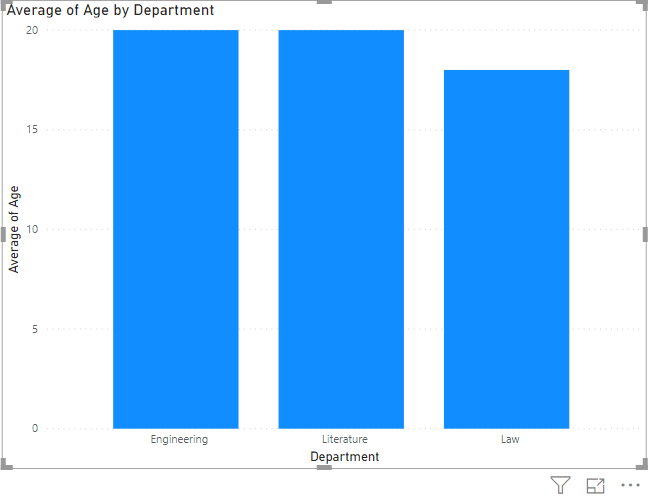
The output below shows the average age values per department. It shows that on average the ages of students in the Engineering and Literature departments is the same, while the average value of the ages of students in the Law department is slightly lower.
In the next section, you will see how to import data from the MySQL database into Power BI.
Importing data from MySQL into Power BI
Like MS SQL Server, we will first create some dummy data before we can import it in Power BI. Execute the following scripts to create a dummy database at MySQL Server.
Creating dummy data in MySQL
|
1 2 3 4 5 6 7 8 9 10 11 12 13 14 15 16 17 18 19 20 21 |
CREATE DATABASE studentDB CREATE TABLE students ( Id INT AUTO_INCREMENT PRIMARY KEY, Name VARCHAR(50) NOT NULL, Age INT, Gender VARCHAR(50), Department VARCHAR(50) NOT NULL ) INSERT INTO students (Name, Age, Gender, Department) VALUES ( 'Jon', 18, 'Male', 'Engineering'), ( 'Mike', 19, 'Male', 'Law'), ( 'Nick', 19, 'Male', 'Literature'), ( 'Sally', 20, 'Female','Engineering'), ( 'Laura', 22, 'Female','Engineering'), ( 'Elisabeth', 18, 'Female','Law'), ( 'Jane', 17, 'Female','Law'), ( 'Josh', 20, 'Male','Engineering'), ('Will', 19, 'Male','Literature'), ('Rachel', 22, 'Female','Literature') |
Importing data from MySQL to Power BI
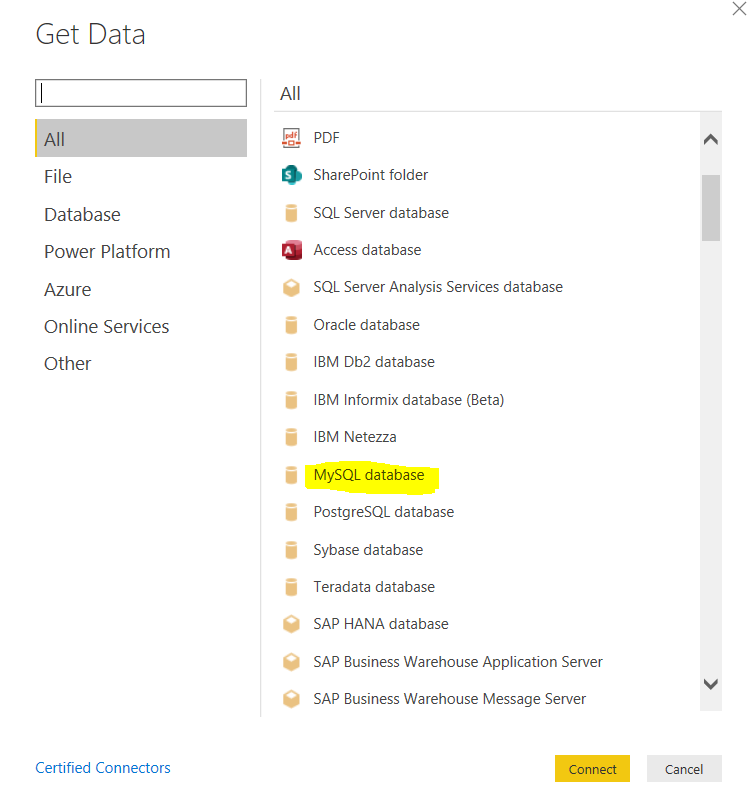
The process of importing data from MySQL to Power BI is quite similar to that of importing data from SQL Server. You first have to click on the “Get Data” option on the menu bar and from the list of data sources, select MySQL database as shown in the screenshot below:
Once you click the Connect button, you should see the following error.
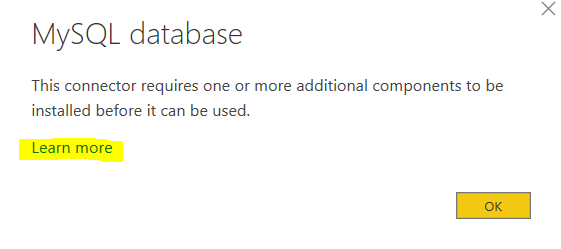
The error states that before in order to connect Power BI with MySQL Server you need to install a driver that acts as a connector between Power BI and MySQL Server.
To download the driver, click on the “Learn more” option in the above screenshot or you can simply go to this link: https://dev.mysql.com/downloads/file/?id=412152
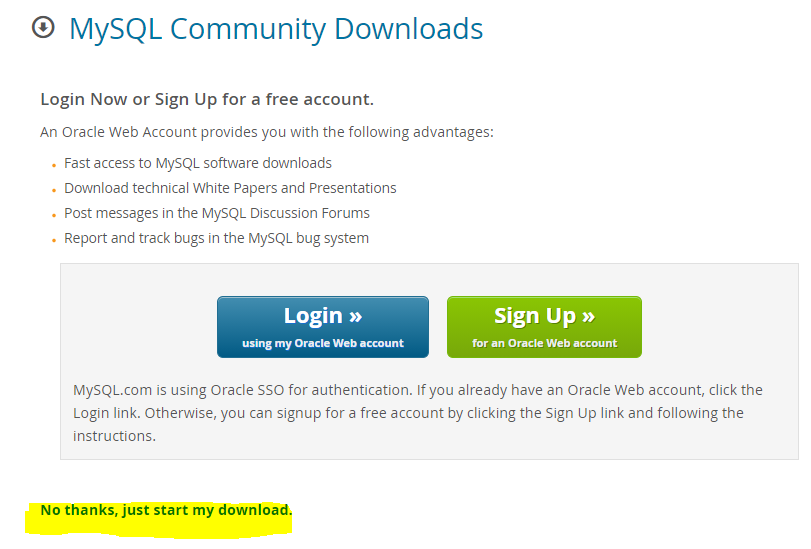
You should see the following page. Click the “No thanks, just start my download” link highlighted in yellow below, to download the connector.
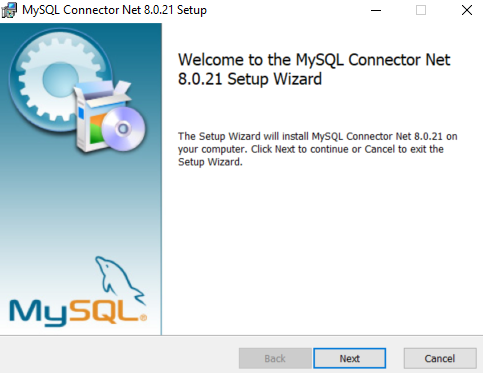
Open the downloaded executable file for the connector. You will see the following dialogue box. Click the ‘Next’ button.
You will see the following three download options. You can select any of them.
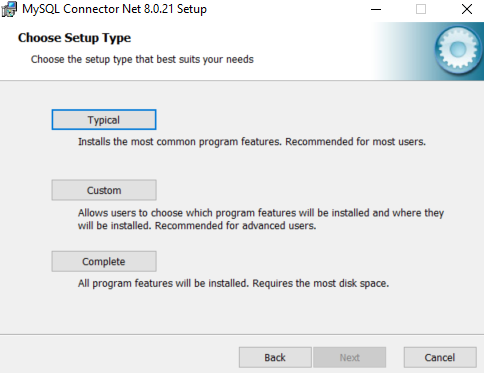
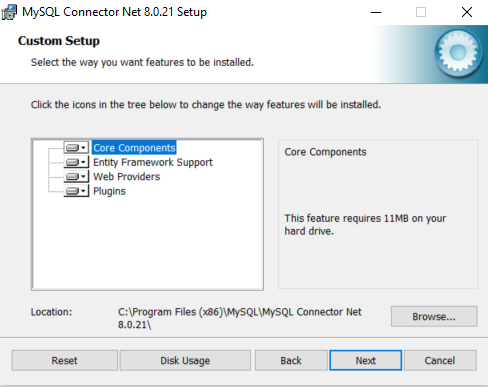
For this article, we will use the “Custom” download option and click the Next button.
You will see the following screen. Click the Next button again on the following dialogue box.
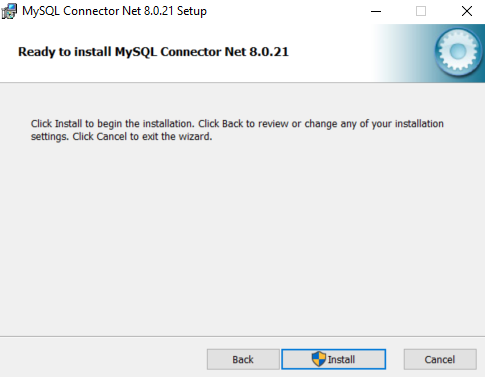
Finally, to install the connector, click the Install button. Look at the following screenshot for reference.
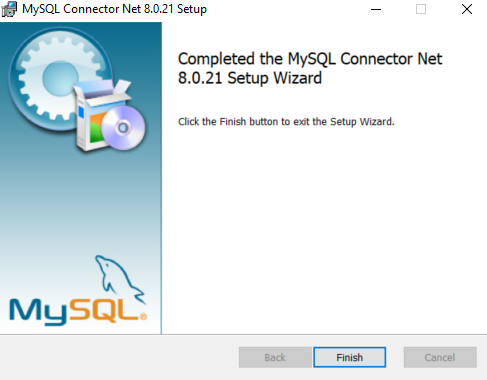
Once the installation is completed successfully, you should see the following dialogue box. Click the Finish button.
Restart Microsoft Power BI and again select MySQL database from the list of data sources as was shown in the screenshot above. Click the Connect button.
This time the import will move forward correctly.
The following dialogue box will appear. Enter the name of MySQL Server and database name that you want to import from and click the OK button.
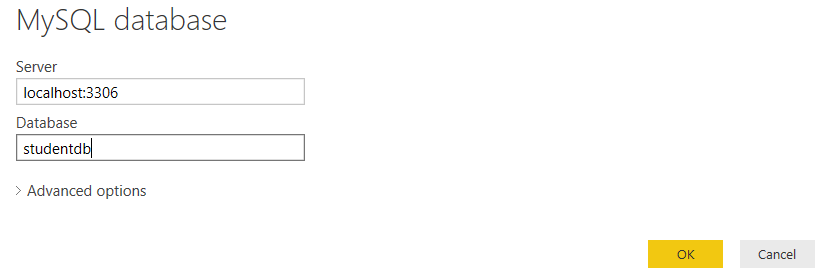
It is important to mention that unlike SQL Server, for MySQL, you only have the option to import the data image and you cannot execute direct queries on the dataset.
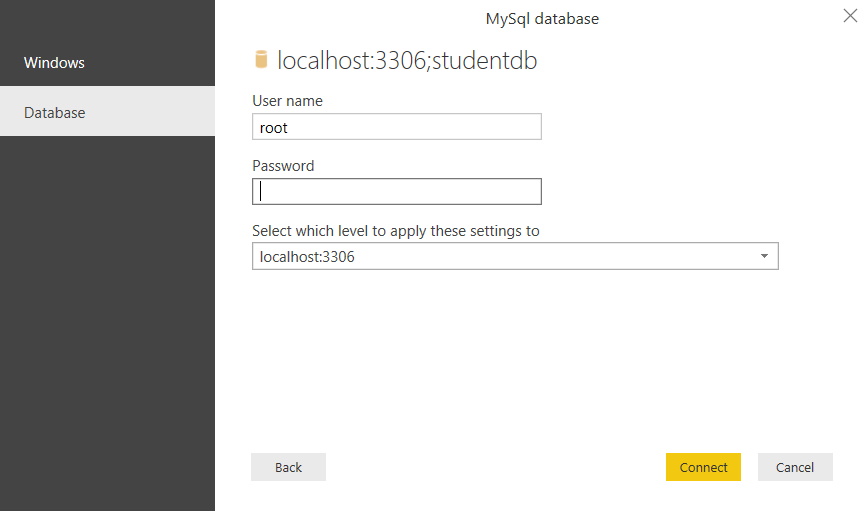
Next, you will need to specify the user name and password that you use to connect to the MySQL server. In the following dialogue box, enter the user name and password that you use to access your MySQL Server.
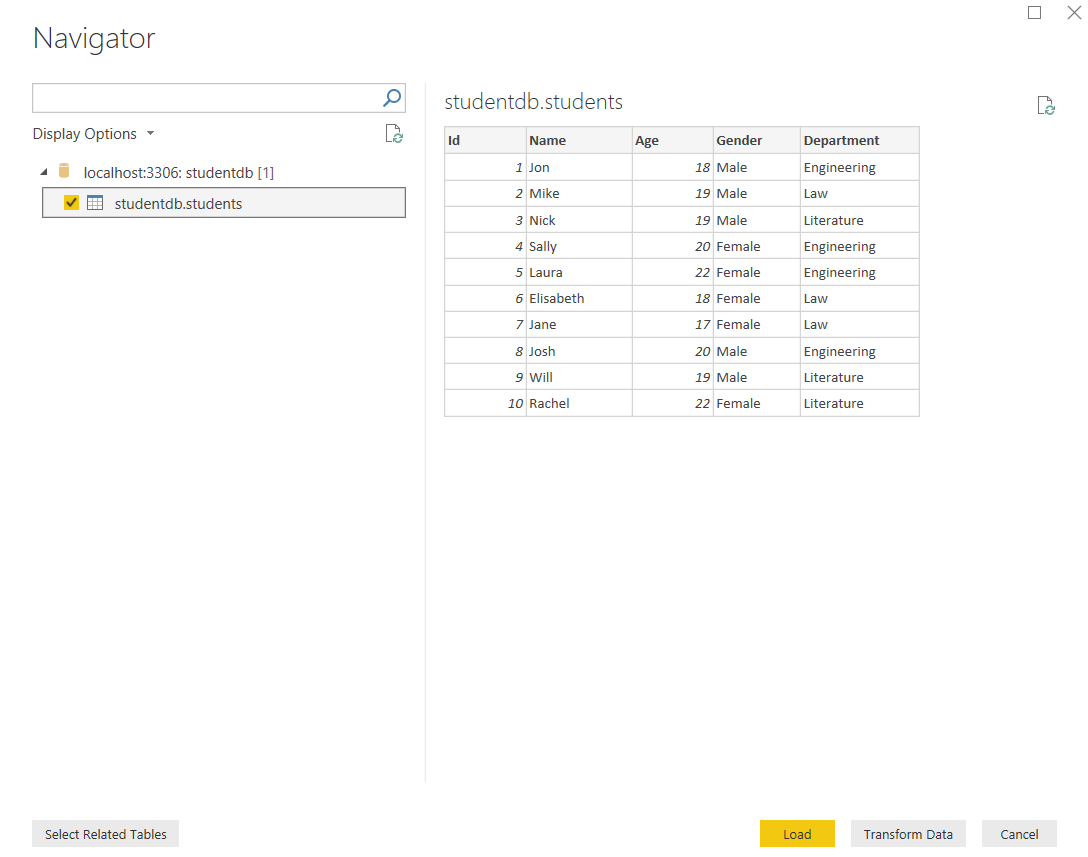
You will be connected to the MySQL Server and your Server and database names will be visible in the navigator. You will also be able to see all of the tables in your database. Only one is showing below as our dummy database only has one small table in it.
To import the dataset from the students table, tick the checkbox next to the students table and click the Load button.
You should now see the table and column names in Reports view – see below.
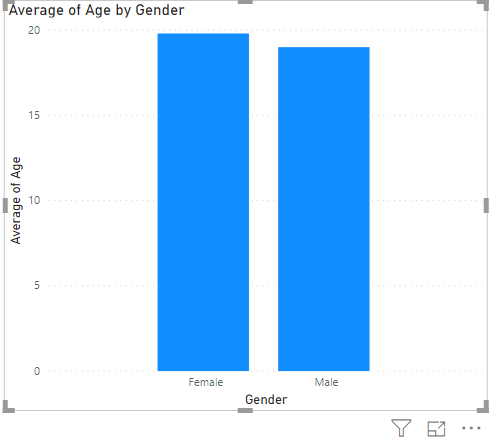
From here, you can create all sorts of different charts. As an example, in the screenshot below, I’ve selected a “Clustered column chart”. The Gender of students will be used for the x-axis while the values shown will be the students’ average ages.
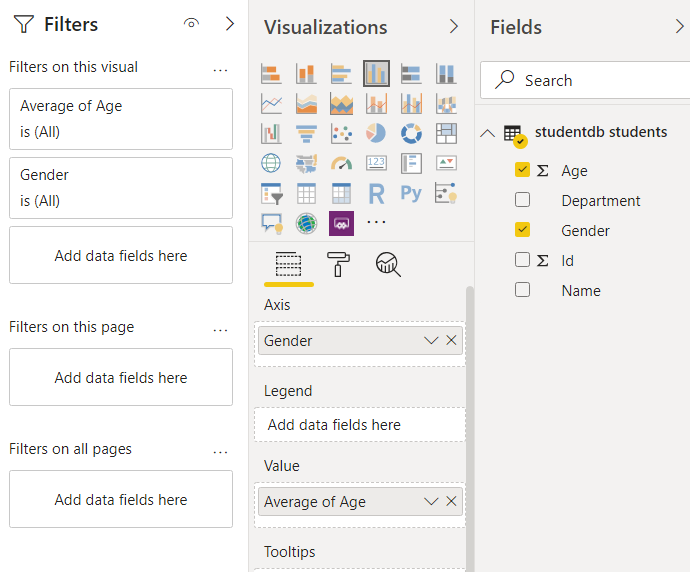
The output shows that on average, female students are slightly older than male students.
Conclusion
In this article, you learned how to import data from MS SQL Server and MySQL into Power BI. To import data from SQL Server, you can directly connect Power BI to SQL Server. However, for MySQL, you need a connecter that connects MySQL with Power BI. The article also showed how to plot a simple Power BI graph using a dataset imported from MS SQL Server and MySQL.

View all posts by Ben Richardson
- Working with the SQL MIN function in SQL Server - May 12, 2022
- SQL percentage calculation examples in SQL Server - January 19, 2022
- Working with Power BI report themes - February 25, 2021