

Page Life Expectancy (PLE) is an age of a data page in seconds in the buffer cache or buffer memory after querying the tables with the loading data page into the buffer memory. Page Life Expectancy value indicates the memory pressure in allocated memory to the SQL Server instance. In most of the cases, a page will be dropped from buffer periodically.
The basic fundamental of Microsoft SQL Server for querying data is to load the necessary data pages into the buffer pool from the disk and return it to the client. If the buffer does not have enough space to process it, then the oldest data pages will be eradicated to make some room as required for new pages.
As a traditional standard, PLE (Page Life Expectancy) should not be less than 300 seconds (5 Minutes), but actually, that value can fluctuate based on the SQL Server load. Anyway, a buffer is managed by the numa node, and that can be divided into the multiple numa nodes. Even, it can be more challenging to manage load distribution for the various numas when heavy workload occurs. PLE can raise performance issues by building pressure on buffer when your PLE goes down and not coming up for a while. There can be many more activities which can cause this issue.
- Index Maintenance
- Big Queries (i.e., Report Query)
- Queries with an improper and less efficient execution plan
- Data Migration Activity
- Parameter Sniffing issue
- Duplicate Indexes
- Multiple Execution Plans for a single procedure and many more
Get PLE for your SQL Server instance with the help of T-SQL statement
|
1 2 3 |
SELECT* FROM sys.dm_os_performance_counters WHERE [counter_name] = 'Page life expectancy' |
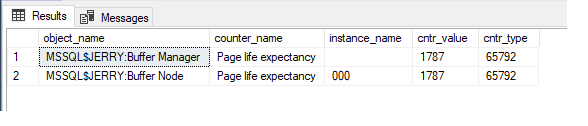
Here, cntr_value represents the PLE which is 29570 in the above query result set.
We always assume that the query performance is degrading by the lake of buffer memory, and SQL Server does not have enough buffer pool to cache the information. It is not blaming the side for the worst query performance because a query execution plan is everything. If your query plan is improper, then the table will be scanned with unnecessary loading data to the buffer memory.
The above situations discuss the factors on what PLE can get down. But what about PLE getting down at a specific time? Hopefully, each production SQL Server will have the internal data maintenance task and standard maintenance, which is running by the SQL Server job and executing on the off-peak hours. Even, you can observe fluctuation in PLE (Page Life Expectancy) when any heavy I/O performs by the SQL Server with the big CRUD operation.
Monitoring Page Life Expectancy
PLE counter value is an essential measurement of pressure on the buffer memory in units of seconds. Users can capture it with the help of SSMS, any other third-party tools, or Microsoft performance monitor; It returns average value always. Users can find the current value by the above T-SQL statement. Still, analysis is required in a particular period to see if fluctuation happens in point of time. Users can use the Windows Performance Monitor by adding the PLE counter to track the same.
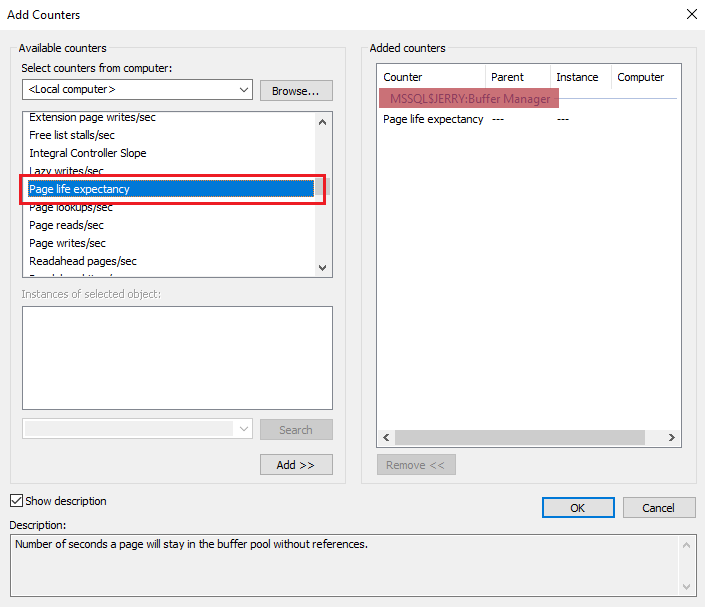
Multiple SQL Server instances can be configured in single SQL Server. For monitoring a particular SQL Server instance, the user can select in the counter drop-down list of the performance monitor screen. In the below image, you can see that the PLE counter exists in MSSQL$JERRY: Buffer Manager.
Here, MSSQL$JERRY is SQL Server instance service details, and Buffer Manager is the object name.
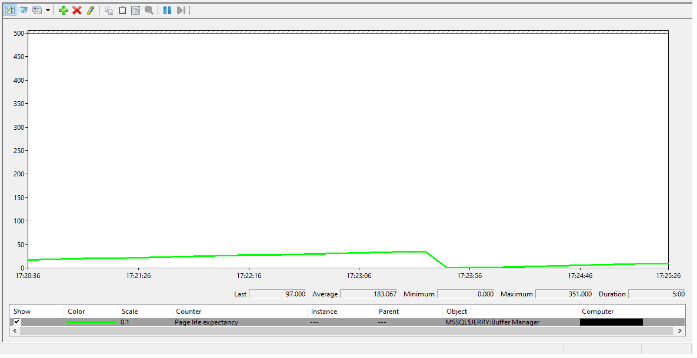
For example, the above SQL Server instance service is restarted to get some fluctuation in Page Life Expectancy. After restarting it, the PLE count starts from 0 and increases with the querying data in the background. Again count is decreased when memory allocation is reduced and data is fetched from the tables in the background.
Here, we can conclude that the PLE count will be decreased when buffer memory does not have enough space to store new data pages when any READ/WRITE operation is performed.
How to Calculate Page Life Expectancy
As per Microsoft standard, we follow a rule of 300 seconds. If PLE goes less than 300 seconds (5 Minutes), then memory pressure is very high, and we have to take care of the performance side. Still, that calculation was for just 4GB memory allocation to the SQL Server. For your server, it should be different as per the formula. You should worry about the SQL Server instance when PLE goes down than the below calculation:
PLE (Page Life Expectancy) threshold = ((Buffer Memory Allocation (GB)) / 4 ) * 300
For example, the machine is configured with 128GB, and 110GB is allocated to the SQL Server instance, then the PLE threshold will be as below:
PLE (Page Life Expectancy) threshold = (110 / 4) * 300
PLE (Page Life Expectancy) threshold = 8250 Seconds
No one can say that what number will be recommended for the standard threshold because each SQL Server has different configurations according to the use case and requirement. If your PLE goes down suddenly, then the first thing should be to check memory allocation. Is it enough amount of size for the SQL Server? If yes, then check the currently executing request, is there any long-running thread that consumes more memory? If yes, then review the currently executing query statement.
The performance will be based on the disk, which is a bit slower than the primary memory. Eventually, it produces a lot of disk IO and stresses on the storage because the memory is not getting processed efficiently by the server. Unnecessary memory usage issue should be observed and take a chance to get it optimized with a proper investigation.
- Which objects are using the more buffer cache memory?
- Allotment of object indexes and partitions are accurate and effective?
Users can monitor it with querying on sys.dm_os_performance_counters DMV to find that PLE threshold is crossing the underline or not. If the counter value found is less than your calculation, then it should trigger a mail to the responsible team to observe and monitor the memory pressure-related parameters. We get the indication regarding the increased pressure on the buffer pool when page life expectancy drops down to a typical value and stays there for a more extended period. Possibly this is the sign that we might need more memory. It is advisable to add more memory when the workload is hiking gradually, and PLE is moving downward sluggishly. However, when something else is using more memory (e.g., plan cache). In this scenario, buffer pool pressure is increased, but there is no change in workload. A consecutive monitor enables the ability to measure stuff and evaluate it over more issues. After doing this, it is possible to let OpsMgr check the value and generate an alert when the value meets a specific threshold for X values.
Conclusion
PLE (Page Life Expectancy) is not a single buffer manager parameter which can affect the SQL Server performance; there are many more in the list of buffer manager. We can consider that the buffer memory pressure can be the primary issue if found. Nowadays, we see bigger memory boxes and quite common to have PLE in the thousands range.
There are a lot of things to monitor for DBAs in the production environment. If you encounter any buffer memory side issue, Windows Performance Monitor helps a lot to observe real-time statistics.

View all posts by Jignesh Raiyani
- Page Life Expectancy (PLE) in SQL Server - July 17, 2020
- How to automate Table Partitioning in SQL Server - July 7, 2020
- Configuring SQL Server Always On Availability Groups on AWS EC2 - July 6, 2020