

Introduction
Intended audience
This document is intended for application developers and database administrators who are willing to learn how to generate charts from data stored in Microsoft SQL Server using PowerShell.
Context
Let’s say you have some data stored in a SQL Server box and you want to build a chart. The easiest way to do it will be to:
- SQL Server Management Studio
- Connect to the SQL Server Instance of you choice
- Run a T-SQL query that returns exactly the data you want
- In SSMS results data grid, select everything, hit CTRL+C
- Open a Microsoft Excel (or OpenOffice Calc) spreadsheet
- Paste the results in that spreadsheet
- Build a chart inside the spreadsheet
While these steps are pretty simple, it requires manual intervention and quite a long time to get what we want. What if there were a solution that would cover your needs and do the job in such a simple step like running a PowerShell Script?
It’s actually possible using the System.Windows.Forms.DataVisualization assembly from .NET Framework.
For a better reading experience, it has been decided to publish two articles: one that is more likely to explain the tool used to build charts and the other one to provide more practical examples.
In this article, we will discuss how to load an assembly, what classes, which properties and methods of the DataVisualisation assembly should be considered to create a chart and either display it on screen or store it into an image (JPG, PNG…) file. Practical examples will come in a separate article.
Let’s get it charted!
What is an assembly and how to load one in PowerShell
What is a namespace
Before going any longer in this document, let’s define a word that will come out frequently: namespace.
A namespace is a collection of classes that are grouped for logical code organization, like we would do in any object-oriented programming language, and name collision avoidance.
Here are some common namespaces in .NET Framework:
- System
- System.IO
- System.Security
- System.Speech
- System.Windows.Forms
What is an assembly
If we look at Microsoft’s documentation page on the subject, we will see that an assembly is a collection of types and resources that are grouped to make a logical unit of functionality.
In short, it’s some precompiled code that can be executed by .NET RunTime. Physically speaking, each assembly is stored as an executable file (.exe) or a library file (.dll). Logically speaking, an assembly can contain one or more namespace(s-.
Whenever we create a Windows Application, a Windows Service or any other piece of software and we want to be able to take advantage of the features provided by an assembly, we need to tell .NET runtime to load it.
As PowerShell is a Windows Application itself, it’s launched by .NET RunTime and already loads some assemblies that it needs to actually be able to start successfully. As a result, a PowerShell user can use methods like [string]::isNullOrEmpty() or [System.IO.File]::ReadAllBytes() inside PowerShell.
How to load an assembly inside PowerShell
PowerShell features can be extended using some of these .NET Methods and that’s exactly what we will do in order to load the System.Windows.Forms.DataVisualization assembly!
In first PowerShell versions, we will use a method called LoadWithPartialName from the System.Reflection.Assembly namespace.
Here is the way we can call it.
|
1 2 3 |
[void][System.Reflection.Assembly]::LoadWithPartialName( "System.Windows.Forms.DataVisualization" ) |
But this method is marked as “obsolete” by Microsoft.
A replacement method could be to use following command:
|
1 |
Add-Type -AssemblyName "<AssemblyName>" |
Example:
|
1 |
Add-Type -AssemblyName "System.Windows.Forms.DataVisualization" |
Overview of DataVisualization Namespace
Dissecting a simple chart example
Before diving into the details of this namespace, let’s first review what are the components of a chart, conceptually speaking.
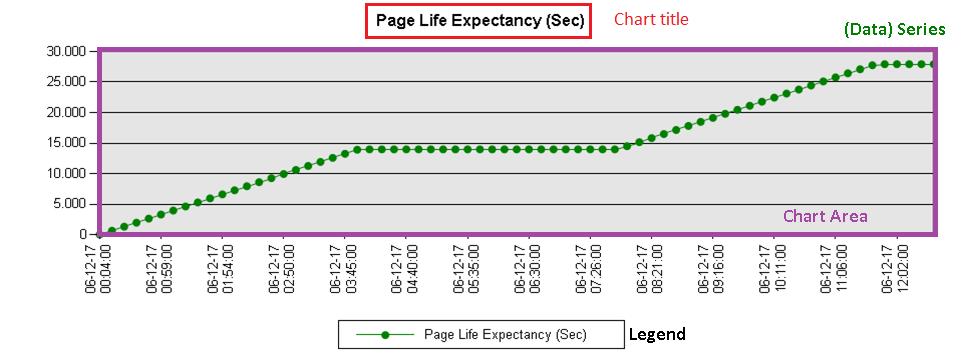
You will find below a sample chart.
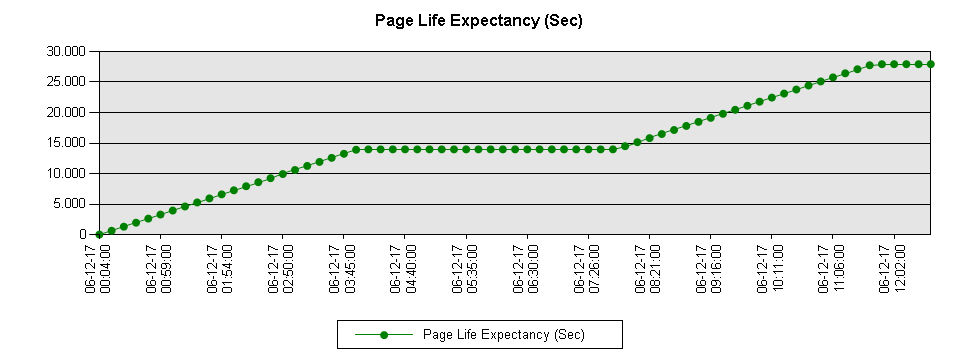
First, there is a title in this chart, then there is a chart area, a grid with at least two axes in which one or more data series will be found. Each data series consists in a set of (key,value) pairs. Finally, we can put a legend to our chart so that it tells which data series corresponds to which data type.
PowerShell classes we need to know in order to build a chart
The developers of DataVisualization assembly did the same kind of work and segmented their code somewhat the same way.
First, they defined a Chart class. All other objects presented below are attached to this object as direct attributes or attributes of its attributes (cascading dependency). It has a lot of properties that governs the way the chart will be displayed so as chart width and chart length or background color properties.
They also defined a ChartArea class which defines the way the chart grid will look like, what will be the titles for each axis of the chart and so on. There can be multiple ChartAreas for a single Chart object instance. We can define properties like intervals or data types for each axis per ChartArea object instance.
Obviously, we will also find a Series class which holds the actual data that will be plotted in a given chart area.
As explained above, series are like a set of (key,value) pair which are referred to as data points. In DataVisualization namespace, these points have a corresponding object class called DataPoint.
Each series can be assigned a chart type. These types are defined in an enumeration called System.Windows.Forms.DataVisualization.Charting.SeriesChartType.
Here are some common chart types that will eventually be used in following sections:
- Bar
- Line
- Pie
- StackedArea(100)
- StackedBar(100)
For a complete list, check the documentation page.
In our dissection of a chart, we also noticed that a chart had a legend. There is also a class called Legend to materialize it.
To sum up, here are the object classes we defined so far with a link to its corresponding documentation page:
NB: we could also create charts in 3D using a class called ChartArea3DStyle, but it’s not covered in this article.
Conclusion
In this article, we’ve just covered some of the aspects of a Chart, presenting the namespace defined in the System.Windows.Forms.DataVisualization assembly and some of the classes that will be helpful in the creation of charts.
Stay tuned because we will put into practice what we’ve learned so far in another article entitled “How to create charts for SQL Server data in PowerShell” that will come up in a few days!
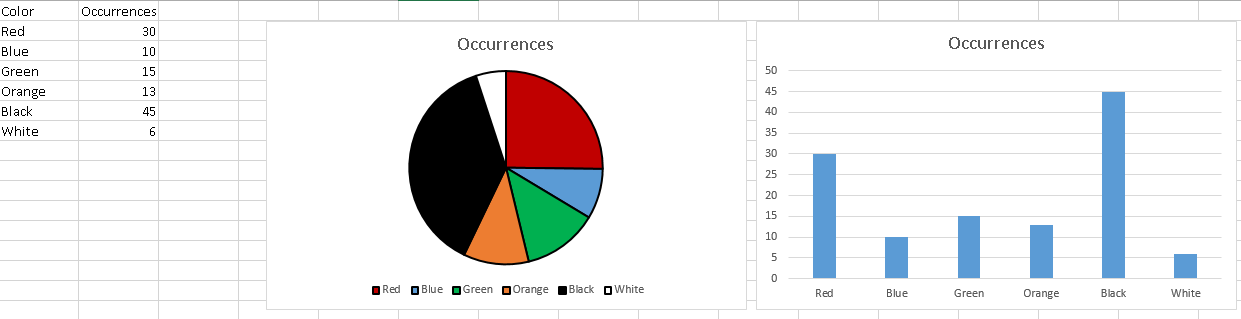
In next article, you’ll be able to build these kinds of charts using PowerShell:
Next article in this series:

I'm one of the rare guys out there who started to work as a DBA immediately after his graduation. So, I work at the university hospital of Liege since 2011. Initially involved in Oracle Database administration (which are still under my charge), I had the opportunity to learn and manage SQL Server instances in 2013. Since 2013, I've learned a lot about SQL Server in administration and development.
I like the job of DBA because you need to have a general knowledge in every field of IT. That's the reason why I won't stop learning (and share) the products of my learnings.
View all posts by Jefferson Elias
- How to perform a performance test against a SQL Server instance - September 14, 2018
- Concurrency problems – theory and experimentation in SQL Server - July 24, 2018
- How to link two SQL Server instances with Kerberos - July 5, 2018