
Sometimes people use nolock hint as a “turbo” button for their queries, assuming that not taking locks will speed up the query execution. There are many good articles describing all the dangerous moments of this approach, because of the read uncommitted isolation level. However, the focus of this article is a performance problem that you may encounter using nolock hint in some cases.
Let us setup some test data first.
I am using Microsoft SQL Server 2014 – 12.0.2342.0 (X64) for this article, but the problem may be also reproduced on the earlier versions, however, because of the small differences in the costing model heuristics, there might be another number of test rows.
Test Data
We are creating the new DB and setting compatibility mode to 110 to force old cardinality estimation behavior. Then two simple tables t1 and t2 are created and filled up with 35 000 and 160 000 rows accordingly. Pay attention that the column t2.b is nullable.
|
1 2 3 4 5 6 7 8 9 10 11 12 13 14 15 16 17 18 19 20 21 22 23 24 25 26 |
create database NoLockDB; go alter database NoLockDB set compatibility_level = 110; go use NoLockDB; go if object_id('t1') is not null drop table t1; if object_id('t2') is not null drop table t2; go create table t1(a int primary key identity, b int, c char(350) not null default('')); create table t2(a int primary key identity, b int, c char(50) not null default('')); go with c as ( select top(35000) rn=row_number() over(order by(select null)) from master..spt_values v1,master..spt_values v2,master..spt_values v3 ) insert into t1(b) select convert(varchar(10), rn) from c; with c as ( select top(160000) rn=row_number() over(order by(select null)) from master..spt_values v1,master..spt_values v2,master..spt_values v3 ) insert into t2(b) select rn from c go dbcc freeproccache; -- clear cache. go |
Problem
Now, let’s issue two identical queries, that check existence of t1.b values in t2.b column. I use MAXDOP query hint, to keep the plan shape simple, but the problem is also reproduced without DOP restriction in parallel plans.
|
1 2 3 4 5 |
set statistics time, xml, io on; select * from t1 where b not in (select b from t2) option(maxdop 1); select * from t1 where b not in (select b from t2 with(nolock)) option(maxdop 1); set statistics time, xml, io off; go |
Run them a couple of times to warm up cache, and observe the timing results.
CPU time = 281 ms, elapsed time = 428 ms.
CPU time = 11828 ms, elapsed time = 13070 ms.
The second query is more than 30 times slower (on my machine).
The IO statistics is also interesting:
Table ‘Workfile’. Scan count 0, logical reads 0, physical reads 0, read-ahead reads 0, lob logical reads 0, lob physical reads 0, lob read-ahead reads 0.
Table ‘Worktable’. Scan count 0, logical reads 0, physical reads 0, read-ahead reads 0, lob logical reads 0, lob physical reads 0, lob read-ahead reads 0.
Table ‘t2’. Scan count 3, logical reads 107680, physical reads 0, read-ahead reads 0, lob logical reads 0, lob physical reads 0, lob read-ahead reads 0.
Table ‘t1’. Scan count 1, logical reads 1598, physical reads 0, read-ahead reads 0, lob logical reads 0, lob physical reads 0, lob read-ahead reads 0.
Table ‘Workfile’. Scan count 0, logical reads 0, physical reads 0, read-ahead reads 0, lob logical reads 0, lob physical reads 0, lob read-ahead reads 0.
Table ‘Worktable’. Scan count 0, logical reads 0, physical reads 0, read-ahead reads 0, lob logical reads 0, lob physical reads 0, lob read-ahead reads 0.
Table ‘t2’. Scan count 3, logical reads 37678, physical reads 0, read-ahead reads 0, lob logical reads 0, lob physical reads 0, lob read-ahead reads 0.
Table ‘t1’. Scan count 1, logical reads 1598, physical reads 0, read-ahead reads 0, lob logical reads 0, lob physical reads 0, lob read-ahead reads 0.
The second slow query has 3 times less reads than the first, the fast one.
If we look at the plans we will see that they are very similar and have the same cost of 12.7057 units.
Explanation
Experienced SQL user, even without looking at the query plan, may say, that writing a query using NOT IN clause, where nulls are possible in subquery is very dangerous and leads to mistakes, but now the question is: why the second execution is 30 times slower, though the plans seems identical. (We may invent another example where the difference would be 100x or more times slower).
First, let’s look at the plan in general.
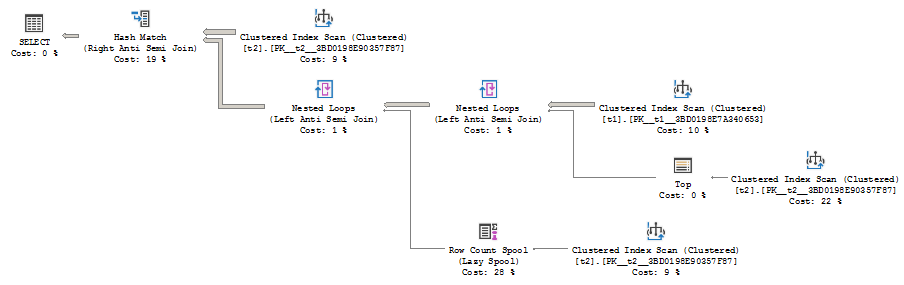
The plan is quite complex, for that simple query, and has four access operators (Clustered Index Scans), the Spool operator, the Top operator and three joins. The reason for this complex plan is that the Query Optimizer (QO) should build a plan with concern, that no rows should be returned if at least one NULL value is encountered in t2.b column.
With that semantic goal, the QO uses various optimization techniques. One of those optimizations is to use a Top operator. The Top operator is not necessary for the result correctness in this case, because we have Left Anti Semi Join as a logical join operation (Anti Semi join is not an Inner or Outer join, it only checks for not existence and does not need a complete join result). However the optimizer may still benefit from the Top to avoid the full scan of the second table.
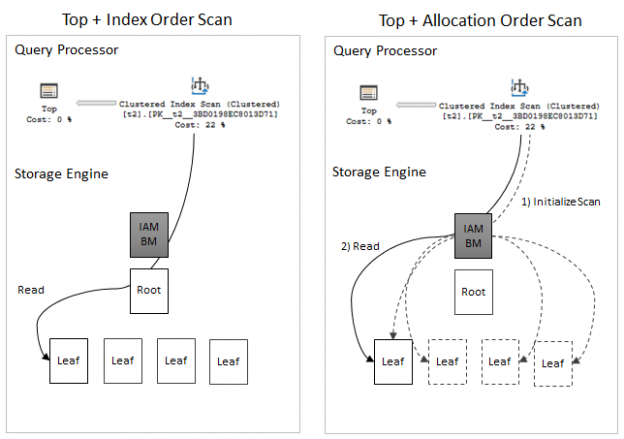
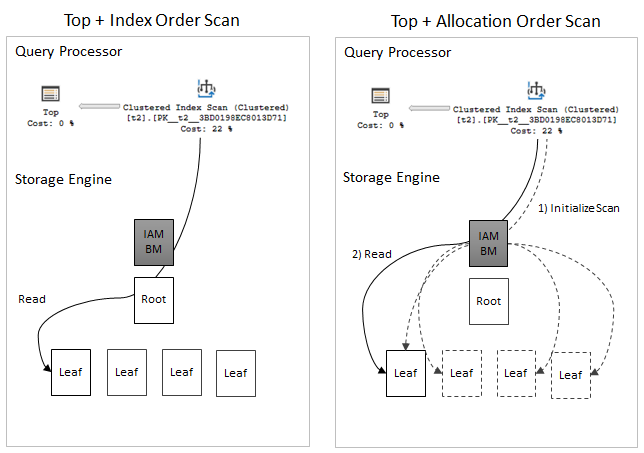
Now a few words about the NOLOCK hint. A long time ago, there was a great article in SQL Server Storage Engine Blog about two scanning techniques: Index Order Scan and Allocation/IAM order scan. The point is that if the QO does not demand rows in any specific order the Storage Engine may choose, whether to scan the index in the index page order or use Index Allocation Maps (IAM) pages to scan index in the allocation order. However, the allocation order scan is more vulnerable to inconsistency errors and server chooses it only if no such errors are possible (e.g. the table is locked with tablock hint) or we don’t care about these errors (e.g. nolock hint – this is our case). Unfortunately, we cannot distinct those two types of scan from the query plan, but this is the key difference between these to query executions.
One interesting thing about an allocation order scan is that it has an extra startup cost. It enumerates every leaf page that it is going to scan every time the scan is performed. The reason for that, according to the documentation, might be the following:
When we don’t use a nolock hint, SQL Server uses an index order scan that has not as much startup cost as an allocation order scan has. The Top operator prevents scanning the whole table every time. When a nolock hint is used a server decides to use allocation order scan. Considering the scan operator is located on the inner side if the nested loops join we get the initial startup cost penalty for every execution of the inner side of the join. This lead to multiple function calls inside SQL Server and high CPU consumption.
To put it all together – I tried to draw a simple picture to illustrate the conception.
Consider the following call stack (from WinDbg converted to XML):
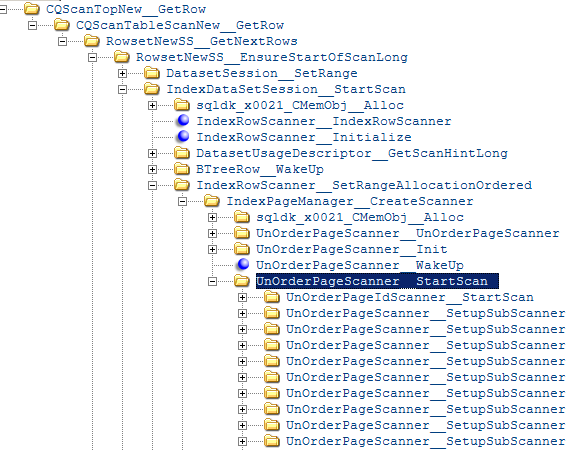
And each scanner calls the following methods:
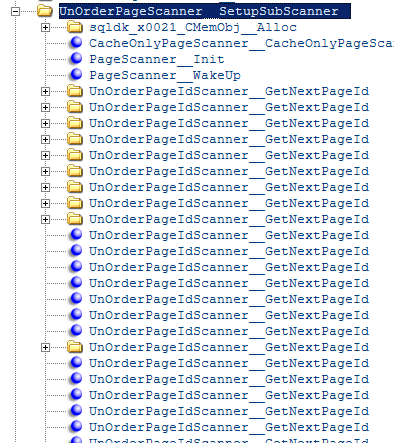
And this is done for every single loop iteration.
If we attach a debugger we can compare the number of instruction per execution:
Index Order Scan: 22 516 function calls per execution
Allocation Scan: 641 340 function calls per execution
This explains high CPU time, that we may see in the statistics time output.
We may also do simple rough calculations of the IO reads:
Reads = 1334(t2 scan) + 1334(t2 scan under spool) + 35000(exec count of t2 scan on the loop join inner side)*3 (t2 index depth)*1(approximately one page per execution) = 107668 reads – roughly corresponds with 107680 actual reads
Reads = 1334(t2 scan) + 1334(t2 scan under spool) + 35000(exec count of t2 scan on the loop join inner side)*1(approximately one page per execution) = 37668 reads – roughly corresponds with 37678 actual reads
It seems odd at first glance that the query that has less reads executes much longer, but now it is clear, I hope. The difference is what types of pages (Root or IAM) are used to get the first leaf page and how those page reads are counted in the statistics output.
How to avoid the problem
Using NOT IN with nullable column is like a timing bomb. Even if now everything seems fine, as soon as one NULL values will appear in subquery, no rows at all will be produced. Usually, it is undesired behavior.
If we rewrite our query in a more safe way, like:
|
1 2 3 4 5 |
set statistics time, xml, io on; select * from t1 where not exists (select b from t2 where t2.b = t1.b) option(maxdop 1); select * from t1 where not exists (select b from t2 with(nolock) where t2.b = t1.b) option(maxdop 1); set statistics time, xml, io off; go |
CPU time = 109 ms, elapsed time = 112 ms.
CPU time = 110 ms, elapsed time = 165 ms.
The problem is gone, both queries are fast and the plan shape is much simpler.
With this rewrite, we changed the semantics of the query and now the Query Optimizer has no need to be concerned with null values in subquery.
Another good thing is to define a column as not nullable if no nulls are possible there. The optimizer may use that information while building a plan.
The last piece of advice, would be of course, do not use the nolock hint as a “turbo” button, unless you realize all the consequences.
References
- Managing Space Used by Objects
- Reading Pages
- SQL Server Performance Tuning: Data Access Method
- When can allocation order scans be used?

Currently he works as a database developer lead, responsible for the development of production databases in a media research company. He is also an occasional speaker at various community events and tech conferences. His favorite topic to present is about the Query Processor and anything related to it. Dmitry is a Microsoft MVP for Data Platform since 2014.
View all posts by Dmitry Piliugin
- SQL Server 2017: Adaptive Join Internals - April 30, 2018
- SQL Server 2017: How to Get a Parallel Plan - April 28, 2018
- SQL Server 2017: Statistics to Compile a Query Plan - April 28, 2018