This article gives an overview of the Max Worker Threads for the SQL Server Always On Availability Group databases.
SQL Server Always On Availability Group is a widely accepted feature to implement high availability and disaster recovery solution (HADR). It is available from SQL Server 2012 onwards.
Please make sure you have good knowledge of SQL Server Always On and its implementations before you read this article. You can go through High availability articles at SQLShack.
Suppose you have configured SQL Server Always On Availability Group for your critical databases. You have a few databases configured in HADR mode. Now, your application team wants to create lots of databases in this AG instance and configure for the Always On. It raises a question.
- What is the maximum number of availability groups?
- How many databases can we add per the availability group?
As per Microsoft documentation, there is no enforced limit, and it depends!

One obvious question can come in your mind – If Microsoft does not put any hard limit, we can add as many databases and availability groups we required to do. It does not get any negative impact on server performance, CPU, Memory, workload etc.
We need to consider the system resources and performance to add new AG databases. Apart from this, we also need to consider the requirement and usage of the worker threads.
Let’s take this conversation ahead and relate it with the following error message. In this screenshot, SQL Server notified that SQL Server Always On Availability Group could not start a new worker thread because we have exhausted the max number of worker threads. You get a timeout error message once the worker thread is exhausted.

Once we start an instance of SQL Server, it creates the worker threads according to the server logical processors. The default value is zero that shows that it is allowed to use maximum worker threads.
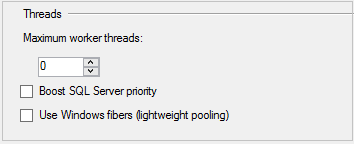
We can also check the configured value using the sp_configure system stored procedure.
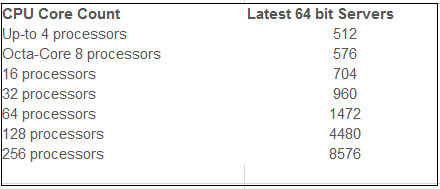
In the following table, we can see the number of worker threads according to the CPU core count.
You can use the following formula to calculate the maximum number of threads.
-
If CPU count is greater than 4 and less than 64, use the following formula
MAX Worker threads = 512 + ((logical CPUS’s – 4) * 16
-
If CPU count is greater than 64, use the following formula
MAX Worker threads = 512 + ((logical CPUS’s – 4) * 32
- Note: We cannot install SQL Server 2016 or later on 32-bit servers. Therefore, you should consider 64-bit systems only.
Worker threads and SQL Server Always On Availability Groups
A SQL Server Always On availability group requires the following worker threads at a high level.
- SQL Server can use the Max Worker threads – 40 worker threads in Always on Availability Groups
- Availability Group does not use a single worker thread for an idle SQL instance
-
Primary replica requires
- One worker thread for the Log capture process
- One Worker threads for each secondary database for the log send
-
Secondary replica requires
- One worker thread for each secondary database for the redo
The secondary replica also requires a worker thread for the backups on the primary replica.
If any thread is inactive for around 15 seconds, SQL Server releases that worker thread to reuse it.
The minimum number of worker threads in SQL Server Always On Availability Group depends on the following parameters.
- Number of the availability groups
- Number of databases in each availability groups
- The number of secondary replicas
We can use the following formula to calculate minimum thread requirements in Always On.
Min Worker thread AG = D * (LCWT + (LSWT * SRC) +MHWT
Let’s say we have the following set for Always On Availability Group.
- One Primary Replica
- Two Secondary Replica ( DC and DR replica)
- One Availability Group
- Ten Databases
Let’s use the formula mentioned above to calculate the minimum number of worker threads in AG.
Min Worker thread AG = (D * (LCWT + (LSWT * SRC))) +MHWT
Min Worker thread AG = (10 * (1 + (1*2))) + 1
Min Worker thread AG = 31
Let’s increase the database count to 200 and see the number of threads for AG.
Min Worker thread AG = (200 * (1 + (1*2))) + 1
Min Worker thread AG = 601
Let’s again increase the database count to 500 and see the number of threads for AG.
Min Worker thread AG = (500 * (1 + (1*2))) + 1
Min Worker thread AG = 1501
You can see here the minimum requirement for the worker threads is 1501. SQL Server will require additional worker threads depending upon the database workload as well. In this case, if you have a SQL Server with 16 cores or even 32, you will have a shortage of worker threads. You might not face this issue if most of the databases are idle, but you need to consider this point while adding databases in the AG group.
Monitor Worker thread in SQL Server Always On Availability Group
In SQL Server, under the extended event session, we can system_health extended event session.

It is a default extended event and automatically gets a restart on each instance with the start of SQL Services.
You can find below important events captured in this extended event.
- Deadlock details
- The output of system diagnostic and health event data using the sp_server_diagnostics
- It gives the information about sessions holding locks for more than 30 seconds
- We can check the information about the worker threads, their utilization
- Ring buffer events capture information about the memory broker, connectivity and scheduler
- A critical error having severity greater than or equals to 20
We can use both the GUI and t-SQL method to monitor the worker thread in SQL Server Always On.
GUI Method to check Worker threads in SQL Server Always On Availability Group
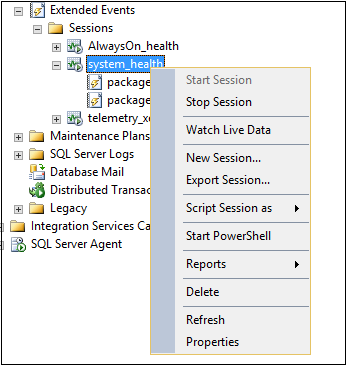
- We can view the live data for the extended event session. Right-click on system_health extended event and Watch Live Data
-
By default, SQL Server stores the information about this extended event session in an event file. This event file is located in the log folder of the SQL instance
You might have noticed these files for your instance.

Double click on the package0_eventfile
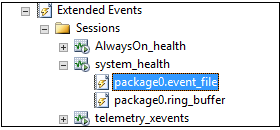
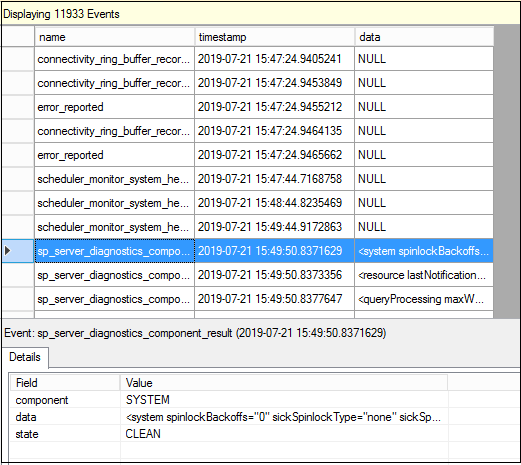
It launches another window to display the event session details
Right-click on the extended event session and filter the results for the following conditions.
- The component should be equal to QUERY_PROCESSING
- The name should be equal to sp_server_diagnostics
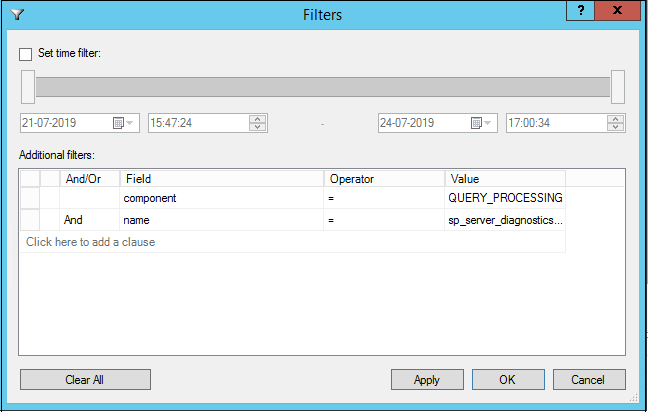
It displays the filtered extended event with information about the worker threads. We will cover the information about the data in detail in the later part of the article.
Using Query to fetch data for the SQL Server Always On Availability Group worker threads
We can use t-SQL code to fetch details for the worker threads. We can use the following methods to retrieve the information using the dynamic management views or system_health extended event session.
Using the sys.dm_os_schedulers dynamic management view
We can use the sys.dm_os_schedulers dynamic management view to check the current value for the maximum worker threads.
|
1 2 3 4 5 6 7 8 9 10 11 12 |
DECLARE @max INT; SELECT @max = max_workers_count FROM sys.dm_os_sys_info; SELECT GETDATE() AS 'CurrentDate', @max AS 'TotalThreads', SUM(active_Workers_count) AS 'CurrentThreads', @max - SUM(active_Workers_count) AS 'AvailableThreads', SUM(runnable_tasks_count) AS 'WorkersWaitingForCpu', SUM(work_queue_count) AS 'RequestWaitingForThreads', SUM(current_workers_count) AS 'AssociatedWorkers' FROM sys.dm_os_Schedulers WHERE STATUS = 'VISIBLE ONLINE'; |
You can create a SQL Agent job and collect the data in a table regularly to track the worker threads.
Fetch information using the system_health extended event
In the GUI method, we can view the data; however, it is not possible to get this data in an excel sheet. To do the investigation or get the trend of worker threads utilization, we want to extract this data in an excel sheet. Let’s look at the way to get this data from the system_health extended event using t-SQL.
Step 1: Create an intermittent table to fetch all records from the system_health event session
In this step, we want to pull all event session information into a dataimport table. We need to specify the location of the log folder containing these files.
|
1 2 3 4 5 |
SELECT [object_name], CAST(event_data AS XML) AS c1 INTO dataimport FROM sys.fn_xe_file_target_read_file('C:\MSSQL13.MSSQLSERVER\MSSQL\Log\system_health*.xel', NULL, NULL, NULL); GO |
Step 2: Create another table to filter the records for the sp_server_diagnostics output
In this step, we will filter the data from table 1 for the sp_server_diagnostics result and insert filtered data into another table ServerDiagnosticsdata.
|
1 2 3 4 5 |
SELECT c1.value('(event/data[@name="component"]/text)[1]', 'varchar(100)') AS SdComponent, c1 INTO ServerDiagnosticsdata FROM dataimport WHERE object_name = 'sp_server_diagnostics_component_result'; |
Step 3: Filter the records for the QUERY_PROCESSING object
In SQL Server, extended event session capture worker thread information in an XML format. In this step, we create a table to hold the XML data and insert the data into it for the QUERY_PROCESSING object.
|
1 2 3 4 5 6 7 8 9 |
CREATE TABLE [dbo].[QryProcessingOutput] ([c1] [XML] NULL ) ON [PRIMARY] TEXTIMAGE_ON [PRIMARY]; GO INSERT INTO QryProcessingOutput(c1) SELECT c1 AS snodes FROM ServerDiagnosticsdata WHERE SdComponent = 'QUERY_PROCESSING'; |
Step 4: Retrieve the information from the ServerDiagnosticsdata table for the max worker threads
We have the data in the ServerDiagnosticsdata table but the data is in the XML format. We cannot directly fetch the required data. We need to fetch a particular event and convert it into an appropriate data type.
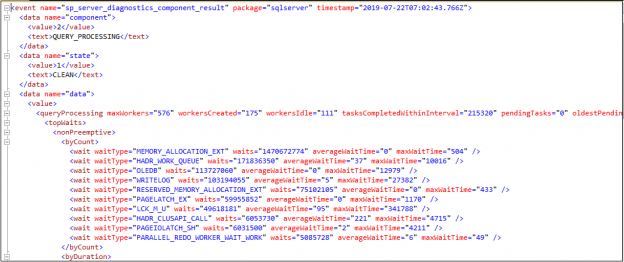
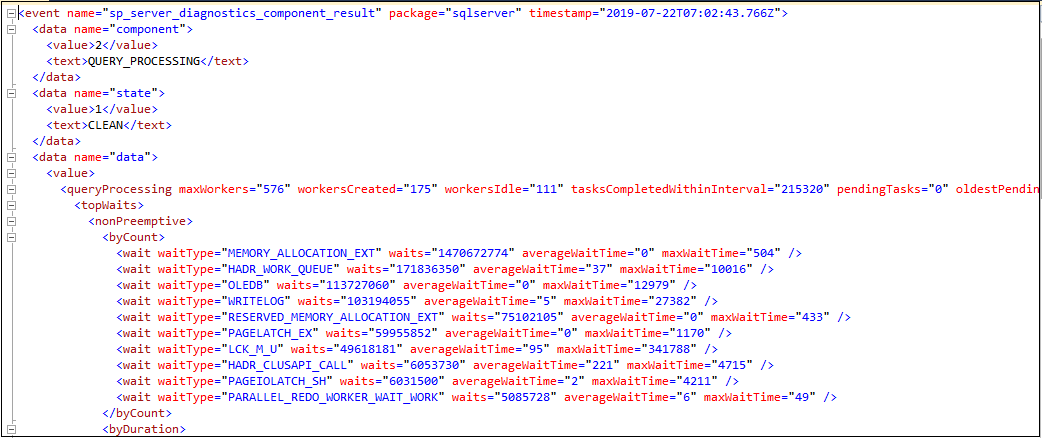
The extended event captures the information in the XML format as shown below.
Execute the following code to get these required columns data and insert it into a WorkerThreadData table.
|
1 2 3 4 5 6 7 8 9 10 11 12 |
SELECT c1.value('(./event/@timestamp)[1]', 'datetime') AS utctimestamp, DATEADD(hh, +5.30, c1.value('(./event/@timestamp)[1]', 'datetime')) AS [timestamp], c1.value('(event/data[@name="component"]/text)[1]', 'varchar(100)') AS [component_name], c1.value('(event/data[@name="state"]/text)[1]', 'varchar(100)') AS [component_state], c1.value('(./event//data[@name="data"]/value/queryProcessing/@maxWorkers)[1]', 'int') AS maxworkers, c1.value('(./event//data[@name="data"]/value/queryProcessing/@workersCreated)[1]', 'int') AS workerscreated, c1.value('(./event//data[@name="data"]/value/queryProcessing/@workersIdle)[1]', 'int') AS workersIdle, c1.value('(./event//data[@name="data"]/value/queryProcessing/@tasksCompletedWithinInterval)[1]', 'int') AS tasksCompletedWithinInterval, c1.value('(./event//data[@name="data"]/value/queryProcessing/@oldestPendingTaskWaitingTime)[1]', 'bigint') AS oldestPendingTaskWaitingTime, c1.value('(./event//data[@name="data"]/value/queryProcessing/@pendingTasks)[1]', 'int') AS pendingTasks INTO [WorkerThreadData] FROM ServerDiagnosticsdata; |
Step 5: Retrieve the information from the ServerDiagnosticsdata table for the SQL Server Always On Availability Group max worker threads
|
1 2 3 4 5 6 7 8 9 10 11 12 |
SELECT [utctimestamp] ,[timestamp] ,[component_name] ,[component_state] ,[maxworkers] ,[workerscreated] ,[workersIdle] ,[tasksCompletedWithinInterval] ,[oldestPendingTaskWaitingTime] ,[pendingTasks] FROM [WorkerThreadData] order by [timestamp] desc |
We get the data as shown in the following image.
Details of the output columns returned from the extended event session
- Component_State: It gives you information that the worker thread is right, or it is about to utilized thoroughly
In the following screenshot, we can see that component state is Warning because we have more worker threads created than the max number of threads and the idle thread count is also very low.
- MaxWorkers: Max worker threads value depends upon the number of processors as defined in the beginning ting of the article. In my example, I have eight processors; therefore, it gives maximum worker threads 576
- Workercreated: this number shows the worker thread created by the application
- oldestPendingTaskWaitingTime: if there is any pending task and it is holding the worker threads, it shows the oldest pending task counts. Ideally, its value should be zero
- Pending Tasks: It also shows the pending tasks counts, its value also should be zero for a healthy environment
Conclusion
In this article, we understood the concept of max worker threads and its relation with the databases, secondary replica instances in the SQL Server Always On availability group. You should monitor the worker thread utilization proactively and investigate it to avoid any connectivity issues due to that.
- Understanding PostgreSQL SUBSTRING function - September 21, 2024
- How to install PostgreSQL on Ubuntu - July 13, 2023
- How to use the CROSSTAB function in PostgreSQL - February 17, 2023

