
With all of the high-availability (HA) and disaster recovery (DR) features, the database administrator must understand how much data loss and downtime is possible under the worst case scenarios. Data loss affects your ability to meet recovery point objectives (RPO) and downtime affects your recovery time objectives (RTO). When using Availability Groups (AGs), your RTO and RPO rely upon the replication of transaction log records between at least two replicas to be extremely fast. The worse the performance, the more potential data loss will occur and the longer it can take for a failed over database to come back online.
Availability Groups must retain all transaction log records until they have been distributed to all secondary replicas. Slow synchronization to even a single replica will prevent log truncation. If the log records cannot be truncated your log will likely begin to grow. This becomes a maintenance concern because you either need to continue to expand your disk or you might run out of capacity entirely.
Availability modes
There are two availability modes, synchronous commit and asynchronous commit. Selecting a mode is equivalent to selecting whether you want to favor data protection or transaction performance. Both availability modes follow the same work flow, with one small yet critical difference.
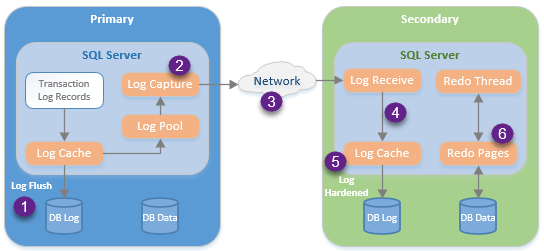
With synchronous commit mode, the application does not receive confirmation that the transaction committed until after the log records are hardened (step 5) on all synchronous secondary replicas. This is how AGs can guarantee zero data loss. Any transactions which were not hardened before the primary failed would be rolled back and an appropriate error would be bubbled up to the application for it to alert the user or perform its own error handling.
With asynchronous commit mode, the application receives confirmation that the transaction committed after the last log record is flushed (step 1) to the primary replica’s log file. This improves performance because the application does not have to wait for the log records to be transmitted but it opens up the AG to the potential of data loss. If the primary replica fails before the secondary replicas harden the log records, then the application will believe a transaction was committed but a failover would result in the loss of that data.
Measuring potential data loss
Thomas Grohser once told me, “do not confuse luck with high-availability.” A server may stay online without ever failing or turning off for many years but if that server has no redundancy features then it is not highly-available. That same server staying up for the entire year does not mean that you can meet five nines as a service level agreement (SLA).
Policy based management is one method of verifying that you can achieve your RTOs and RPOs. I will be covering the dynamic management view (DMV) method because I find it is more versatile and very useful when creating custom alerts in various monitoring tools. If you would like to read more on the policy based management method, review this BOL post.
Calculations
There are two methods of calculating data loss. Each method has its own quirks which are important to understand and put into context.
Log send queue
Tdata_loss = log_send_queue / log_generation_rate
Your first thought might be to look at the send rate rather than the generation rate but it is important to remember that we are not looking for how long it will take to synchronize, we are looking for what window of time will we lose data in. Also, it is measuring data loss by time rather than quantity.
This calculation can be a bit misleading if your write load is inconsistent. I once administered a system which used filestream. The database would have a very low write load until a 4 MB file was dropped in it. The instant after the transaction was committed the log send queue would be very large while the log generation rate was still showing very low. This made my alerts trigger even though the 4 MB of data was synchronized extremely fast and the next poll would show that we were within our RPO SLAs.
If you chose this calculation you will need to trigger alerts after your RPO SLAs have been violated for a period of time, such as after 5 polls at 1 minute intervals. This will help cut down on false positives.
Last commit time
Tdata_loss = last_commit_timeprimary – last_commit_timesecondary
The last commit time method is easier to understand. The last commit time on your secondary replica will always be equal to or less than the primary replica. Finding the difference between these values will tell you how far behind your replica lags.
Similar to the log send queue method, the last commit time can be misleading on systems with an inconsistent work load. If a transaction occurs at 02:00am and then the write load on the database goes idle for one hour, this calculation will be misleading until the next transaction is synchronized. The metric would declare a one-hour lag even though there was no data to be lost during that hour.
While misleading, the hour lag is technically accurate. RPO measures the time period where data may be lost. It does not measure the quantity of data which would be lost during that time frame. The fact that there was zero data to be lost does not alter the fact that you would lose the last hours’ worth of data. It being accurate still skews the picture, though, because if there was data flowing you would not have had a one hour lag indicated.
RPO metric queries
Log send queue method
|
1 2 3 4 5 6 7 8 9 10 11 12 13 14 15 16 17 18 19 20 21 22 23 24 25 26 27 28 29 30 31 32 33 34 35 36 37 38 39 40 41 42 43 44 45 46 47 48 49 50 51 52 |
;WITH UpTime AS ( SELECT DATEDIFF(SECOND,create_date,GETDATE()) [upTime_secs] FROM sys.databases WHERE name = 'tempdb' ), AG_Stats AS ( SELECT AR.replica_server_name, HARS.role_desc, Db_name(DRS.database_id) [DBName], CAST(DRS.log_send_queue_size AS DECIMAL(19,2)) log_send_queue_size_KB, (CAST(perf.cntr_value AS DECIMAL(19,2)) / CAST(UpTime.upTime_secs AS DECIMAL(19,2))) / CAST(1024 AS DECIMAL(19,2)) [log_KB_flushed_per_sec] FROM sys.dm_hadr_database_replica_states DRS INNER JOIN sys.availability_replicas AR ON DRS.replica_id = AR.replica_id INNER JOIN sys.dm_hadr_availability_replica_states HARS ON AR.group_id = HARS.group_id AND AR.replica_id = HARS.replica_id --I am calculating this as an average over the entire time that the instance has been online. --To capture a smaller, more recent window, you will need to: --1. Store the counter value. --2. Wait N seconds. --3. Recheck counter value. --4. Divide the difference between the two checks by N. INNER JOIN sys.dm_os_performance_counters perf ON perf.instance_name = Db_name(DRS.database_id) AND perf.counter_name like 'Log Bytes Flushed/sec%' CROSS APPLY UpTime ), Pri_CommitTime AS ( SELECT replica_server_name , DBName , [log_KB_flushed_per_sec] FROM AG_Stats WHERE role_desc = 'PRIMARY' ), Sec_CommitTime AS ( SELECT replica_server_name , DBName --Send queue will be NULL if secondary is not online and synchronizing , log_send_queue_size_KB FROM AG_Stats WHERE role_desc = 'SECONDARY' ) SELECT p.replica_server_name [primary_replica] , p.[DBName] AS [DatabaseName] , s.replica_server_name [secondary_replica] , CAST(s.log_send_queue_size_KB / p.[log_KB_flushed_per_sec] AS BIGINT) [Sync_Lag_Secs] FROM Pri_CommitTime p LEFT JOIN Sec_CommitTime s ON [s].[DBName] = [p].[DBName] |

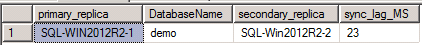
Last commit time method
NOTE: This query is a bit simpler and does not have to calculate cumulative performance monitor counters.
|
1 2 3 4 5 6 7 8 9 10 11 12 13 14 15 16 17 18 19 20 21 22 23 24 25 26 27 28 29 30 31 32 33 34 35 36 37 |
;WITH AG_Stats AS ( SELECT AR.replica_server_name, HARS.role_desc, Db_name(DRS.database_id) [DBName], DRS.last_commit_time FROM sys.dm_hadr_database_replica_states DRS INNER JOIN sys.availability_replicas AR ON DRS.replica_id = AR.replica_id INNER JOIN sys.dm_hadr_availability_replica_states HARS ON AR.group_id = HARS.group_id AND AR.replica_id = HARS.replica_id ), Pri_CommitTime AS ( SELECT replica_server_name , DBName , last_commit_time FROM AG_Stats WHERE role_desc = 'PRIMARY' ), Sec_CommitTime AS ( SELECT replica_server_name , DBName , last_commit_time FROM AG_Stats WHERE role_desc = 'SECONDARY' ) SELECT p.replica_server_name [primary_replica] , p.[DBName] AS [DatabaseName] , s.replica_server_name [secondary_replica] , DATEDIFF(ss,s.last_commit_time,p.last_commit_time) AS [Sync_Lag_Secs] FROM Pri_CommitTime p LEFT JOIN Sec_CommitTime s ON [s].[DBName] = [p].[DBName] |

Recovery time objective
Your recovery time objective involves more than just the performance of the AG synchronization.
Calculation
Tfailover = Tdetection + Toverhead + Tredo
Detection
From the instant that an internal error or timeout occurs to the moment that the AG begins to failover is the detection window. The cluster will check the health of the AG by calling the sp_server_diagnostics stored procedure. If there is an internal error, the cluster will initiate a failover after receiving the results. This stored procedure is called at an interval that is 1/3rd the total health-check timeout threshold. By default, it polls every 10 seconds with a timeout of 30 seconds.
If no error is detected, then a failover may occur if the health-check timeout is reached or the lease between the resource DLL and SQL Server instance has expired (20 seconds by default). For more details on these conditions review this book online post.
Overhead
Overhead is the time it takes for the cluster to failover plus bring the databases online. The failover time is typically constant and can be tested easily. Bringing the databases online is dependent upon crash recovery. This is typically very fast but a failover in the middle of a very large transaction can cause delays as crash recovery works to roll back. I recommend testing failovers in a non-production environment during operations such as large index rebuilds.
Redo
When data pages are hardened on the secondary replica SQL Server must redo the transactions to roll everything forward. This is an area that we need to monitor, particularly if the secondary replica is underpowered when compared to the primary replica. Dividing the redo_queue by the redo_rate will indicate your lag.
Tredo = redo_queue / redo_rate
RTO metric query
|
1 2 3 4 5 6 7 8 9 10 11 12 13 14 15 16 17 18 19 20 21 22 23 24 25 26 27 28 29 30 31 32 33 34 35 36 37 38 39 40 |
;WITH AG_Stats AS ( SELECT AR.replica_server_name, HARS.role_desc, Db_name(DRS.database_id) [DBName], DRS.redo_queue_size redo_queue_size_KB, DRS.redo_rate redo_rate_KB_Sec FROM sys.dm_hadr_database_replica_states DRS INNER JOIN sys.availability_replicas AR ON DRS.replica_id = AR.replica_id INNER JOIN sys.dm_hadr_availability_replica_states HARS ON AR.group_id = HARS.group_id AND AR.replica_id = HARS.replica_id ), Pri_CommitTime AS ( SELECT replica_server_name , DBName , redo_queue_size_KB , redo_rate_KB_Sec FROM AG_Stats WHERE role_desc = 'PRIMARY' ), Sec_CommitTime AS ( SELECT replica_server_name , DBName --Send queue and rate will be NULL if secondary is not online and synchronizing , redo_queue_size_KB , redo_rate_KB_Sec FROM AG_Stats WHERE role_desc = 'SECONDARY' ) SELECT p.replica_server_name [primary_replica] , p.[DBName] AS [DatabaseName] , s.replica_server_name [secondary_replica] , CAST(s.redo_queue_size_KB / s.redo_rate_KB_Sec AS BIGINT) [Redo_Lag_Secs] FROM Pri_CommitTime p LEFT JOIN Sec_CommitTime s ON [s].[DBName] = [p].[DBName] |

Synchronous performance
Everything discussed thus far has revolved around recovery in asynchronous commit mode. The final aspect of synchronization lag that will be covered is the performance impact of using synchronous commit mode. As mentioned above, synchronous commit mode guarantees zero data loss but you pay a performance price for that.
The impact to your transactions due to synchronization can be measured with performance monitor counters or wait types.
Calculations
Performance monitor counters
Tcost = Ttransaction delay /Tmirrored_write_transactions
Simple division of the sec and transaction delay counters / mirrored write transactions will provide you with your cost of enabling synchronous commit in units of time. I prefer this method over the wait types method that I will demonstrate next because it can be measured at the database level and calculate implicit transactions.I prefer this method over the wait types method that I will demonstrate next because it can be measured at the database level and calculate implicit transactions. What I mean by that is, if I run a single INSERT statement with one million rows, it will calculate the delay induced on each of the rows. The wait types method would see the single insert as one action and provide you with the delay caused to all million rows. This difference is moot for the majority of OLTP systems because they typically have larger quantities of smaller transactions.
Wait type – HADR_SYNC_COMMIT
Tcost = Twait_time / Twaiting_tasks_count
The wait type counter is cumulative which means that you will need to extract snapshots in time and find their differences or perform the calculation based on all activity since the SQL Server instance was last restarted.
Synchronization metric queries
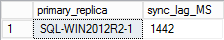
Performance monitor counters method
NOTE: This script is much longer than the previous ones. That was because I chose to demonstrate how you would sample the performance counters and calculate off of a recent period of time. This metric could be accomplished with the up-time calculation demonstrated above as well.
|
1 2 3 4 5 6 7 8 9 10 11 12 13 14 15 16 17 18 19 20 21 22 23 24 25 26 27 28 29 30 31 32 33 34 35 36 37 38 39 40 41 42 43 44 45 46 47 48 49 50 51 52 53 54 55 56 57 58 59 60 61 62 63 64 65 66 67 68 69 70 71 72 73 74 75 76 77 78 79 80 81 82 83 84 85 86 87 88 89 90 91 92 93 94 95 96 97 98 99 100 101 102 103 104 105 106 107 108 109 110 111 112 113 114 115 116 117 118 119 |
--Check metrics first IF OBJECT_ID('tempdb..#perf') IS NOT NULL DROP TABLE #perf SELECT IDENTITY (int, 1,1) id ,instance_name ,CAST(cntr_value * 1000 AS DECIMAL(19,2)) [mirrorWriteTrnsMS] ,CAST(NULL AS DECIMAL(19,2)) [trnDelayMS] INTO #perf FROM sys.dm_os_performance_counters perf WHERE perf.counter_name LIKE 'Mirrored Write Transactions/sec%' AND object_name LIKE 'SQLServer:Database Replica%' UPDATE p SET p.[trnDelayMS] = perf.cntr_value FROM #perf p INNER JOIN sys.dm_os_performance_counters perf ON p.instance_name = perf.instance_name WHERE perf.counter_name LIKE 'Transaction Delay%' AND object_name LIKE 'SQLServer:Database Replica%' AND trnDelayMS IS NULL -- Wait for recheck -- I found that these performance counters do not update frequently, -- thus the long delay between checks. WAITFOR DELAY '00:05:00' GO --Check metrics again INSERT INTO #perf ( instance_name ,mirrorWriteTrnsMS ,trnDelayMS ) SELECT instance_name ,CAST(cntr_value * 1000 AS DECIMAL(19,2)) [mirrorWriteTrnsMS] ,NULL FROM sys.dm_os_performance_counters perf WHERE perf.counter_name LIKE 'Mirrored Write Transactions/sec%' AND object_name LIKE 'SQLServer:Database Replica%' UPDATE p SET p.[trnDelayMS] = perf.cntr_value FROM #perf p INNER JOIN sys.dm_os_performance_counters perf ON p.instance_name = perf.instance_name WHERE perf.counter_name LIKE 'Transaction Delay%' AND object_name LIKE 'SQLServer:Database Replica%' AND trnDelayMS IS NULL --Aggregate and present ;WITH AG_Stats AS ( SELECT AR.replica_server_name, HARS.role_desc, Db_name(DRS.database_id) [DBName] FROM sys.dm_hadr_database_replica_states DRS INNER JOIN sys.availability_replicas AR ON DRS.replica_id = AR.replica_id INNER JOIN sys.dm_hadr_availability_replica_states HARS ON AR.group_id = HARS.group_id AND AR.replica_id = HARS.replica_id ), Check1 AS ( SELECT DISTINCT p1.instance_name ,p1.mirrorWriteTrnsMS ,p1.trnDelayMS FROM #perf p1 INNER JOIN ( SELECT instance_name, MIN(id) minId FROM #perf p2 GROUP BY instance_name ) p2 ON p1.instance_name = p2.instance_name ), Check2 AS ( SELECT DISTINCT p1.instance_name ,p1.mirrorWriteTrnsMS ,p1.trnDelayMS FROM #perf p1 INNER JOIN ( SELECT instance_name, MAX(id) minId FROM #perf p2 GROUP BY instance_name ) p2 ON p1.instance_name = p2.instance_name ), AggregatedChecks AS ( SELECT DISTINCT c1.instance_name , c2.mirrorWriteTrnsMS - c1.mirrorWriteTrnsMS mirrorWriteTrnsMS , c2.trnDelayMS - c1.trnDelayMS trnDelayMS FROM Check1 c1 INNER JOIN Check2 c2 ON c1.instance_name = c2.instance_name ), Pri_CommitTime AS ( SELECT replica_server_name , DBName FROM AG_Stats WHERE role_desc = 'PRIMARY' ), Sec_CommitTime AS ( SELECT replica_server_name , DBName FROM AG_Stats WHERE role_desc = 'SECONDARY' ) SELECT p.replica_server_name [primary_replica] , p.[DBName] AS [DatabaseName] , s.replica_server_name [secondary_replica] , CAST(CASE WHEN ac.trnDelayMS = 0 THEN 1 ELSE ac.trnDelayMS END AS DECIMAL(19,2) / ac.mirrorWriteTrnsMS) sync_lag_MS FROM Pri_CommitTime p LEFT JOIN Sec_CommitTime s ON [s].[DBName] = [p].[DBName] LEFT JOIN AggregatedChecks ac ON ac.instance_name = p.DBName |
Wait types method
NOTE: For brevity I did not use the above two-check method to find the recent wait types but the method can be implemeneted, if you chose to use this method.
|
1 2 3 4 5 6 7 8 9 10 11 12 13 14 15 16 17 18 19 20 21 22 23 24 25 26 27 28 29 30 31 32 33 34 35 36 37 38 39 |
;WITH AG_Stats AS ( SELECT AR.replica_server_name, HARS.role_desc, Db_name(DRS.database_id) [DBName] FROM sys.dm_hadr_database_replica_states DRS INNER JOIN sys.availability_replicas AR ON DRS.replica_id = AR.replica_id INNER JOIN sys.dm_hadr_availability_replica_states HARS ON AR.group_id = HARS.group_id AND AR.replica_id = HARS.replica_id ), Waits AS ( select wait_type , waiting_tasks_count , wait_time_ms , wait_time_ms/waiting_tasks_count sync_lag_MS from sys.dm_os_wait_stats where waiting_tasks_count >0 and wait_type = 'HADR_SYNC_COMMIT' ), Pri_CommitTime AS ( SELECT replica_server_name , DBName FROM AG_Stats WHERE role_desc = 'PRIMARY' ), Sec_CommitTime AS ( SELECT replica_server_name , DBName FROM AG_Stats WHERE role_desc = 'SECONDARY' ) SELECT p.replica_server_name [primary_replica] , w.sync_lag_MS FROM Pri_CommitTime p CROSS APPLY Waits w |
Take-away
At this point, you should be ready to select a measurement method for your asynchronous or synchronous commit AGs and implement baselining and monitoring. I prefer the log send queue method for checking on potential data loss and the performance monitor counter method of measuring the performance impact of your synchronous commit replicas.

Derik thanks our #sqlfamily for plugging the gaps in his knowledge over the years and actively continues the cycle of learning by sharing his knowledge with all and volunteering as a PASS User Group leader.
View all posts by Derik Hammer
- SQL query performance tuning tips for non-production environments - September 12, 2017
- Synchronizing SQL Server Instance Objects in an Availability Group - September 8, 2017
- Measuring Availability Group synchronization lag - August 9, 2016