
Database administrators are used to dealing with query performance issues. As part of this duty, it is an important aspect to identify the query and troubleshoot the reason for its performance degradation. Normally, we used to enable SET STATISTICS IO and SET STATISTICS TIME before executing any query.
- SET STATISTICS IO: When it is set to ‘ON’, this displays disk activity related statistics while running the query.
- SET STATISTICS TIME: It shows the time in milliseconds to parse, compile, and execute the statement.
When we enable these settings at the session level and execute the query, we get cumulative information about all the operators once the query is finished. We can examine the estimated or actual execution plan as well, but we do not get detailed information about the particular operator while the query is actually running. Therefore, in a certain case, it might not be useful to get information about statistics after query finishes. If we can get information at the runtime with a breakdown at each operator level, it can get useful for troubleshooting purpose.
In SQL Server 2014, we gained access to the new dynamic management view sys.dm_exec_query_profiles. This DMV is useful to monitor the real-time statistics of the query while query execution is in progress. We can join this DMV with the other views to get more information around it. We need to enable SET STATISTICS PROFILE ON to start capturing diagnostics information with the sys.dm_exec_query_profiles.
SQL Server Management studio (13.x) 2016 introduced live query statistics functionality in which we can actually see the execution plan of an active query. It actually shows the query progress with real-time statistics of each operator along with the data flow. This is useful for troubleshooting purpose where we can see in real time which operator is taking time to complete the query.
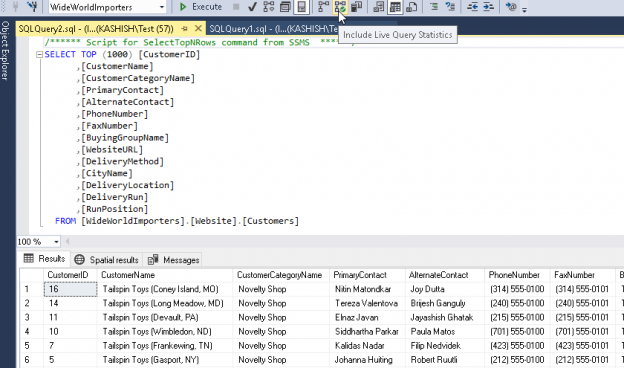
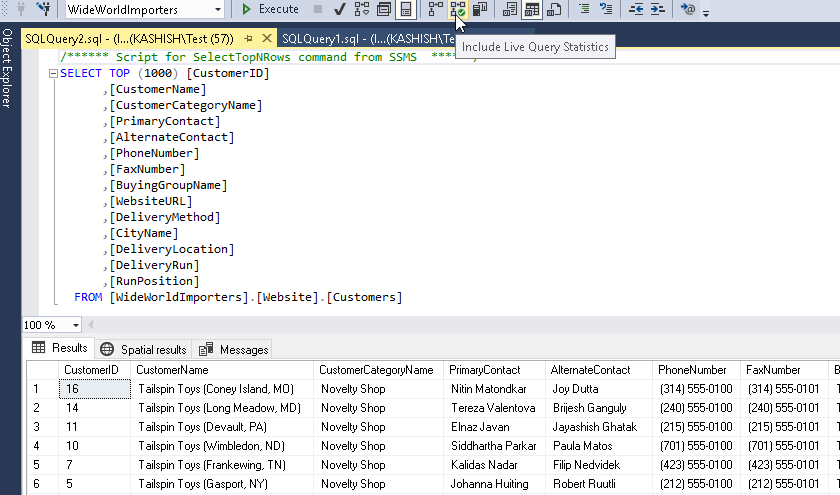
We can enable live query statistics for a particular query similar to an estimated or actual execution plan. Click on the ‘Include Live Query Statistics’
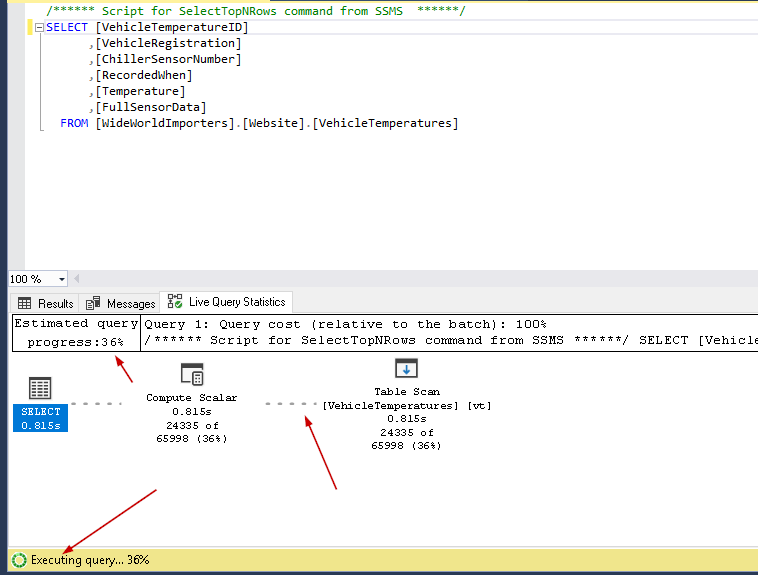
We get the live query statistics while the query is in executing state.
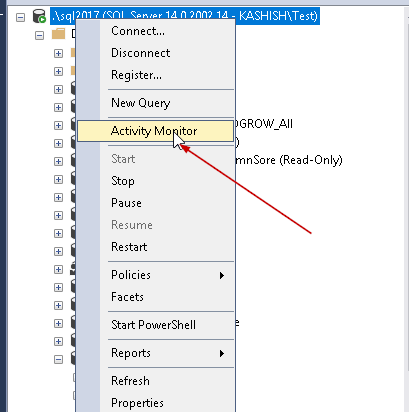
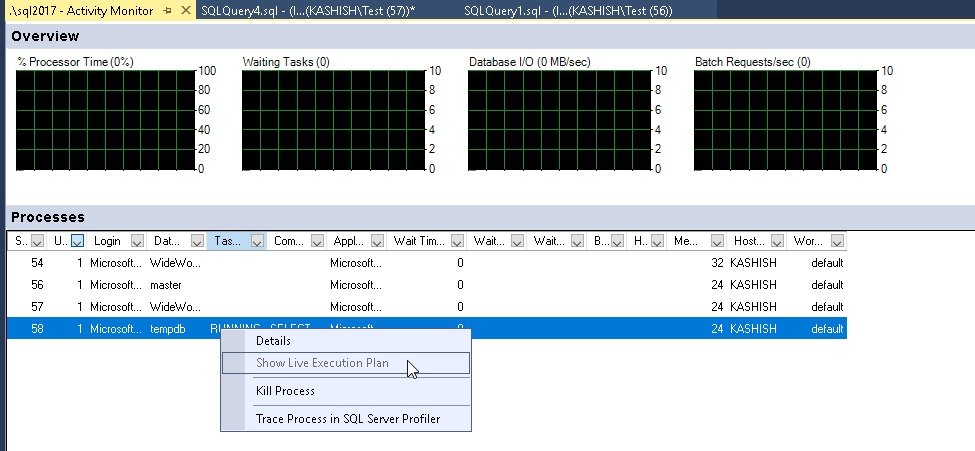
If we launch the ‘Activity Monitor’ in SQL Server Management Studio by right click on the instance name ->
Usually, live query statistics is disabled for all the sessions. Previously, we enable live query statistics for a particular session only.
We can enable the live query statistics by below methods till SQL Server 2016.
- Execute SET STATISTICS XML ON or SET STATISTICS PROFILE ON before running the query in particular session
-
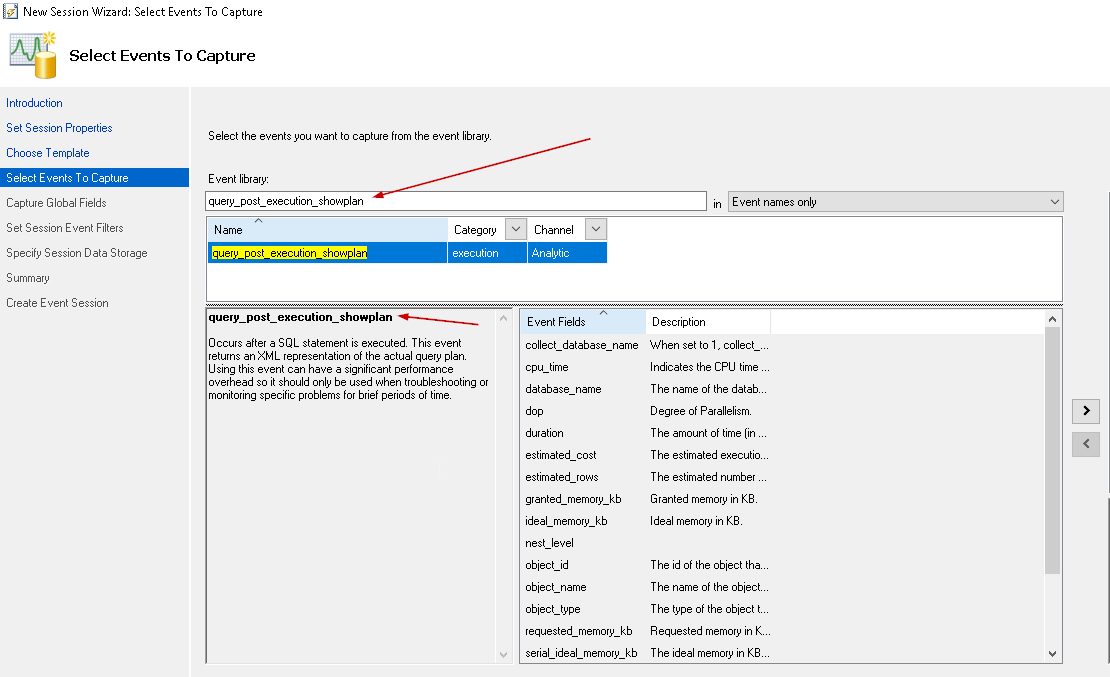
In the extended event, we can enable query_post_execution_showplan to enable live query statistics for all the session on the instance

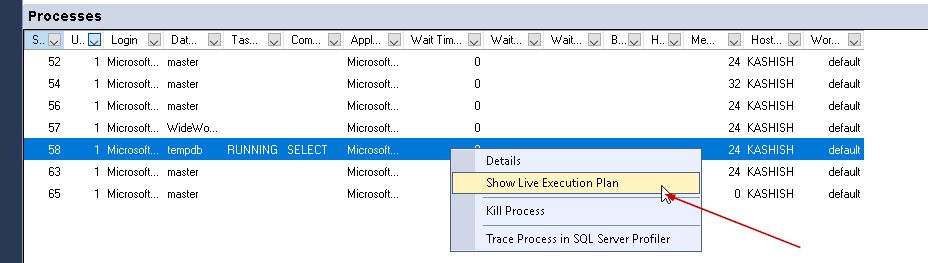
If we enable this extended event, we can see ‘Show Live Execution Plan’ is enabled in the activity monitor as well.
As we know, nothing comes free in this world, the problem with this approach is that if we enable the event live query statistics is captured for each session and this can put an extra burden on the system in terms of CPU, Memory, Disk read and write.
Therefore, in SQL Server 2016, Microsoft introduced the light version of the static profile. We can enable the live lightweight query statistics using below two methods
-
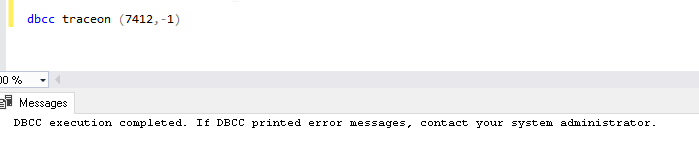
Enable the trace flag 7412 at the global level with the below query
12DBCC TRACEON (7412, -1);GO
-
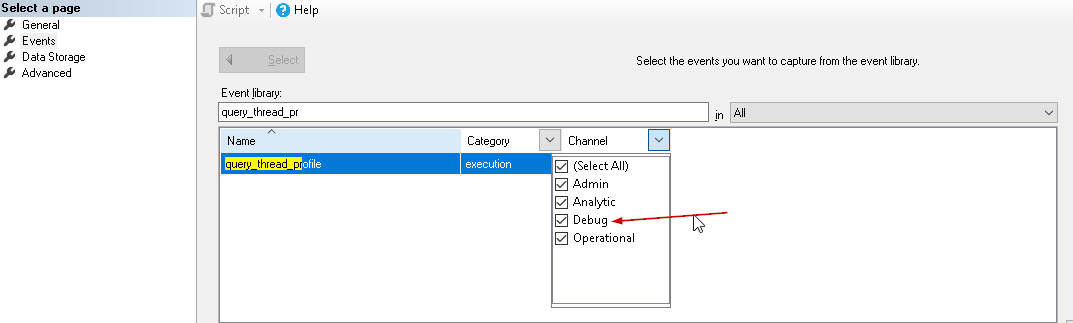
Enable the lightweight extended event query_thread_profile. We can find this extended event under the debug category. This channel category is not enabled by default. Therefore, put a check on ‘Debug’ from the channel
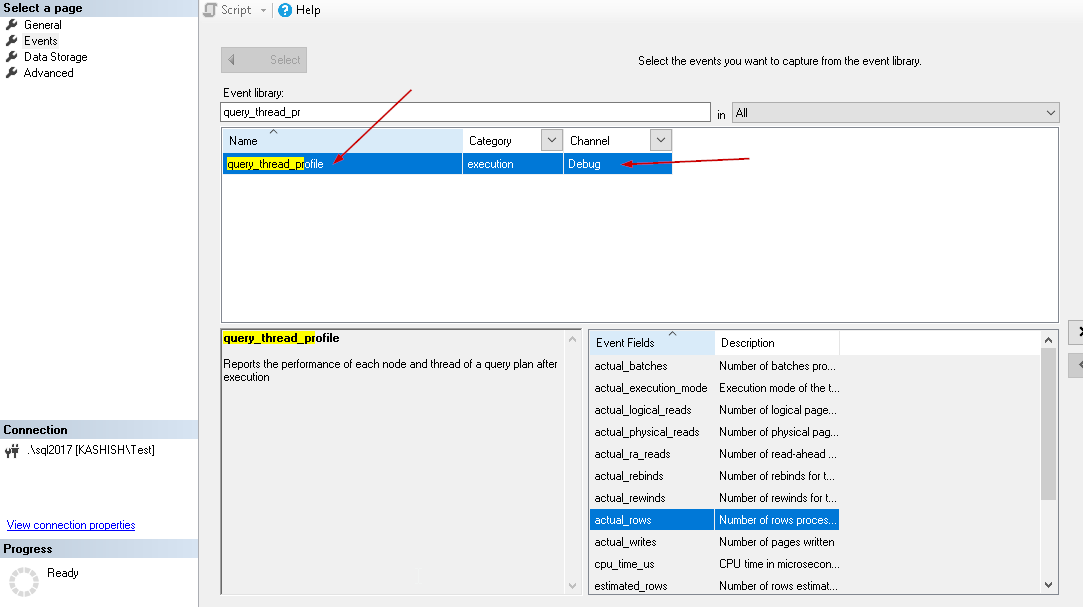
Now, we can see this extended event as shown here.
Therefore, from SQL Server 2016 SP1 we can enable this lightweight profiling and it can capture live query statistics for all the sessions.
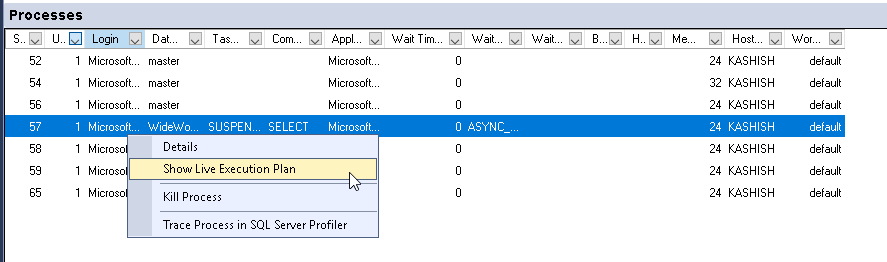
Note: this option will be available only if the query is in executing state.
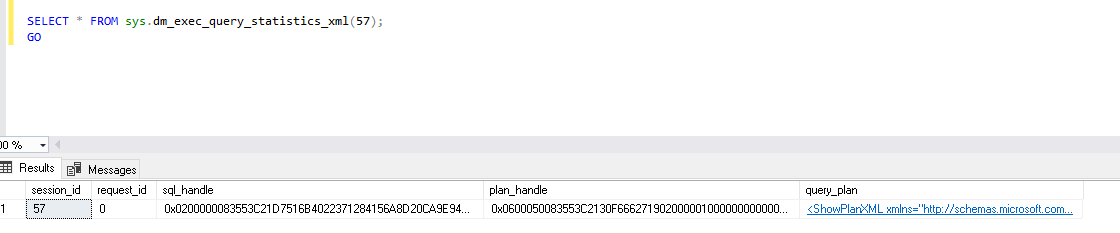
Once we have enabled the trace flag or the extended event profile in SQL Server 2016 a new system view sys.dm_exec_query_statistics_xml is available which can be used to get the show plan statistics in XML format.
We need to pass the session id for which we want to view the query plan.
Syntax for the sys.dm_exec_query_statistics_xml is:
sys.dm_exec_query_statistics_xml(session_id)
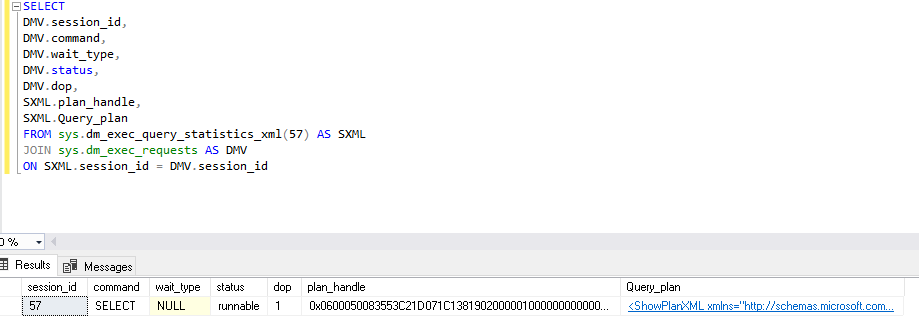
We can combine the system view with other DMV like sys.dm_exec_requests using the below query and get more information from our session, query.
|
1 2 3 4 5 6 7 8 9 10 11 12 13 |
SELECT DMV.session_id, DMV.command, DMV.wait_type, DMV.status, DMV.dop, SXML.plan_handle, SXML.Query_plan FROM sys.dm_exec_query_statistics_xml(57) AS SXML --Pass the session id here. Like I mentioned 57 JOIN sys.dm_exec_requests AS DMV ON SXML.session_id = DMV.session_id |
Lightweight profiling in SQL Server 2019
SQL Server 2019 has introduced many new features and enhancements over existing features. As we have seen above, until SQL Server 2017, we have to enable the trace flag 7412 or extended event session to get used of lightweight profiling.
Now in SQL Server 2019, by default, this lightweight profiling is enabled. That means we do not have to do any extra efforts to view the live query statistics for any diagnostics or troubleshooting purpose.
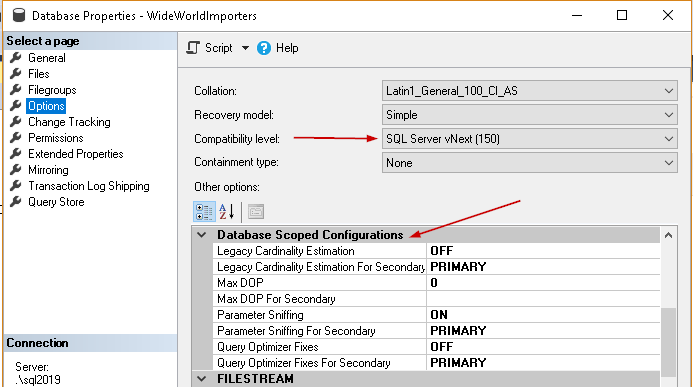
In SQL Server 2019, however, we can control this behavior using the database scoped configuration. If we right click on the database and go to option. Under options, we can see a group ‘Database Scoped Configurations’. Currently, we do not see any database scoped configuration for the lightweight profiling.
Note: As of the date of writing, we have to be in compatibility level as SQL Server vNext (150) that is new compatibility level for SQL Server 2019.
We can turn on or off this behavior by LIGHTWEIGHT_QUERY_PROFILING in database scoped configuration using the query.
For example, if we want to turn it ‘ON’, execute the below query.
|
1 |
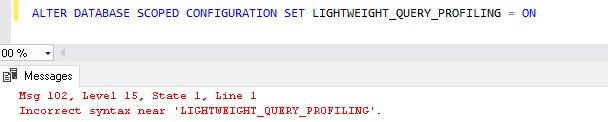
ALTER DATABASE SCOPED CONFIGURATION SET LIGHTWEIGHT_QUERY_PROFILING = ON |
We get the below syntax error message in SQL Server 2019 CTP 2.0 or CTP 2.1 version.
Msg 102, Level 15, State 1, Line 1
Incorrect syntax near ‘LIGHTWEIGHT_QUERY_PROFILING’.
Note: As per SQL Server 2019 CTP 2.1 release notes, ‘Currently, the lightweight query-profiling infrastructure (LWP) cannot be controlled at the individual database level and remains enabled for all databases by default. For more information on LWP’.
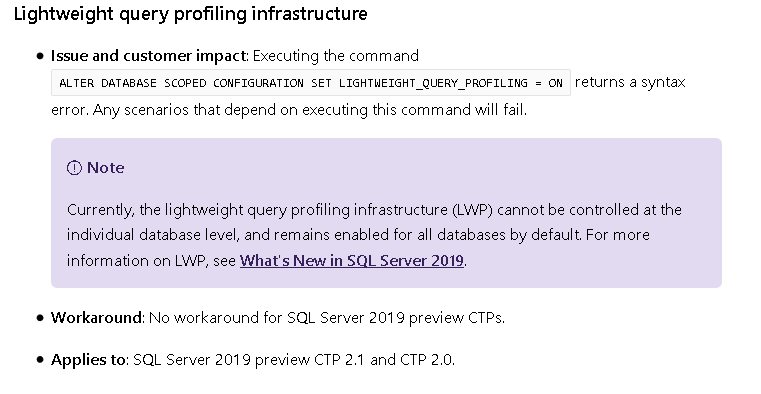
This issue will be fixed in the future release of SQL Server 2019.
Conclusion
We have explored in this article that SQL Server 2019 support lightweight profiling without any extra configuration steps such as enable trace flag or extended event session. This looks like a promising feature and we can control this property using the database scooped configuration which will be available in a future release of SQL Server 2019.

I am the author of the book "DP-300 Administering Relational Database on Microsoft Azure". I published more than 650 technical articles on MSSQLTips, SQLShack, Quest, CodingSight, and SeveralNines.
I am the creator of one of the biggest free online collections of articles on a single topic, with his 50-part series on SQL Server Always On Availability Groups.
Based on my contribution to the SQL Server community, I have been recognized as the prestigious Best Author of the Year continuously in 2019, 2020, and 2021 (2nd Rank) at SQLShack and the MSSQLTIPS champions award in 2020.
Personal Blog: https://www.dbblogger.com
I am always interested in new challenges so if you need consulting help, reach me at rajendra.gupta16@gmail.com
View all posts by Rajendra Gupta
- Understanding PostgreSQL SUBSTRING function - September 21, 2024
- How to install PostgreSQL on Ubuntu - July 13, 2023
- How to use the CROSSTAB function in PostgreSQL - February 17, 2023