
In this article, you will see how to import data from JSON files and Power BI Rest API into the Power BI environment.
Power BI is a Microsoft application for data analytics and visualization. With Power BI, you can create interactive data visualizations without writing a single line of code. To create a visualization in Power BI, you need a data source that can be in the form of a flat-file such as CSV, TSV, or a database like MS SQL Server. Data can also be retrieved from online sources via Power BI Rest API calls.
In the first section of the article, we will analyze data imported via a local JSON file. In the second section, we will import data from a remote location via REST API calls and explore it with the help of Power BI visualizations.
Importing data from JSON files
JSON stands for JavaScript Object Notation and is one of the most commonly used formats for data exchange between different platforms and applications. With Power BI, you can export data from JSON files to create different types of visualization.
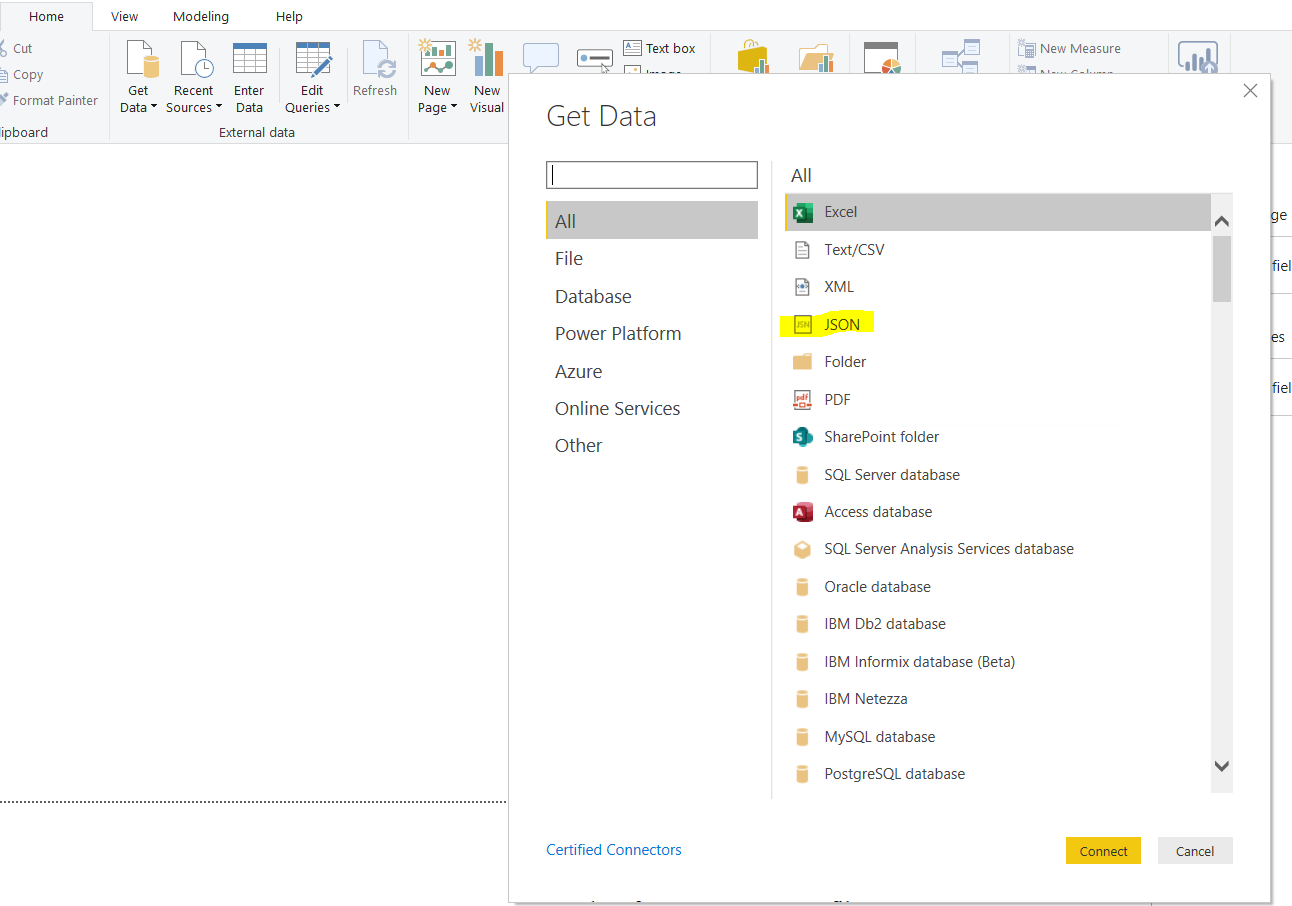
To import JSON files, go to the Power BI dashboard and click the “Get Data” tab from the top menu. From the list of data sources, select “JSON” as shown in the following screenshot.
Locate the JSON file that contains your dataset and import it into the Power BI desktop. The JSON file that we are going to import contains 100 fictional records of different persons. The first five records in our JSON file look like this:
|
1 2 3 4 5 6 7 8 9 10 11 12 13 14 15 16 17 18 19 20 21 22 23 24 25 26 27 28 29 30 31 |
[ { "Person_Id": 1, "Person_Name": "Lyle Puckett", "Person_Age": 37, "Person_Gender": "0" }, { "Person_Id": 2, "Person_Name": "Abdul Reed", "Person_Age": 58, "Person_Gender": "0" }, { "Person_Id": 3, "Person_Name": "Leonard Raymond", "Person_Age": 30, "Person_Gender": "1" }, { "Person_Id": 4, "Person_Name": "Louis Hurley", "Person_Age": 52, "Person_Gender": "1" }, { "Person_Id": 5, "Person_Name": "Ulysses Ward", "Person_Age": 50, "Person_Gender": "0" }, |
You can see that each person has four properties, i.e., “Person_Id”, “Person_Name”, “Person_Age”, and “Person_Gender”. With Power BI, these properties will be converted into columns.
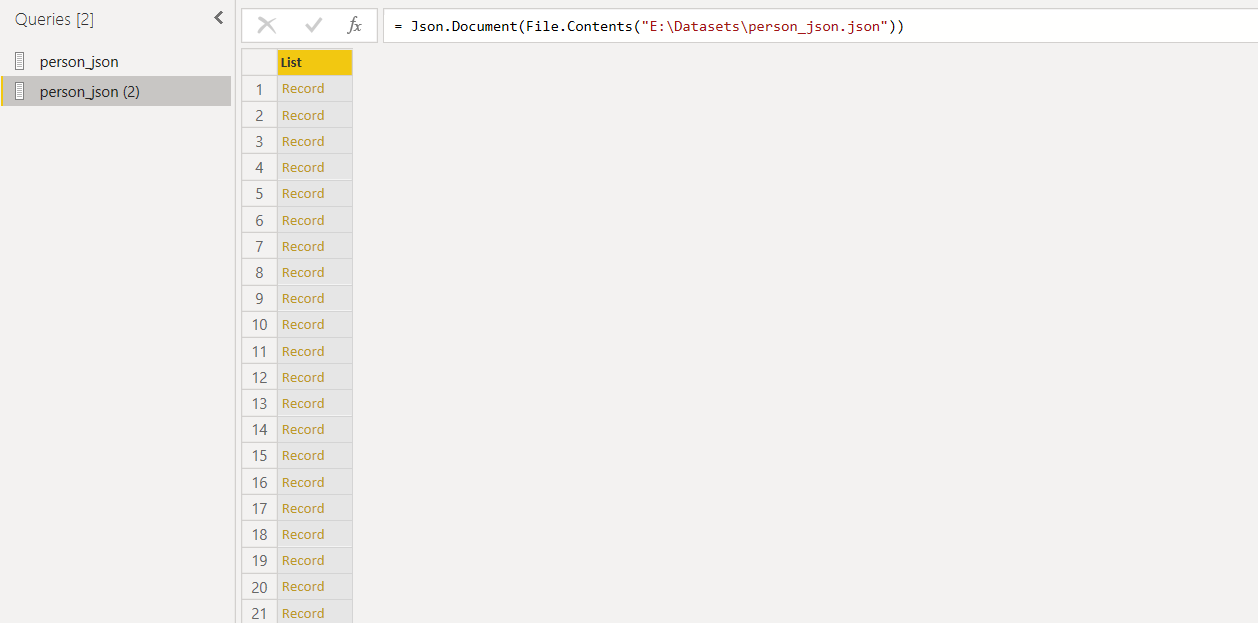
Once the above JSON file is imported, you should see a list with 100 records, as shown in the following screenshot.
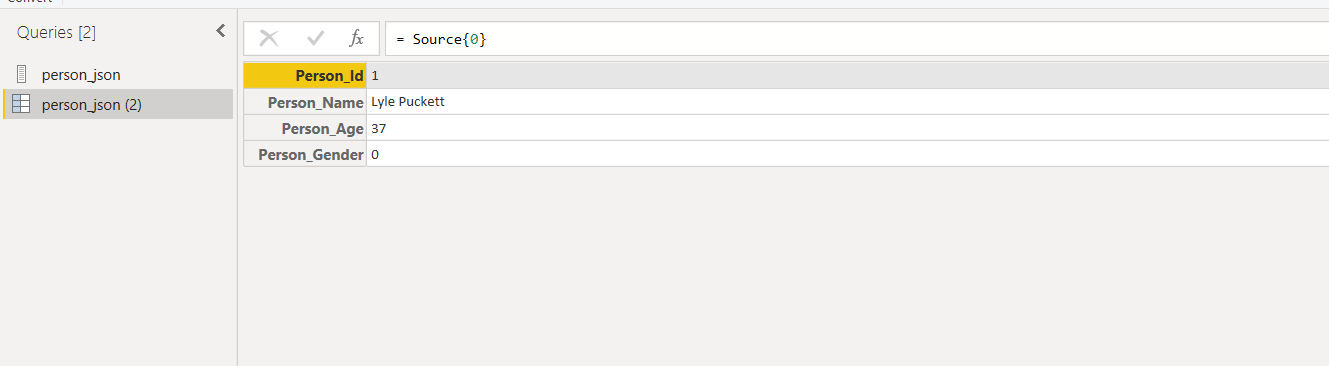
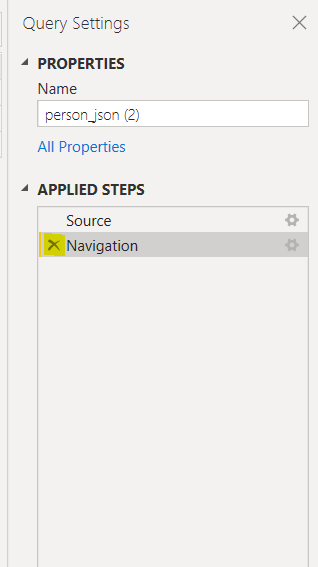
If you click on any record, you will see the details of one person, as shown below. You can see the values for the “Person_Id”, “Person_Name”, “Person_Age”, and “Person_Gender” columns.
To revert to the previous window, click the “X Navigation” button.
To convert the List into the table, click the “To Table” button from the top menu, as shown in the following screenshot.
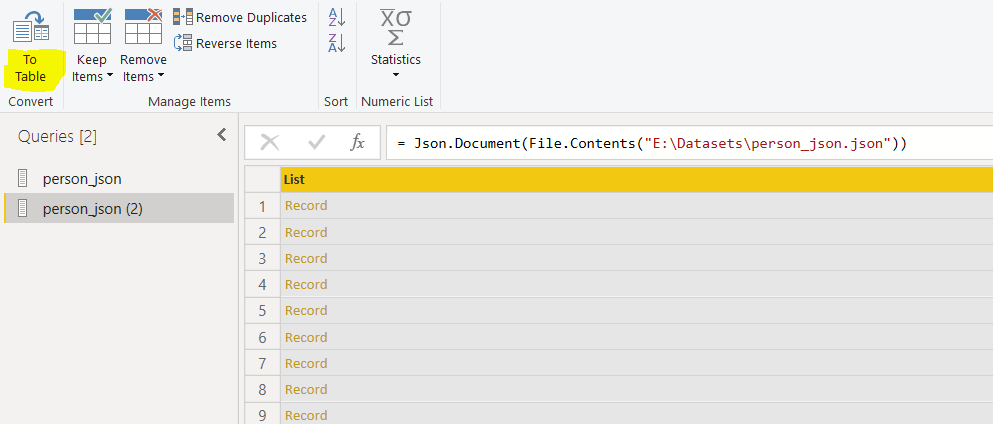
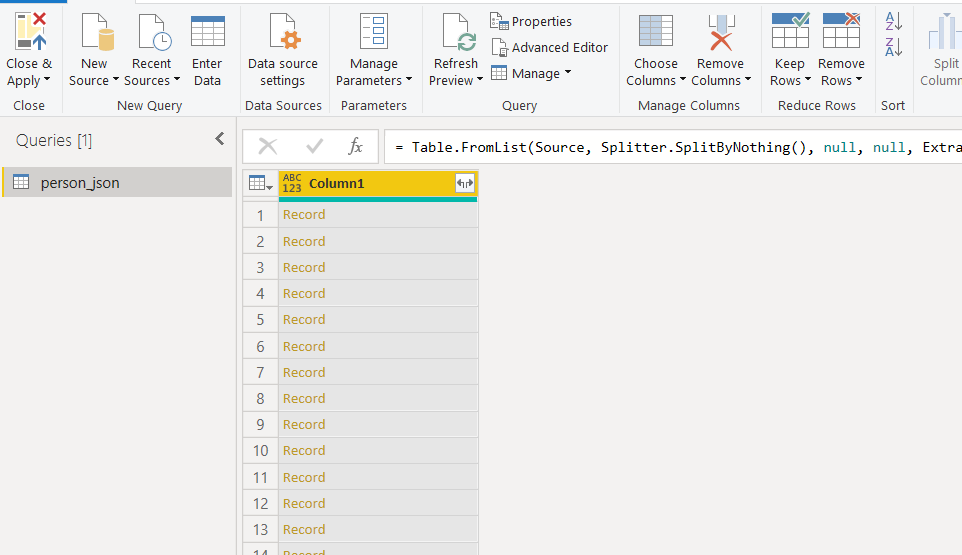
Your list will be converted into a table with 1 column. The column contains one record per person, and each record contains 4 values.
To create 4 columns, click on the “” button at the top right corner of the column name as shown in the following figure and click the “OK” button.
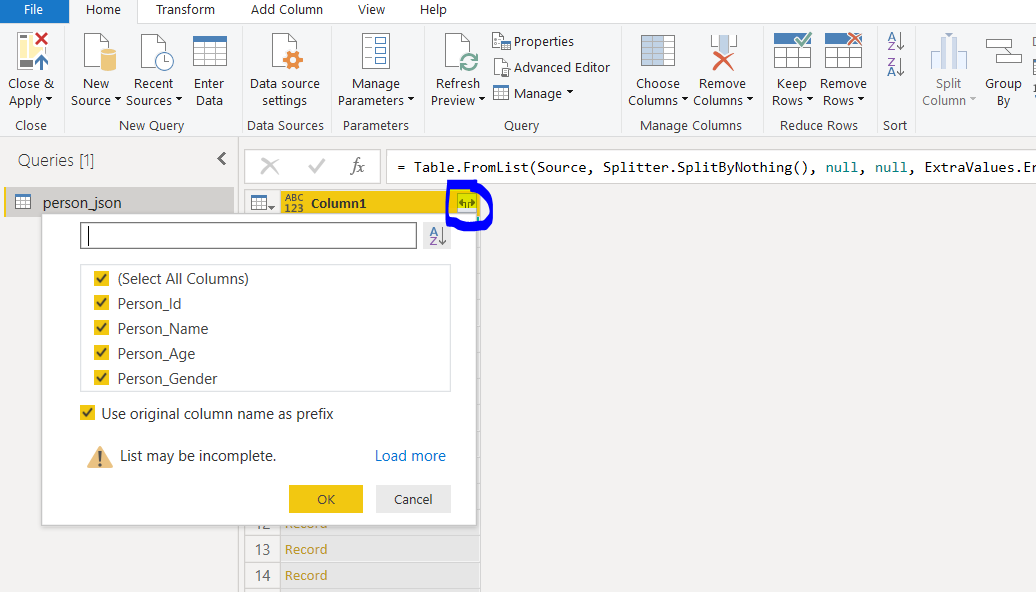
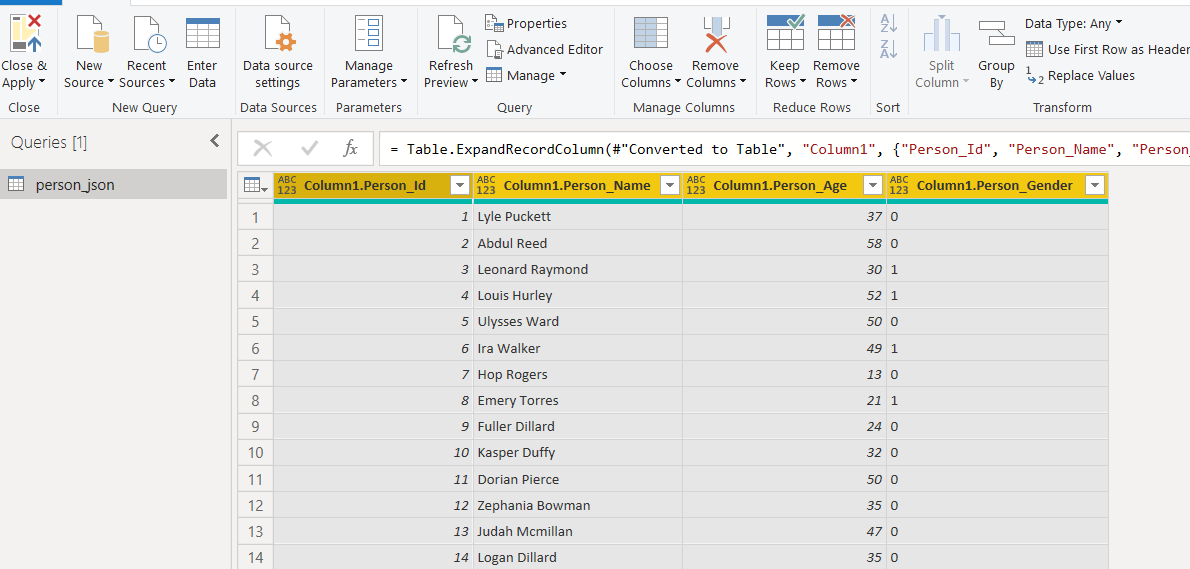
You JSON will be converted into a table, as shown below. You can see the four column names that correspond to the properties in JSON files.
To create a visualization in the form of a report, you will need to save this table.
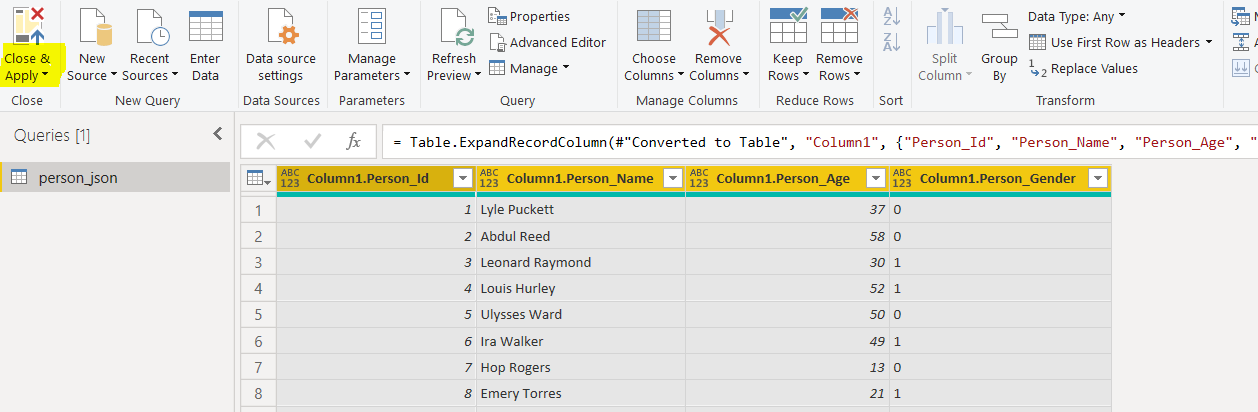
To do so, click the “Close & Apply” button, as shown below. Once you have done that, you will be taken to the Reports View.
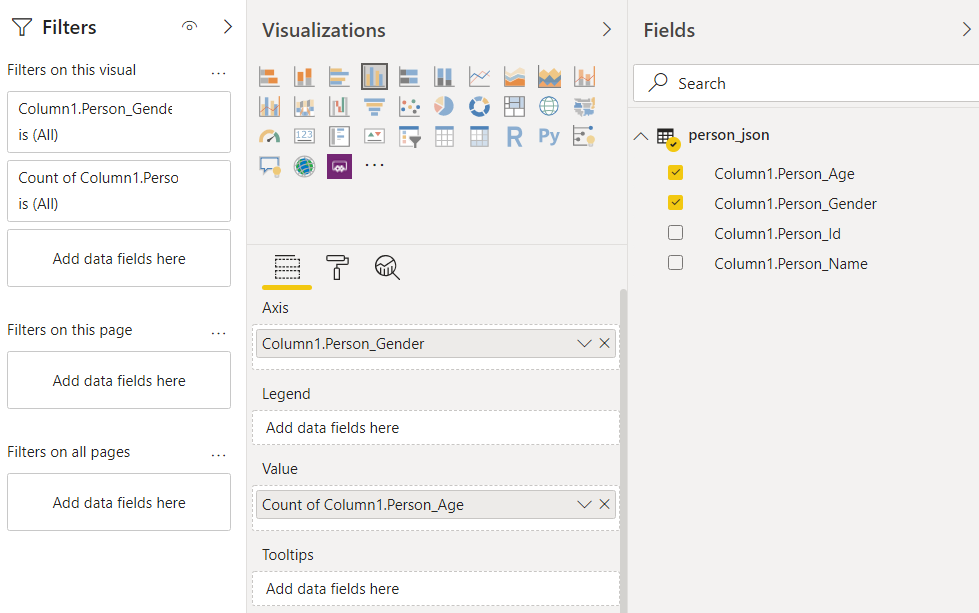
From the reports view, select the “Clustered column chart”, as shown in the “Visualization” field below. Add the “Person Gender” column to the Axis and “Person Age” column to the Value field.
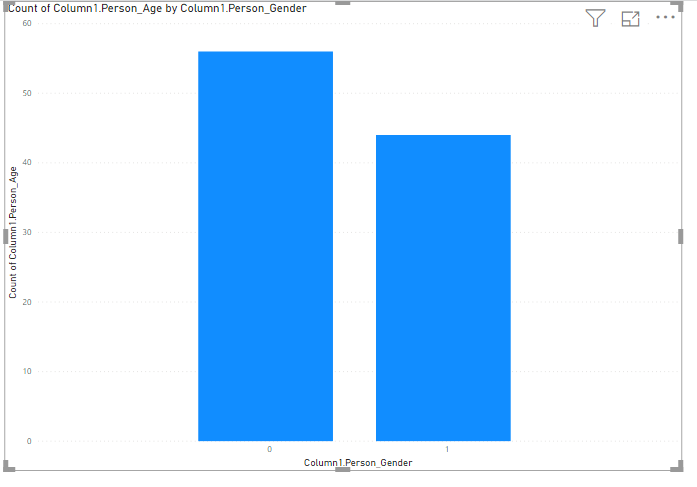
A clustered column chart, such as the one shown below, will be created. The chart shows that the number of persons with gender id 0 is higher than the ones with gender id 1.
Importing with Power BI Rest API Calls
With Power BI Rest API calls, you can import data from websites that provide restful APIs for data access. Once the data is imported, you can treat it like any other data file such as JSON or CSV, etc.
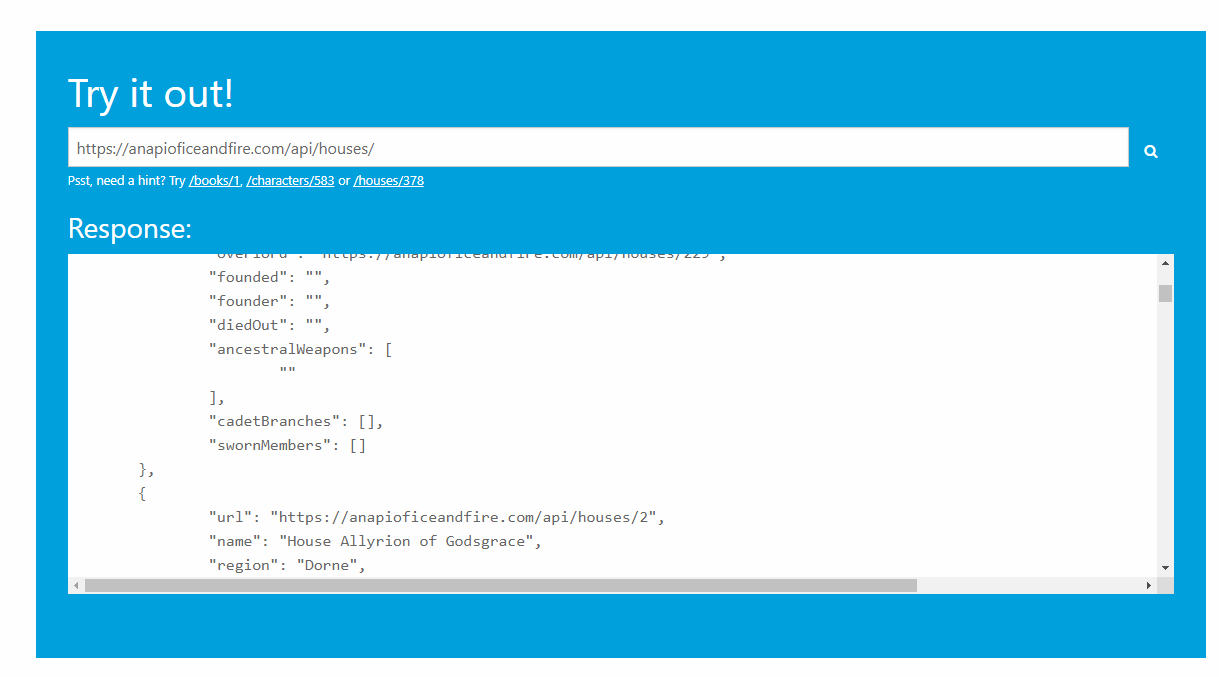
In this article, we will be importing information about the 8 different houses from the TV Show Game of Thrones. The data is hosted here, https://anapioficeandfire.com/. The website provides an API to access books, characters, and houses from the novel series: A Song Of Ice And Fire.
If you click this link, the below will appear in your browser window.
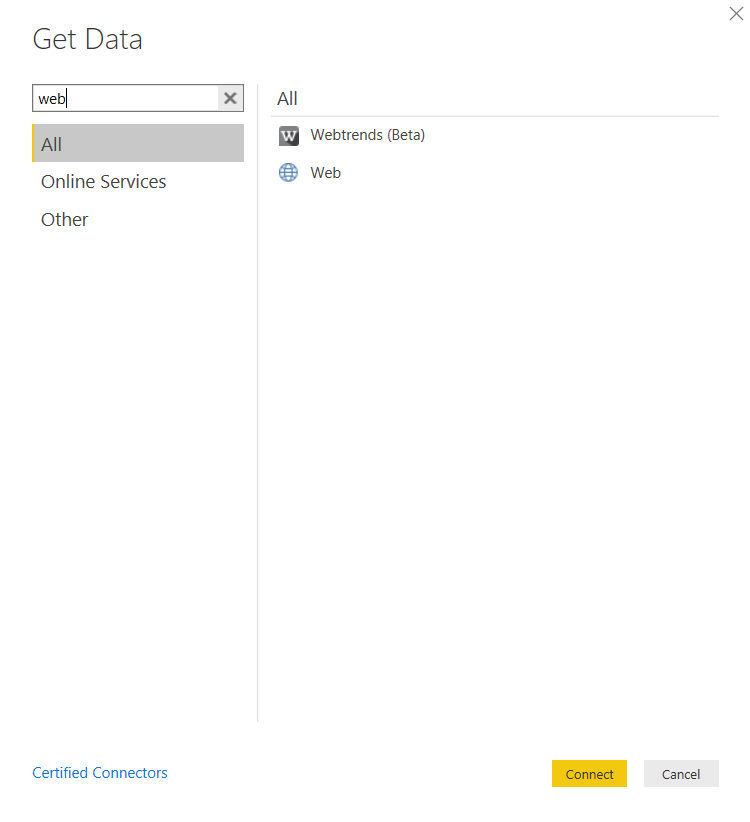
To get data via Power BI Rest API calls, you have to specify “Web” as the data source in the “Get Data” menu, as shown below. Click the “Connect” button.
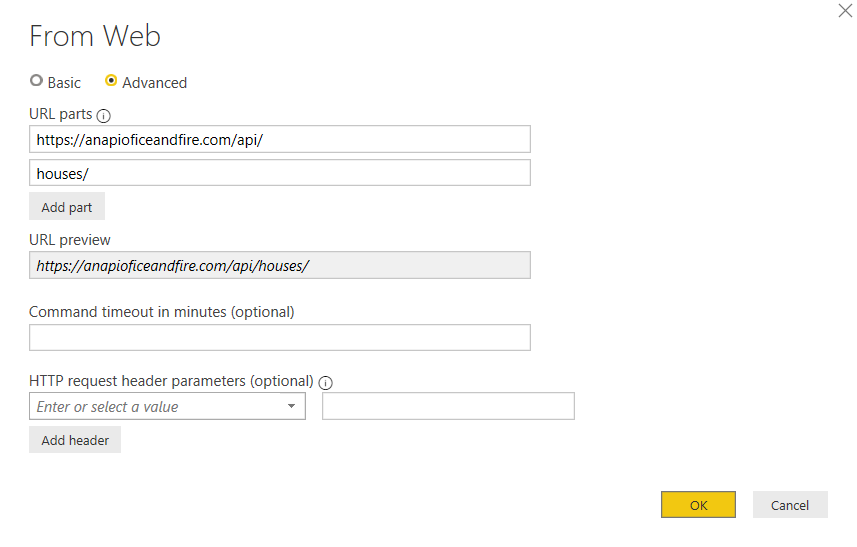
In the dialogue box that appears, specify https://anapioficeandfire.com/api/ in the first part and “houses/” in the second part. The final URL will be https://anapioficeandfire.com/api/houses/. Click the OK button.
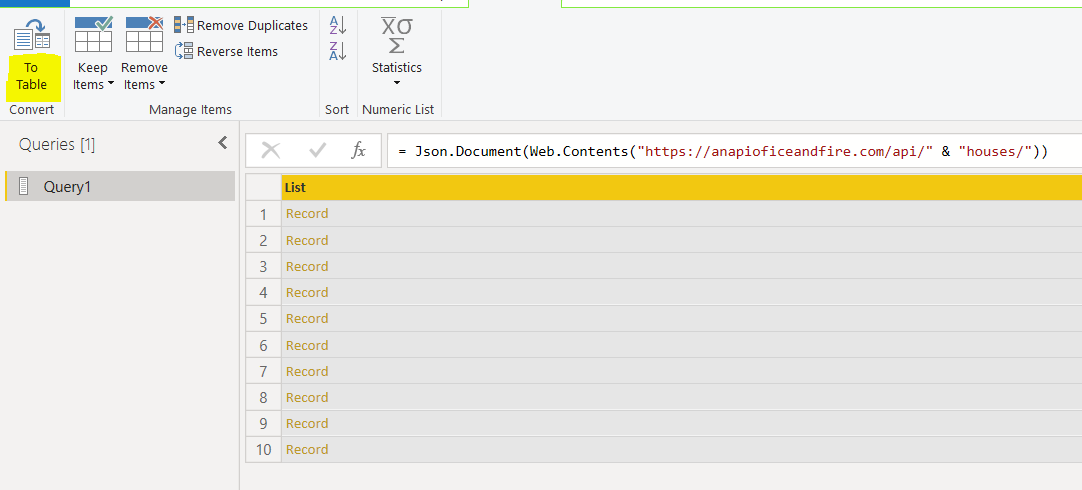
The dataset will be loaded in Power BI Query editor in the form of a JSON file having 10 records.
Each record contains information about one of the houses in the novel series, as shown below:
The rest of the process is similar to what you did in order to expand data imported via JSON files above.
Click on the “To Table” option from the menu bar. The dataset will be converted to a table.
Again, extend the column by clicking the “<->” symbol at the top of the column name as shown below:
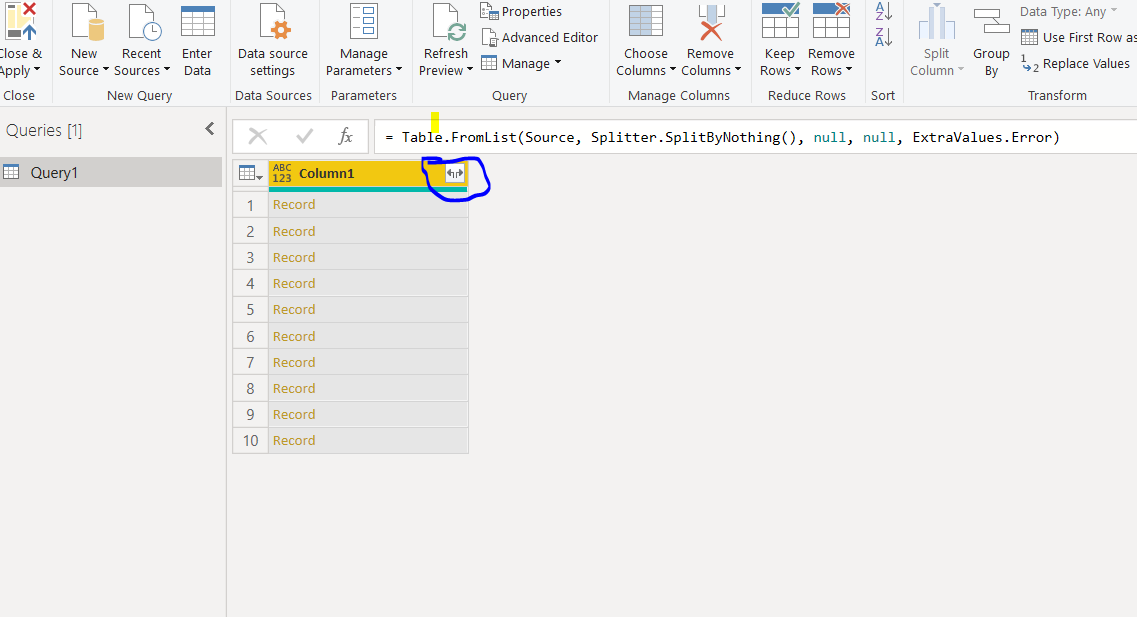
You will see all the column names, as shown below. Click the OK button.

The column names will be extended. If you look at the “titles” and “seats” columns, you will see that the columns are lists. Expand the columns in the same way that you expanded the original list column by clicking the “<->” button at the top right of the column name as shown below:
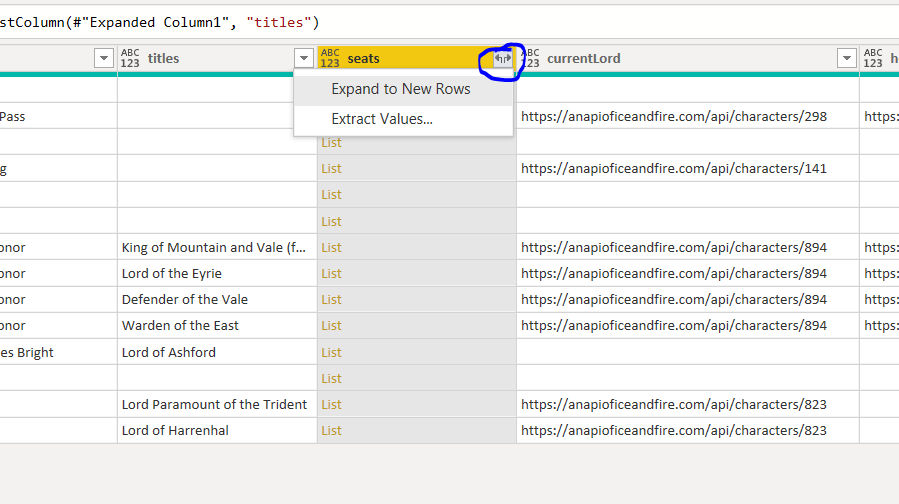
Once you expand both the “title” and the “seats” column, the dataset should look like this:
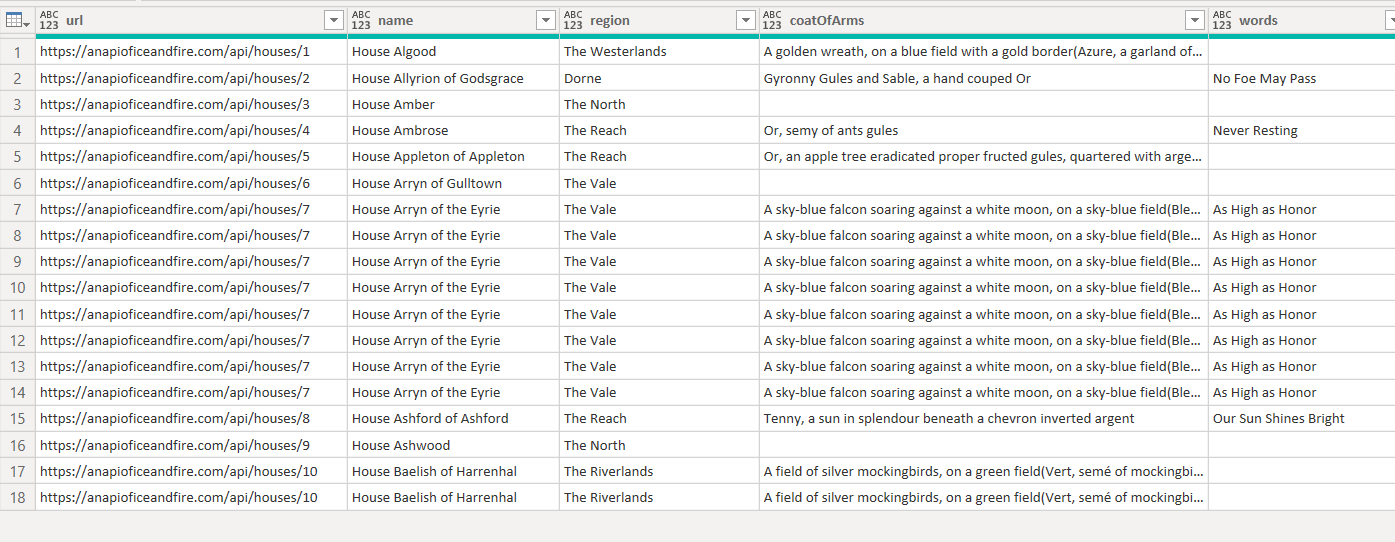
You can see that duplicate records have been added when you expand the “title” and “seats” column. This is because one house can have multiple titles and seats. Therefore, for each title and seat, a new row is added, resulting in duplicate rows for house names.
Click on the “Close & Apply” button from the top menu to open this dataset in the Query window.
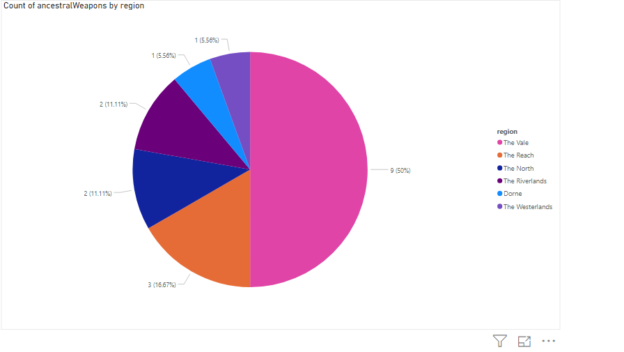
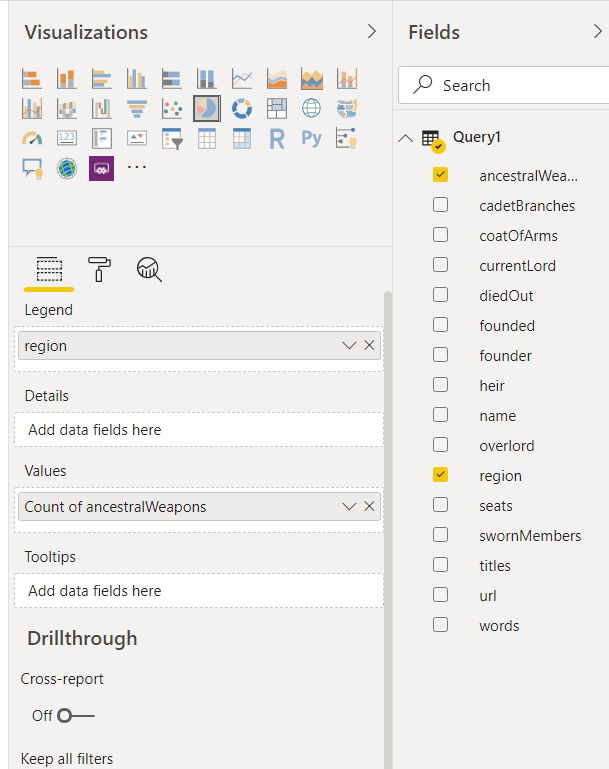
The final step is to create a simple visualization using this data. We will create a simple pie chart that will show the distribution of ancestral weapons by region.
To do this, start by clicking on the “pie” chart option from visualizations, as shown below. In the “Legend” field, add “region” and in the values field add “Count of ancestral Weapons”, as shown in the following screenshot.
The following Pie chart will be created as a result. The pie chart shows that almost 50% of the ancestral weapons belong to the region “The Vale”. Similarly, 11.1% of weapons belong to each of the “The Reach” and “The North” region.

In the same way, you can try and add other visualizations to further explore the data.
Conclusion
Power BI can import data from a variety of data sources such as CSV, TSV, JSON files, online flat files, databases, and via power BI REST API calls. In this article, we looked at how to import data via the JSON files and how to use Power BI Rest API calls to import data from websites that provide support for REST APIs. With JSON files, data is imported in the form of records, which you have to first convert to a table. Then you have to expand the table containing JSON records to create one column for each property in a record. With power BI REST APIs, you can import data from a remote location in the form of a JSON file and then explore the data just as you would a local JSON file.

View all posts by Ben Richardson
- Working with the SQL MIN function in SQL Server - May 12, 2022
- SQL percentage calculation examples in SQL Server - January 19, 2022
- Working with Power BI report themes - February 25, 2021