
Introduction
In this article, we are looking at T-SQL commands of GROUP BY ROLLUP to aggregate data and improve the data analytical capabilities in SQL Server.
First, let us see what is the sample dataset that we are going to use. We will be using vTargetMail view and DimGeograohy table in the AdventureWorksDW sample database.
Let us look at the sample dataset from the following query.
|
1 2 3 4 5 6 |
SELECT G.EnglishCountryRegionName ,G.StateProvinceName ,G.City ,M.[YearlyIncome] FROM [AdventureWorksDW2017].[dbo].[vTargetMail] M INNER JOIN [dbo].[DimGeography] G ON m.GeographyKey = G.GeographyKey |
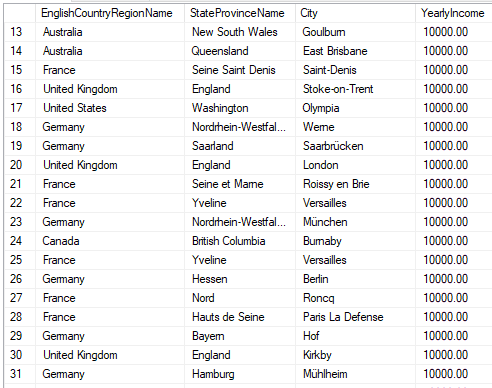
In this dataset, we have the Region Name, Province and City as label columns and YearlyIncome as the measure column as you can see from the following figure.
GROUP BY is a very common aggregation function that is used simple aggregate data for the provided columns. For example, if we wish to aggregate the above dataset by Region Name, Province and City, you can use the GROUP BY clause as follows.
|
1 2 3 4 5 6 7 8 9 10 11 12 |
SELECT G.EnglishCountryRegionName ,G.StateProvinceName ,G.City ,SUM(M.[YearlyIncome]) TotalIncome FROM [AdventureWorksDW2017].[dbo].[vTargetMail] M INNER JOIN [dbo].[DimGeography] G ON m.GeographyKey = G.GeographyKey GROUP BY G.EnglishCountryRegionName ,G.StateProvinceName ,G.City ORDER BY G.EnglishCountryRegionName ,G.StateProvinceName ,G.City |
Following will be the output for the above query.
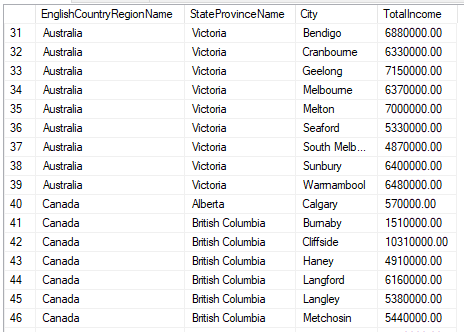
You will see that data is aggregated for the columns provided by the GROUP BY clause. Important to note that the data will not be ordered in the GROUP BY columns and you need to explicitly order them by using the ORDER BY clause as shown in the above query.
In the above query, if you wish to find the total for Australia only, you need to run another GROUP BY with EnglishCountryRegionName and perform a UNION ALL. This will be a very ugly method. By using GROUP BY ROLLUP you can achieve the above-said task as shown in the following query.
|
1 2 3 4 5 6 7 |
SELECT G.EnglishCountryRegionName ,G.StateProvinceName ,G.City ,SUM(M.[YearlyIncome]) TotalIncome FROM [AdventureWorksDW2017].[dbo].[vTargetMail] M INNER JOIN [dbo].[DimGeography] G ON m.GeographyKey = G.GeographyKey GROUP BY ROLLUP(G.EnglishCountryRegionName, G.StateProvinceName, G.City) |
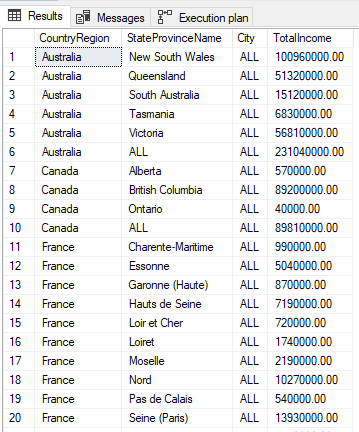
The output of the above query has two advantages that did not exist in the GROUP BY option.
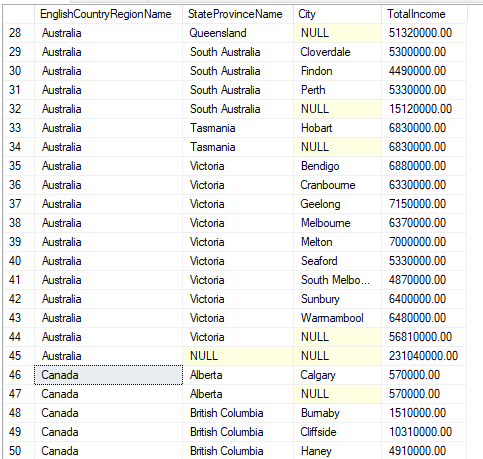
First, the output will be sorted in the columns that were provided in the GROUP BY ROLLUP statement. Apart from the ordering, you have the aggregation for the different combinations as well. As we observed in the GROUP BY statement, all the data is aggregated to all three columns. However, with the GROUP BY ROLLUP statement, there will be many aggregations. For example, in the above output, row 32 is aggregated to Australia, South Australia and Row 34 is aggregated to Australia and Tasmania while Row number 45 is aggregated to Australia.
Apart from simple aggregation, there are a few features available with GROUP BY ROLLUP.
GROUPING
By using the GROUPING function, you can find out what columns are used for aggregation.
|
1 2 3 4 5 6 7 8 9 10 |
SELECT ISNULL(G.EnglishCountryRegionName, 'ALL') CountryRegion ,ISNULL(G.StateProvinceName, 'ALL') StateProvinceName ,ISNULL(G.City, 'ALL') City ,SUM(M.[YearlyIncome]) TotalIncome ,GROUPING(G.EnglishCountryRegionName) IsEnglishCountryRegionNameGrouping ,GROUPING(G.StateProvinceName) IsStateProvinceNameGrouping ,GROUPING(G.City) IsCityGrouping FROM [AdventureWorksDW2017].[dbo].[vTargetMail] M INNER JOIN [dbo].[DimGeography] G ON m.GeographyKey = G.GeographyKey GROUP BY ROLLUP(G.EnglishCountryRegionName, G.StateProvinceName, G.City) |
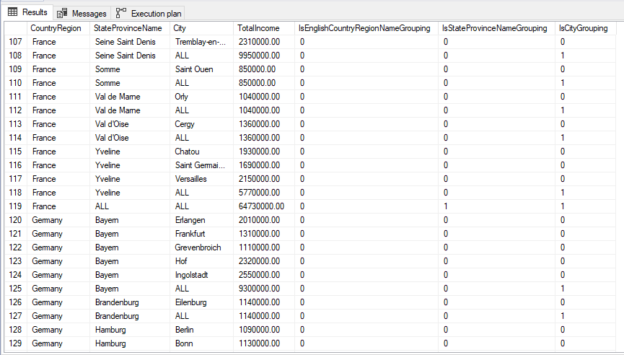
Apart from the GROUPING function, we have used the ISNULL function in order to replace NULL values to ALL.

In Row 108, the City value is replaced by ALL values in the isCityGrouping column is shown as 1 to indicated that the City column is aggregated.
You can use the GROUPING function at the HAVING clause in GROUP BY ROLLUP as shown in the below query.
|
1 2 3 4 5 6 7 8 9 10 |
SELECT ISNULL(G.EnglishCountryRegionName, 'ALL') CountryRegion ,ISNULL(G.StateProvinceName, 'ALL') StateProvinceName ,ISNULL(G.City, 'ALL') City ,SUM(M.[YearlyIncome]) TotalIncome FROM [AdventureWorksDW2017].[dbo].[vTargetMail] M INNER JOIN [dbo].[DimGeography] G ON m.GeographyKey = G.GeographyKey GROUP BY ROLLUP(G.EnglishCountryRegionName, G.StateProvinceName, G.City) HAVING GROUPING(G.EnglishCountryRegionName) = 1 OR GROUPING(G.StateProvinceName) = 1 OR GROUPING(G.City) = 1 |
The above query will provide you with only the aggregated columns and standard GROUP BY values are ignored.
In case there are NULL values in the original values there will be issues with the ISNULL function. Therefore, the different techniques should be used, and the following query has used CASE and ISNULL functions together to achieve this.
|
1 2 3 4 5 6 7 8 9 10 11 12 13 14 15 16 17 18 19 |
SELECT CASE WHEN GROUPING(G.EnglishCountryRegionName) = 1 THEN 'ALL' ELSE ISNULL(G.EnglishCountryRegionName, 'UNKNOWN') END CountryRegion ,CASE WHEN GROUPING(G.StateProvinceName) = 1 THEN 'ALL' ELSE ISNULL(G.StateProvinceName, 'UNKNOWN') END StateProvinceName ,CASE WHEN GROUPING(G.City) = 1 THEN 'ALL' ELSE ISNULL(G.City, 'UNKNOWN') END City ,SUM(M.[YearlyIncome]) TotalIncome FROM [AdventureWorksDW2017].[dbo].[vTargetMail] M INNER JOIN [dbo].[DimGeography] G ON m.GeographyKey = G.GeographyKey GROUP BY ROLLUP(G.EnglishCountryRegionName, G.StateProvinceName, G.City) |
In the above query, the ISNULL function is used to display UNKNOWN for the NULL values and the GROUPING function is used to display ALL for the aggregate columns. Since NULL Values do not exist in the selected dataset, there will not be any difference to that output that you observed before.
CUBE Function
Instead of the GROUP BY ROLLUP function, we can use the GROUP BY CUBE function to retrieve the different output. In the ROLLUP, aggregate is carried out in the order of provided columns. CUBE function will aggregate for all the combinations.
Let us combining CUBE and GROUPING functions as shown in the below query.
|
1 2 3 4 5 6 7 8 9 10 11 12 13 14 15 16 17 18 19 20 21 22 |
SELECT CASE WHEN GROUPING(G.EnglishCountryRegionName) = 1 THEN 'ALL' ELSE ISNULL(G.EnglishCountryRegionName, 'UNKNOWN') END CountryRegion ,CASE WHEN GROUPING(G.StateProvinceName) = 1 THEN 'ALL' ELSE ISNULL(G.StateProvinceName, 'UNKNOWN') END StateProvinceName ,CASE WHEN GROUPING(G.City) = 1 THEN 'ALL' ELSE ISNULL(G.City, 'UNKNOWN') END City ,SUM(M.[YearlyIncome]) TotalIncome FROM [AdventureWorksDW2017].[dbo].[vTargetMail] M INNER JOIN [dbo].[DimGeography] G ON m.GeographyKey = G.GeographyKey GROUP BY CUBE(G.EnglishCountryRegionName, G.StateProvinceName, G.City) HAVING GROUPING(G.EnglishCountryRegionName) = 1 OR GROUPING(G.StateProvinceName) = 1 OR GROUPING(G.City) = 1 |
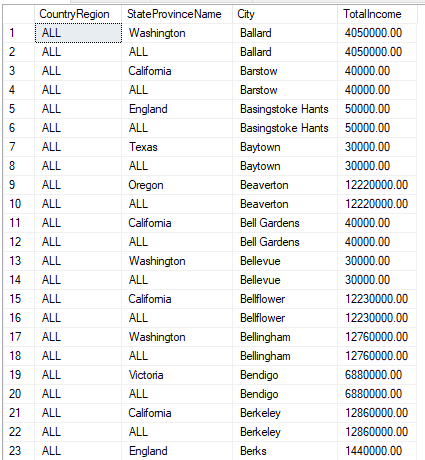
The result of the above query is shown below.
GROUPING SETS
GROUP BY ROLLUP and GROUP BY CUBE clauses will provide different combinations of the aggregated columns. However, most of these combinations will not be useful for the developers. GROUPING SETS will provide you with the option of controlling the aggregates.
|
1 2 3 4 5 6 7 8 9 10 11 12 13 14 15 16 17 18 19 20 21 22 23 24 25 26 27 |
SELECT CASE WHEN GROUPING(G.EnglishCountryRegionName) = 1 THEN 'ALL' ELSE ISNULL(G.EnglishCountryRegionName, 'UNKNOWN') END CountryRegion ,CASE WHEN GROUPING(G.StateProvinceName) = 1 THEN 'ALL' ELSE ISNULL(G.StateProvinceName, 'UNKNOWN') END StateProvinceName ,CASE WHEN GROUPING(G.City) = 1 THEN 'ALL' ELSE ISNULL(G.City, 'UNKNOWN') END City ,SUM(M.[YearlyIncome]) TotalIncome FROM [AdventureWorksDW2017].[dbo].[vTargetMail] M INNER JOIN [dbo].[DimGeography] G ON m.GeographyKey = G.GeographyKey GROUP BY GROUPING SETS(( G.EnglishCountryRegionName ,G.StateProvinceName ,G.City ), ( G.EnglishCountryRegionName ,G.City ), () ) |
In the GROUPING SETS combinations, there are four combinations provided. Like ROLLUP and CUBE, it can be used the GROUPING option for the GROUPING SETS command as well.
Conclusion
Aggregation is used to analyze data in the analytical system. Traditionally, GROUP BY is used to aggregate data. However, ROLLUP, CUBE and GROUPING SETS are used to return different aggregate values. ROLLUP will provide the aggregation in the provided order of the columns while CUBE will provide different combinations of the provided columns and GROUPING SETS has the option of aggregation in a customized manner. By using the GROUPING function, more options for the above features can be derived.

View all posts by Dinesh Asanka
- Testing Type 2 Slowly Changing Dimensions in a Data Warehouse - May 30, 2022
- Incremental Data Extraction for ETL using Database Snapshots - January 10, 2022
- Use Replication to improve the ETL process in SQL Server - November 4, 2021