

Using Azure SQL Analytics, you will rediscover the new ways to manage the Azure SQL Database. Microsoft is driving an intelligent platform to provide seamless collaboration for all their end users to business analysts, by building an effective Log Analytics stack and intelligent insight through dashboards.
Introduction
The emerging force in the industry is by far Cloud technology. Did you ever get a chance to work on Azure SQL Analytics? I feel it is worth giving a try. Let us get started. Azure SQL database—is commonly known as Azure SQL is a relational database service. It provides relational SQL Server like capabilities to the applications that are running in Azure cloud. It is highly scalable and available to the applications. Azure SQL database meets the SLA 99.995% availability for the zone redundant databases. However, Microsoft strategically brought Analytics integration to Azure SQL database. I see it is a real game-changer.
In this article, you will see how to monitor the database metrics using Azure analytics solution.
- Analytics in general
- Understand Operational Management Suite(OMS)
- Configure Log Analytics workspace using Azure Market Place
- Create an Azure SQL Analytics
- Integrate Azure SQL Analytics with Log Analytics workspace
- Configure data stream of telemetry data into the Log Analytics workspace
- Define Kusto Query
- And more…
Why do we need Analytics?
Analytics is a methodology where you’ll analyze the statistical data to gain insight into the more meaningful details about the data.
Analytics is a process of turning the raw data into insightful data that will lead to building effective decision-making systems. Analytics heavily relies on the type of data gathering systems. The humans are using a more sophisticated system that deals with billions of data points—Analytics is very useful in the areas where we gather a huge amount of data to derive more meaningful insights for the data to make storytelling much easier.
What is Azure SQL Analytics?
Azure SQL Analytics (Preview function) is a cloud-based solution that gathers the performance metrics of several Azure database service components such as Azure SQL databases, Azure elastic pooled, and managed instances. You can manage the data collection across multiple subscriptions. It provides a platform to collect, analyze, and visualize the database performance metrics that are helpful for performance troubleshooting and reporting purposes.
Operations Management Suite (OMS)
OMS is a management offering that provides a framework for monitoring Azure Resources using the Log Analytics service.
Log Analytics service provides a platform to the users to collect metrics, correlate, and visualize structured-and-unstructured data. Also, OMS Log Analytics—users can monitor Azure resources and use inbuilt alert alerting and notifying the health of the Azure resources.
Using OMS Log Analytics services—users can easily build custom solutions to monitor the health of the resource and define custom rules in addition to rules provided with the Analytics services. It also enables us to monitor multiple Azure subscriptions and their associated resources.
This preview feature supports up to 150,000 Azure SQL databases and 5,000 SQL Elastic Pools.
Installation overview
Let us configure the streaming the diagnostic telemetry into the Log Analytics Service You can configure the diagnostics settings using the Azure Management Portal or PowerShell cmdlets, or Azure CLI, or Azure Monitor REST API, or Resource Manager templates.
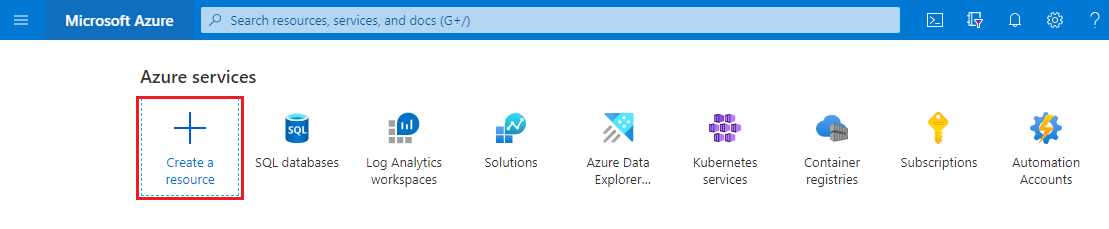
To create an Azure SQL Analytics resource, follow the below steps:
- Open the Azure Portal Management Console
-
Select the Create a resource icon

-
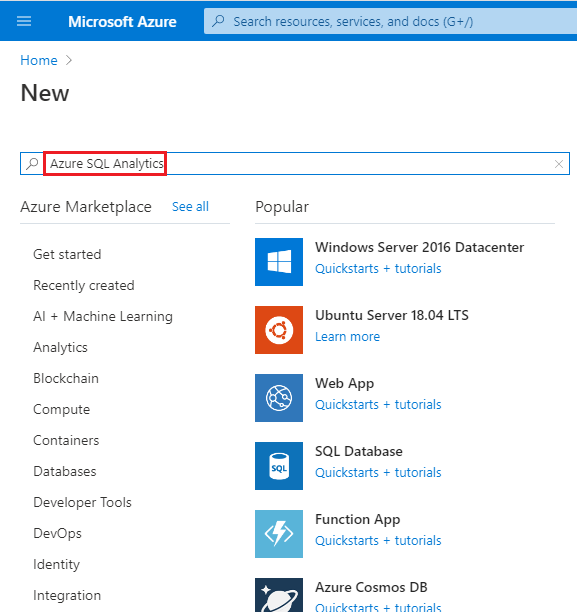
In the Azure Market place offering, type in or search the keyword Azure SQL Analytics
-
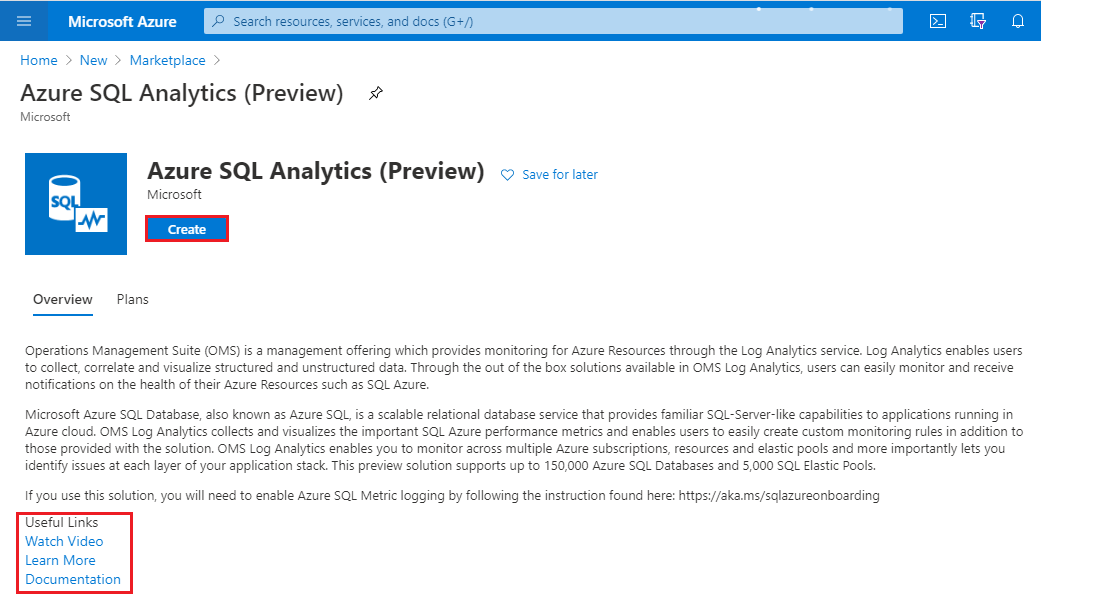
Select Azure SQL Analytics (Preview)
-
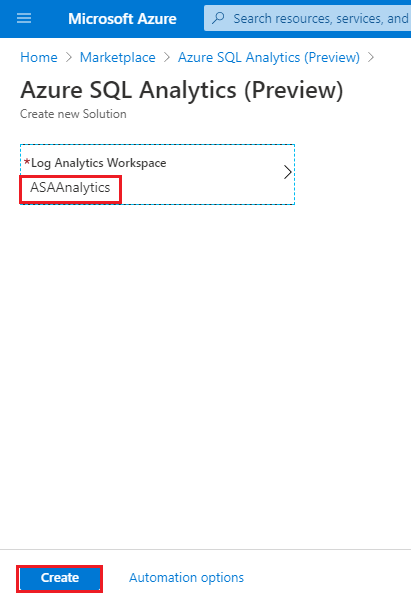
Select Create. In the same pane, you’ll see a lot of additional educational materials to go over this feature. You can click watch Azure SQL Analytics — 5 minutes video that will give the high-level details
-
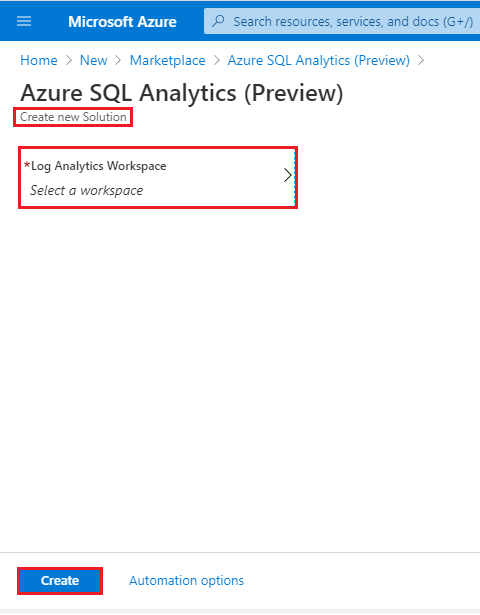
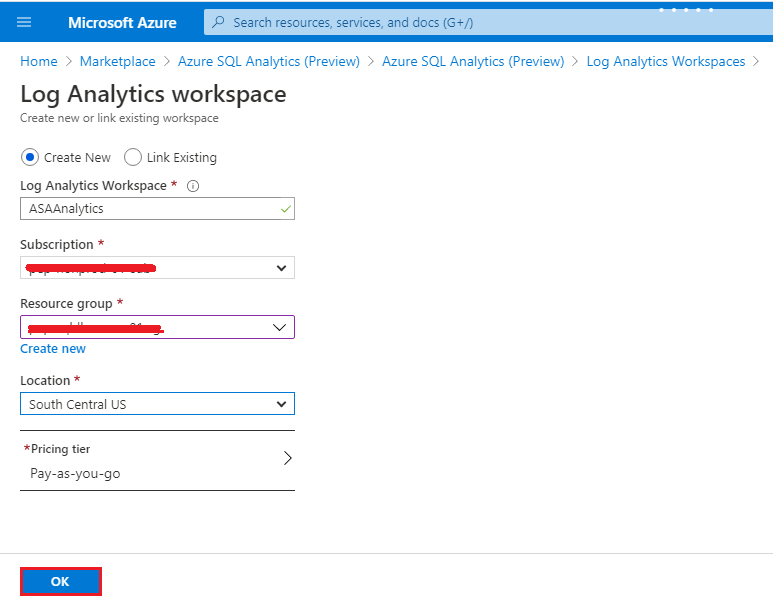
Select the option “Log Analytics Workspace”
-
Choose Create New Log Analytics Workspace. Type in the Azure SQL Analytics name, subscription, resource group, location, and pricing tier and click OK
-
Select OK and then select Create
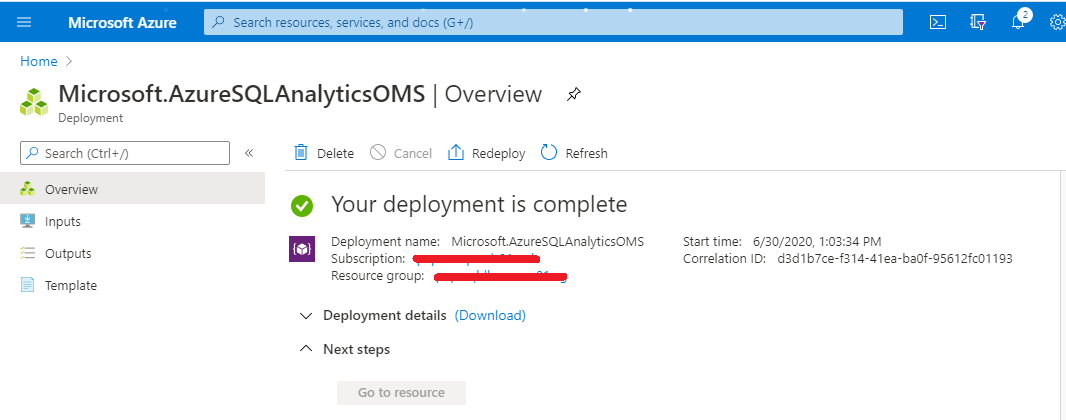
You can see the deployment successful in the following snippet
Configure the diagnostic telemetry
In this section, you will see how to configure diagnostic for SQL databases or elastic database or managed instances. It is very easy to configure and gather the metrics using the Azure portal.
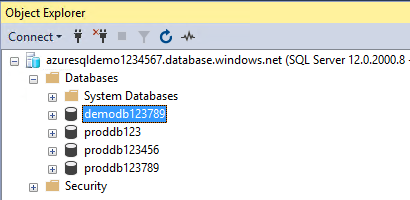
In this exercise, you’ll see azuresqldemp1234567 instance created with multiple databases. Let us go ahead and plug diagnostic telemetry into the OMS workspace ASAnalytics.
Let us connect to Azure SQL databases to list the Azure SQL databases.
Next, Open the Azure Management Portal and Browse Azure SQL Database instance azuresqldemo1234567
After selecting the Azure SQL Instance, locate the demodb azure SQL database. Choose the database where you need to configure diagnostic telemetry and send the logs into the OMS workspace.
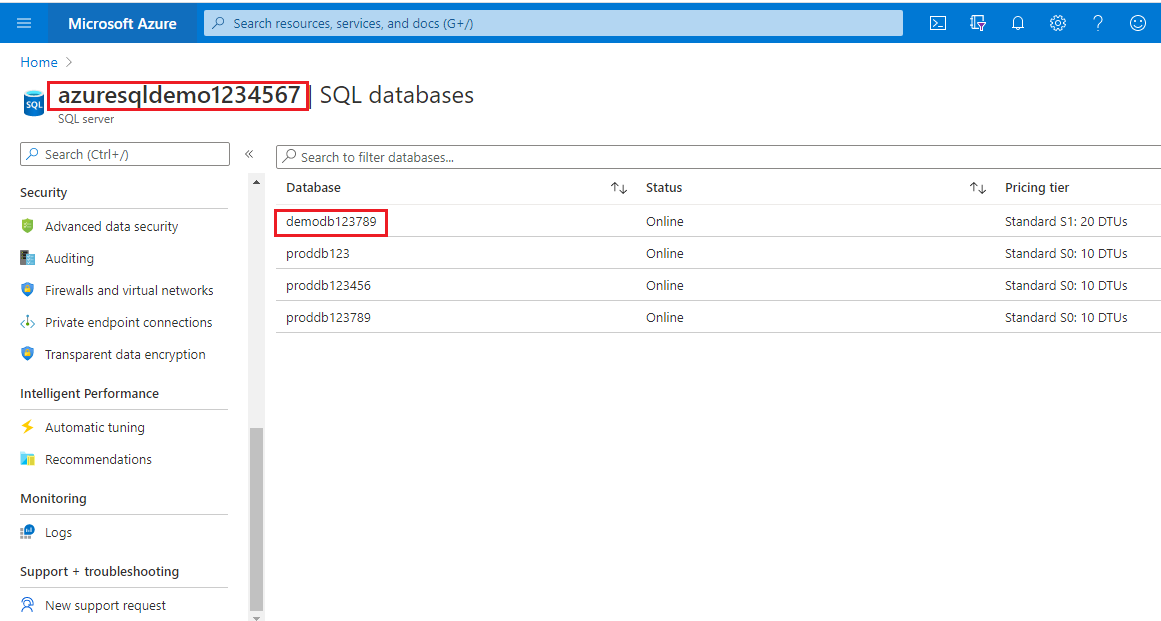
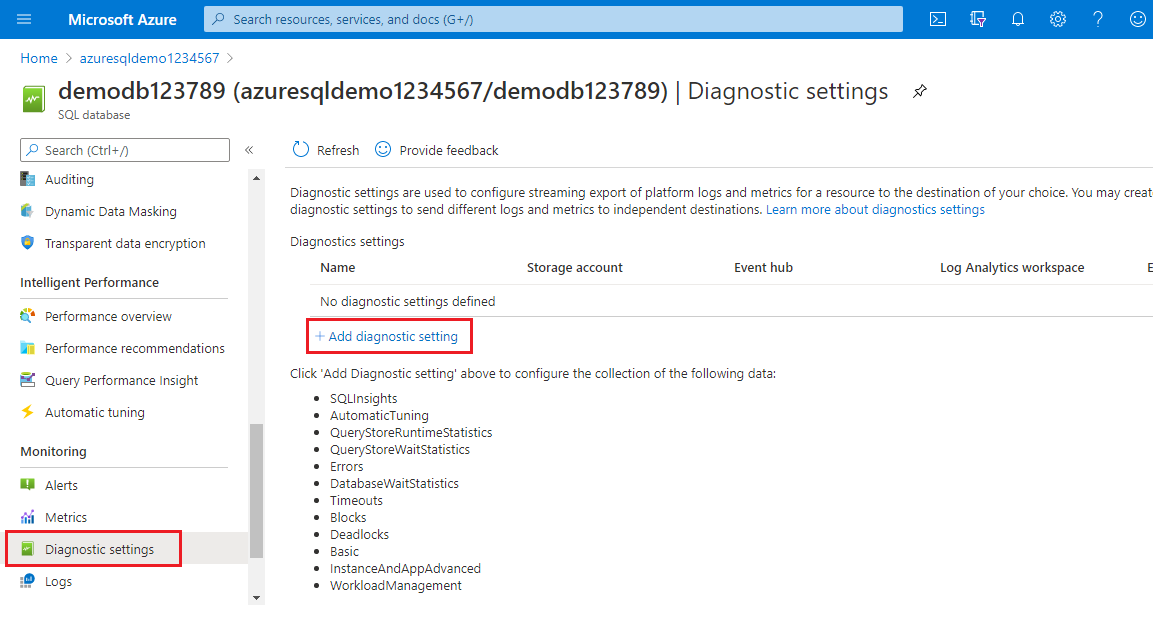
After selecting the Azure SQL database demodb123789, scroll down on the left blade and locate the Monitoring pane.
Click Diagnostic settings and click “+Add diagnostic setting” on the right blade of the Azure Management Portal.
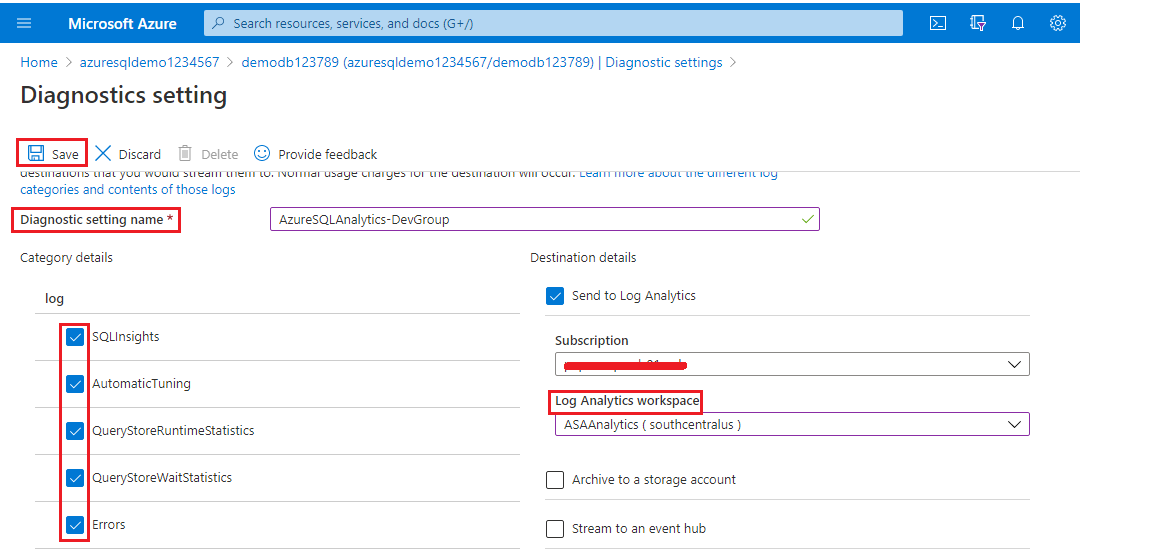
Next, enable diagnostics and send telemetry data into the Log Analytics workspace.
- Type in the Diagnostic setting name. In this case, AzureSQLAnalytics-DevGroup is the name of the diagnostic setting
- In the log Analytics workspace drop-down, select the ASAAnalytics workspace
- Now, click the Save button to save the settings
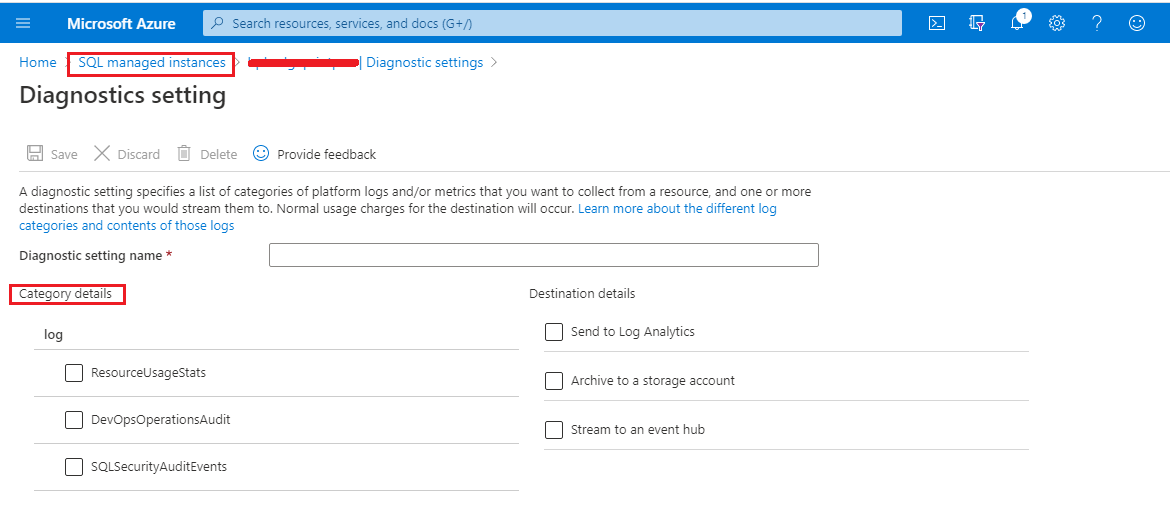
Let us take a look at the SQL Analytics category. The category details give you an option to select the log type and the data type that you need to send to the target.
The list of categories and log type is different, it varies between each Azure service. For example, you can see the following log categories in Azure SQL databases:
- SQLInsights
- Automatic Tuning
- QueryStoreRuntimeStatistics
- QueryStoreWaitStatistics
- Errors
- DatabaseWaitStatistics
- Blocks
- Timeouts
- Deadlocks
For Azure SQL Managed Instances:
- ResourceUsageStats
- DevOpsOperationsAudit
- SQLSecurityAuditEvents
- Note: If you do not have an OMS workspace, create a new workspace before you proceed with the configuration.
All diagnostics data (telemetry data) send to the Azure OMS workspace. Internally, the metrics are sent only to the Azure Monitor metrics time-series database.
The following table gives an insight into the log category and metrics that are captured for Azure SQL database and Azure SQL Managed Instance.
|
Telemetry Category |
Azure SQL Database |
Azure SQL Managed Instance |
|
Basic metrics:
|
Y |
N |
|
Instance Level
|
Y |
N |
|
QueryStoreRuntimeStatistics
|
Y |
Y |
|
QueryStoreWaitStatistics:
|
Y |
Y |
|
Errors
|
Y |
Y |
|
DatabaseWaitStatistics
|
Y |
N |
|
Timeouts
|
Y |
N |
|
Blocks
|
Y |
N |
|
Deadlocks
|
Y |
N |
|
AutomaticTuning
|
Y |
N |
|
SQLInsights
|
Y |
Y |
Query Log Analytics
In this section, you will see how to query the database in the Log Analytics workspace using a query language called Kusto Query Language (KQL).
- Browse the database and select the logs in the left blade
- In the SQL database, select the table AzureDiagnostics and run the command
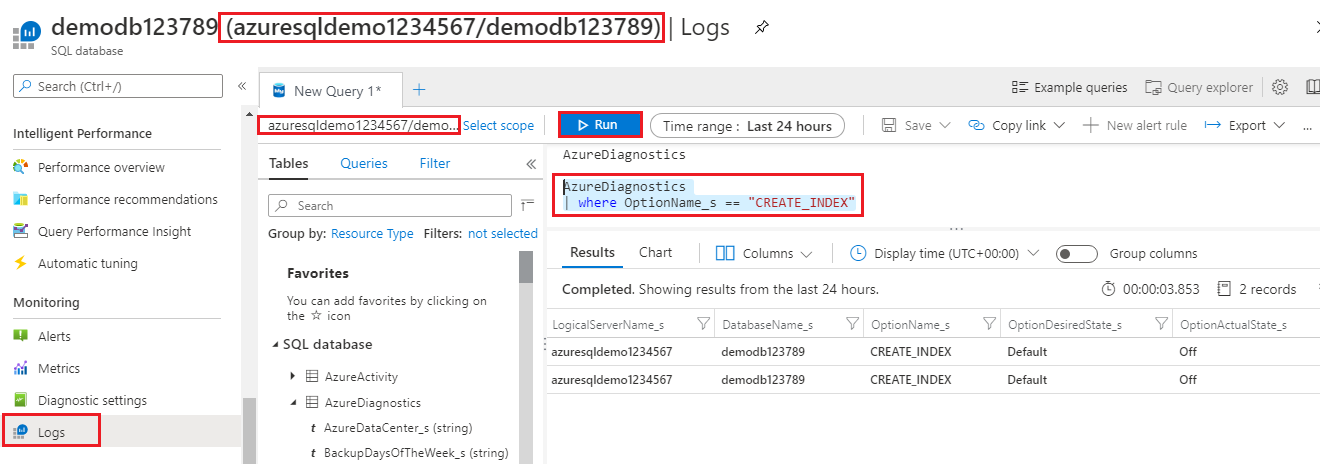
You can also see a conditional clause in the KQL query. I will discuss more about Kusto queries in my upcoming article.
To list all the diagnostics setting, select the command and Run as shown below:
AzureDiagnostics
Now, you can list the details with a conditional clause using Kusto Query Language as shown below:
AzureDiagnostics
| where OptionName_s == “CREATE_INDEX”
Summary
The future for Analytics is bright. We discussed the concepts of Azure SQL Analytics in this article. Also, we covered a step by step procedure to set up an Analytics solution. In addition, we observed, how easy it is to configure and deploy an analytics solution that delivers insights to the teams which need to make faster decisions at an incredible value.
In the next article, you’ll see more about Kusto Query Language and Intelligent Insights.
That’s all for now…stay tuned for more updates in my next article.

My specialty lies in designing & implementing High availability solutions and cross-platform DB Migration. The technologies currently working on are SQL Server, PowerShell, Oracle and MongoDB.
View all posts by Prashanth Jayaram
- Stairway to SQL essentials - April 7, 2021
- A quick overview of database audit in SQL - January 28, 2021
- How to set up Azure Data Sync between Azure SQL databases and on-premises SQL Server - January 20, 2021