

This article will walk you through how you can deploy a sample model on Azure Analysis Services and you will also learn the way to consume it using different tools.
Introduction
Azure Analysis Services provides capabilities need for Online Analytical Processing (OLAP) workloads. In the previous article, Getting started with Azure Analysis Services, we learned how to create an Azure Analysis Services server instance, and other options like configuration, pricing options, and ways to monitor the metrics as well as integrate it with different on-premises or external tools. Once the server has been created, and models are created or deployed on it, one would want to consume the models as well as explore the schema of the same. The common tools to consume a model are Microsoft Excel for data analysis or Power BI for data reporting, and Visual Studio for exploring the schema of the model. In this article, we will learn how to create a sample model deployed on Azure Analysis Services and also learn how to consume the model using different tools mentioned above.
Creating an Azure Analysis Services model
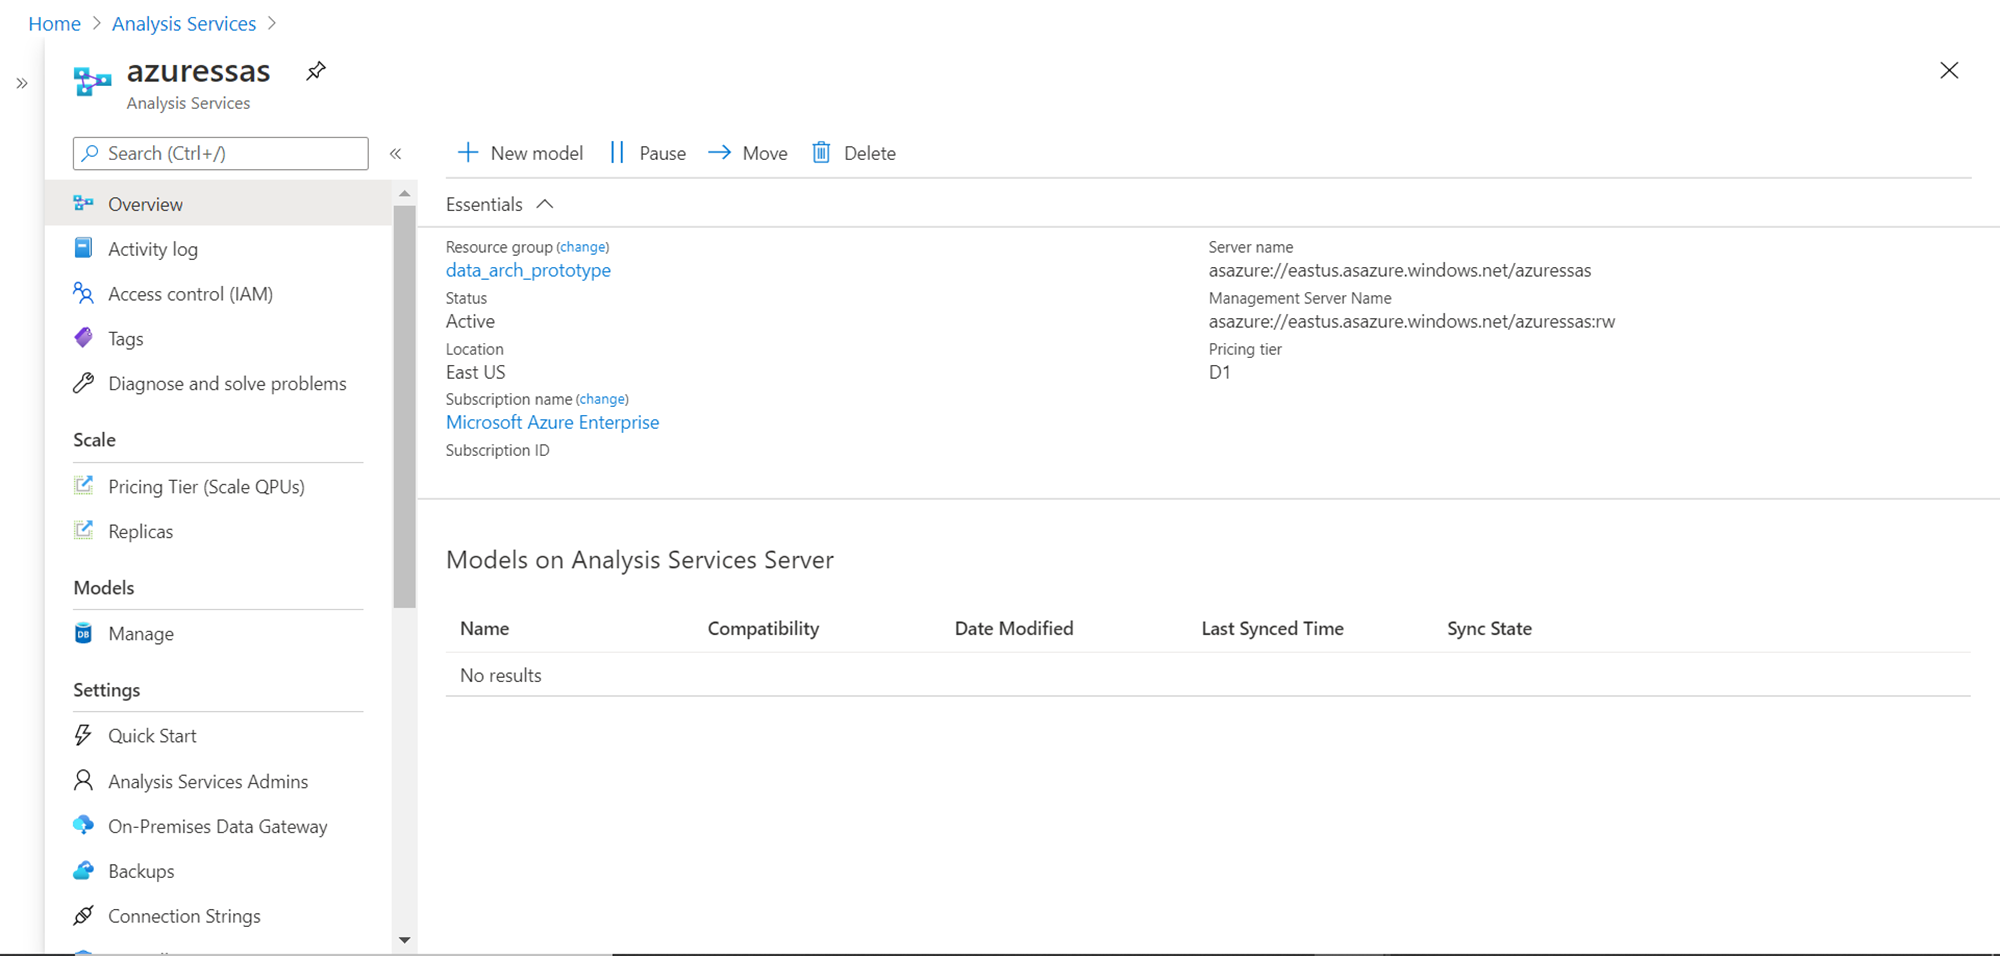
Before we learn how to create a new model, one needs to have an account as well as a server instance created in the account. Also, it’s assumed that one has the necessary administrative privileges to connect and operate the server using different tools. Ensure that required firewall settings are configured to allow incoming connections to the server instance. Assuming this setup is already in place we can start with the actual exercise to create a new model. The Azure Analysis Services instance should look as shown below.
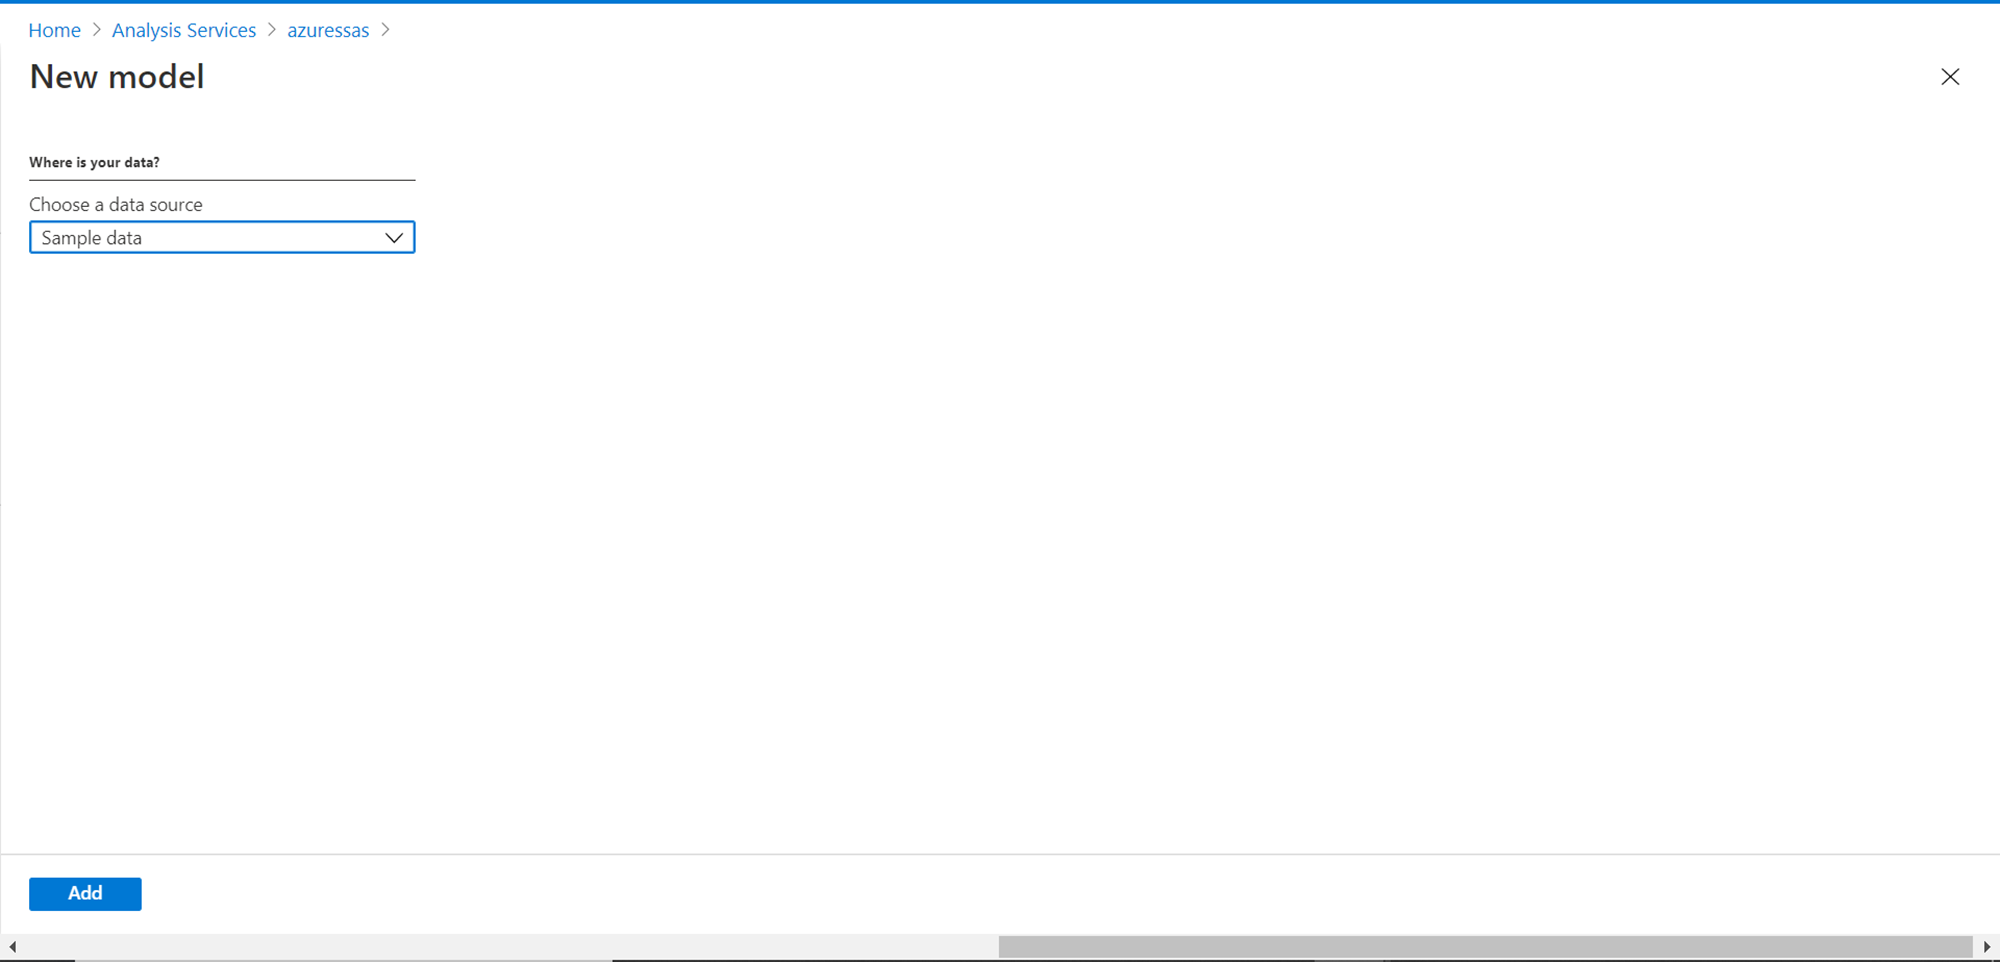
To create a new model, there’s a button on the toolbar titled New model. Click on this button and it would open a new page as shown below. We need to provide a data source here. To make our exercise easier, it also provides us with an option to use a sample data source to create the model. For now, we will select Sample data as shown below, and click on the Add button.
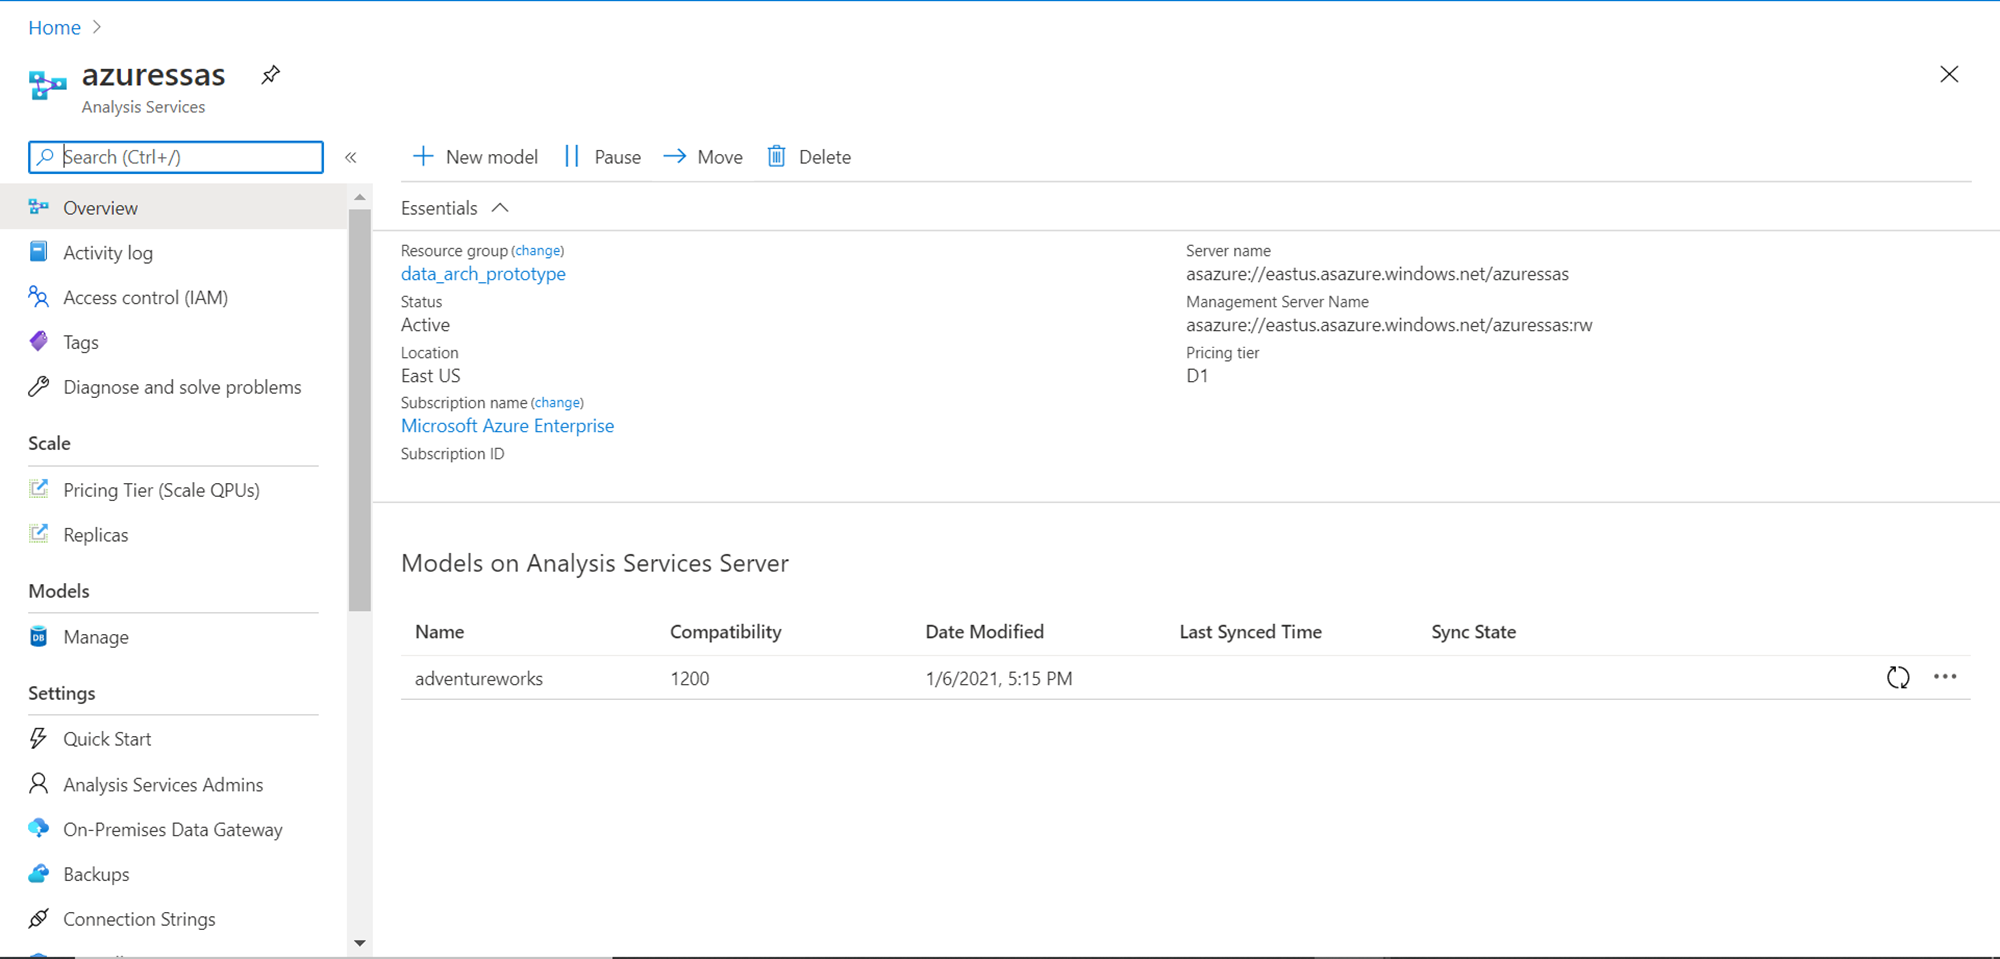
Once the model has been created on the server instance, it would get listed in the models available on the Analysis Services Server as shown below. It also shows other attributes like compatibility level, sync time etc.
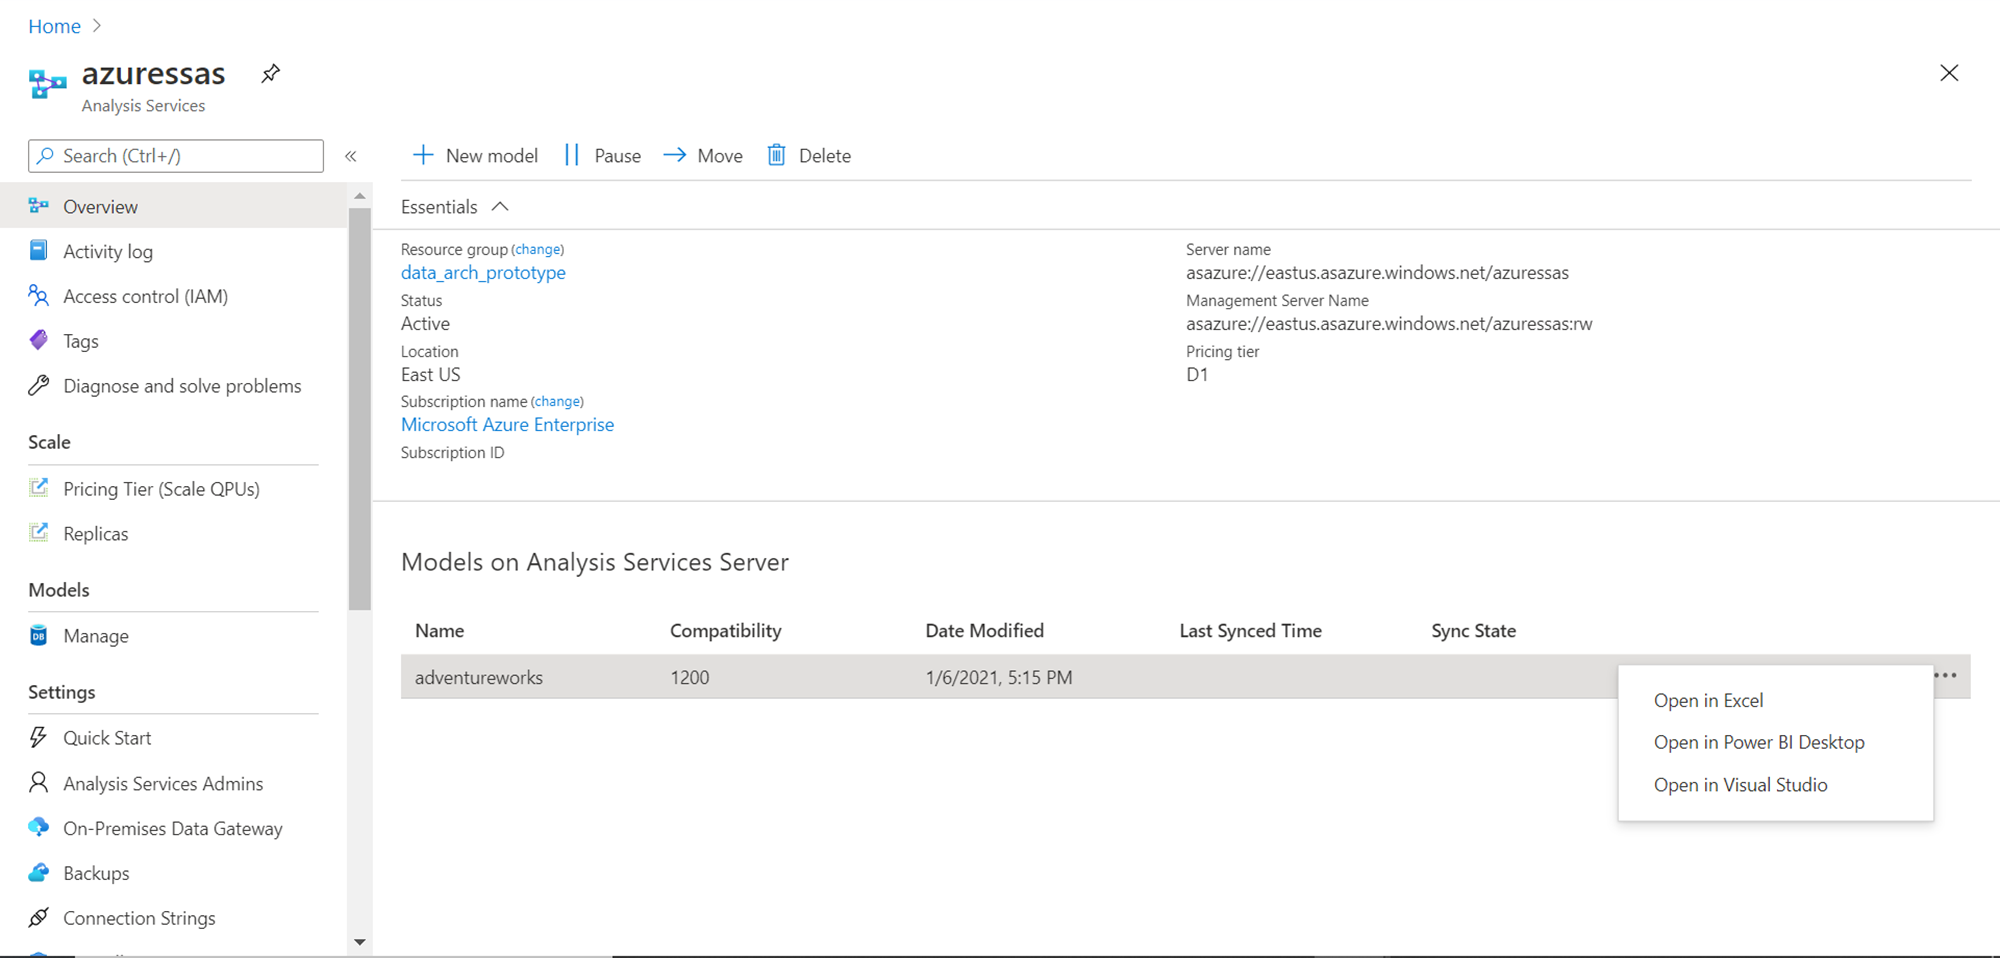
Now that our model is deployed and ready for consumption, we can start connecting and consuming this model using different tools. Azure Analysis Services provides an out-of-box option to consume the models using Microsoft Excel, Power BI and Visual Studio. Click on the ellipsis in the line item of the model at the right-end. When you click the ellipsis, it should show the three options as shown below – Open in Excel, Open in Power BI Desktop, and Open in Visual Studio.
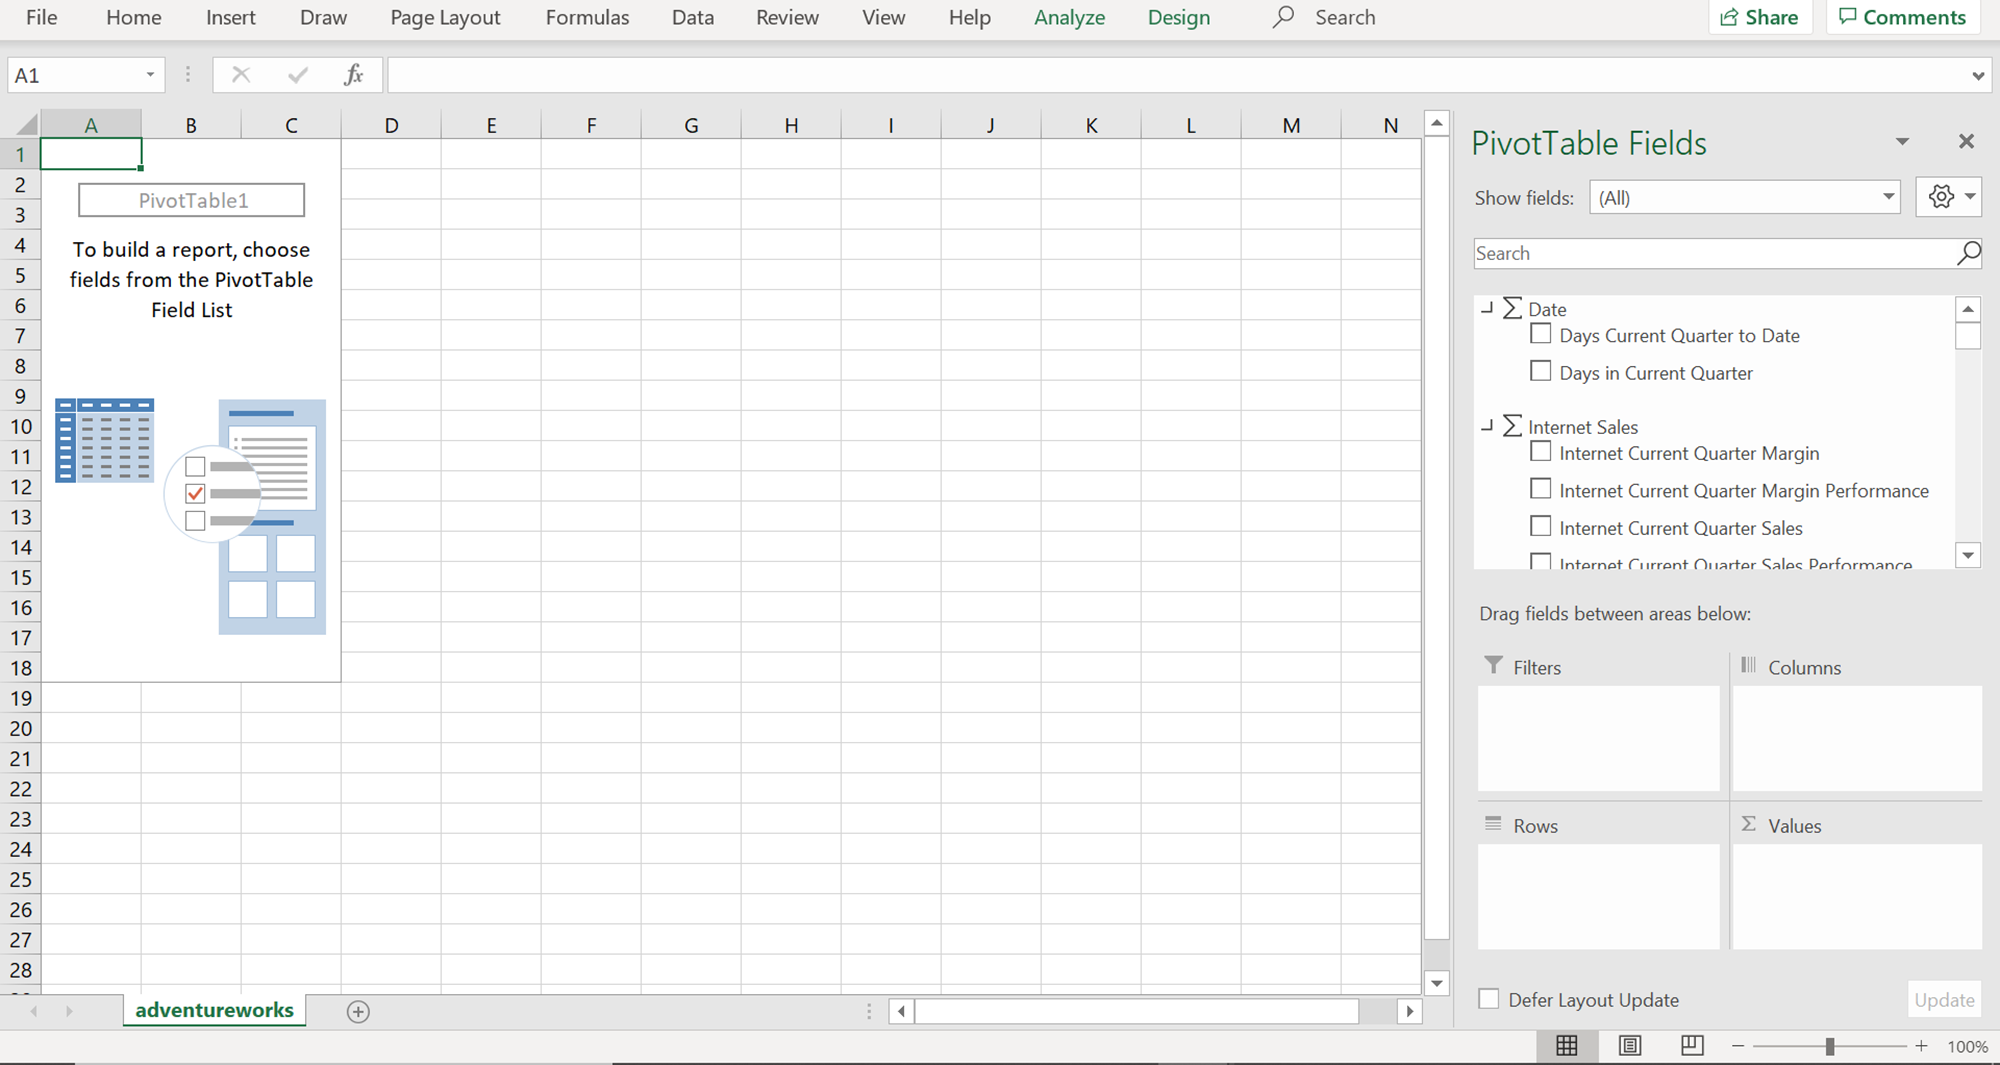
We would look at all these three options one by one. To get started with the first option – Open in Excel, click on this option and it would download an .odc excel file that already has a connection configured to connect with the Azure Analysis Services model that we just created. To access this file, Microsoft Excel would be required, and it’s assumed that Excel is already installed locally on the machine on which the file is being downloaded. Once the file gets downloaded, open the same and it would look as shown below. On the right-hand pane, we can see the collapsed list of measures.
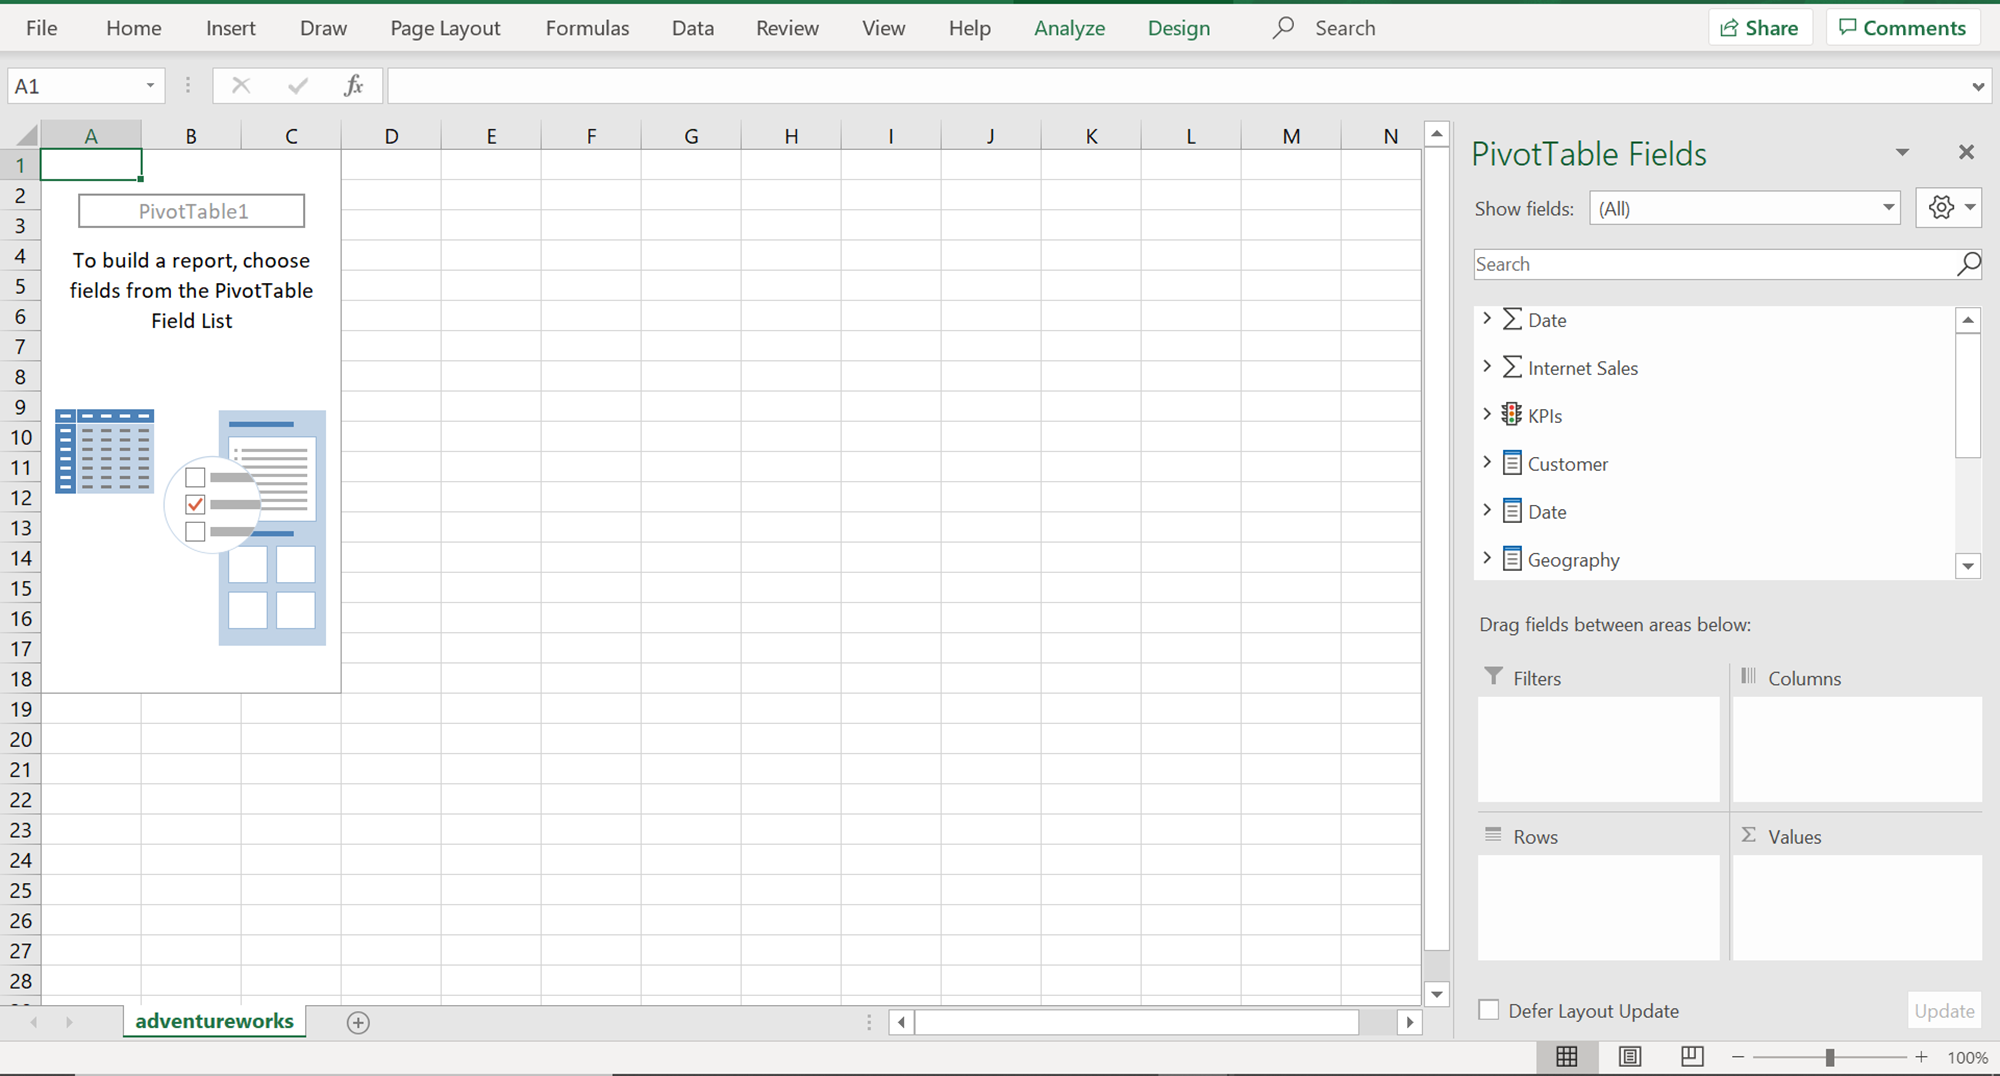
Expand this list and you would be able to see dimensions, measures, and KPIs as seen below. There are multiple dimensions like Customer, Date, Geography, Product, Product Category etc. The measures are Date and Internet Sales, and there’s a list of KPIs as well.
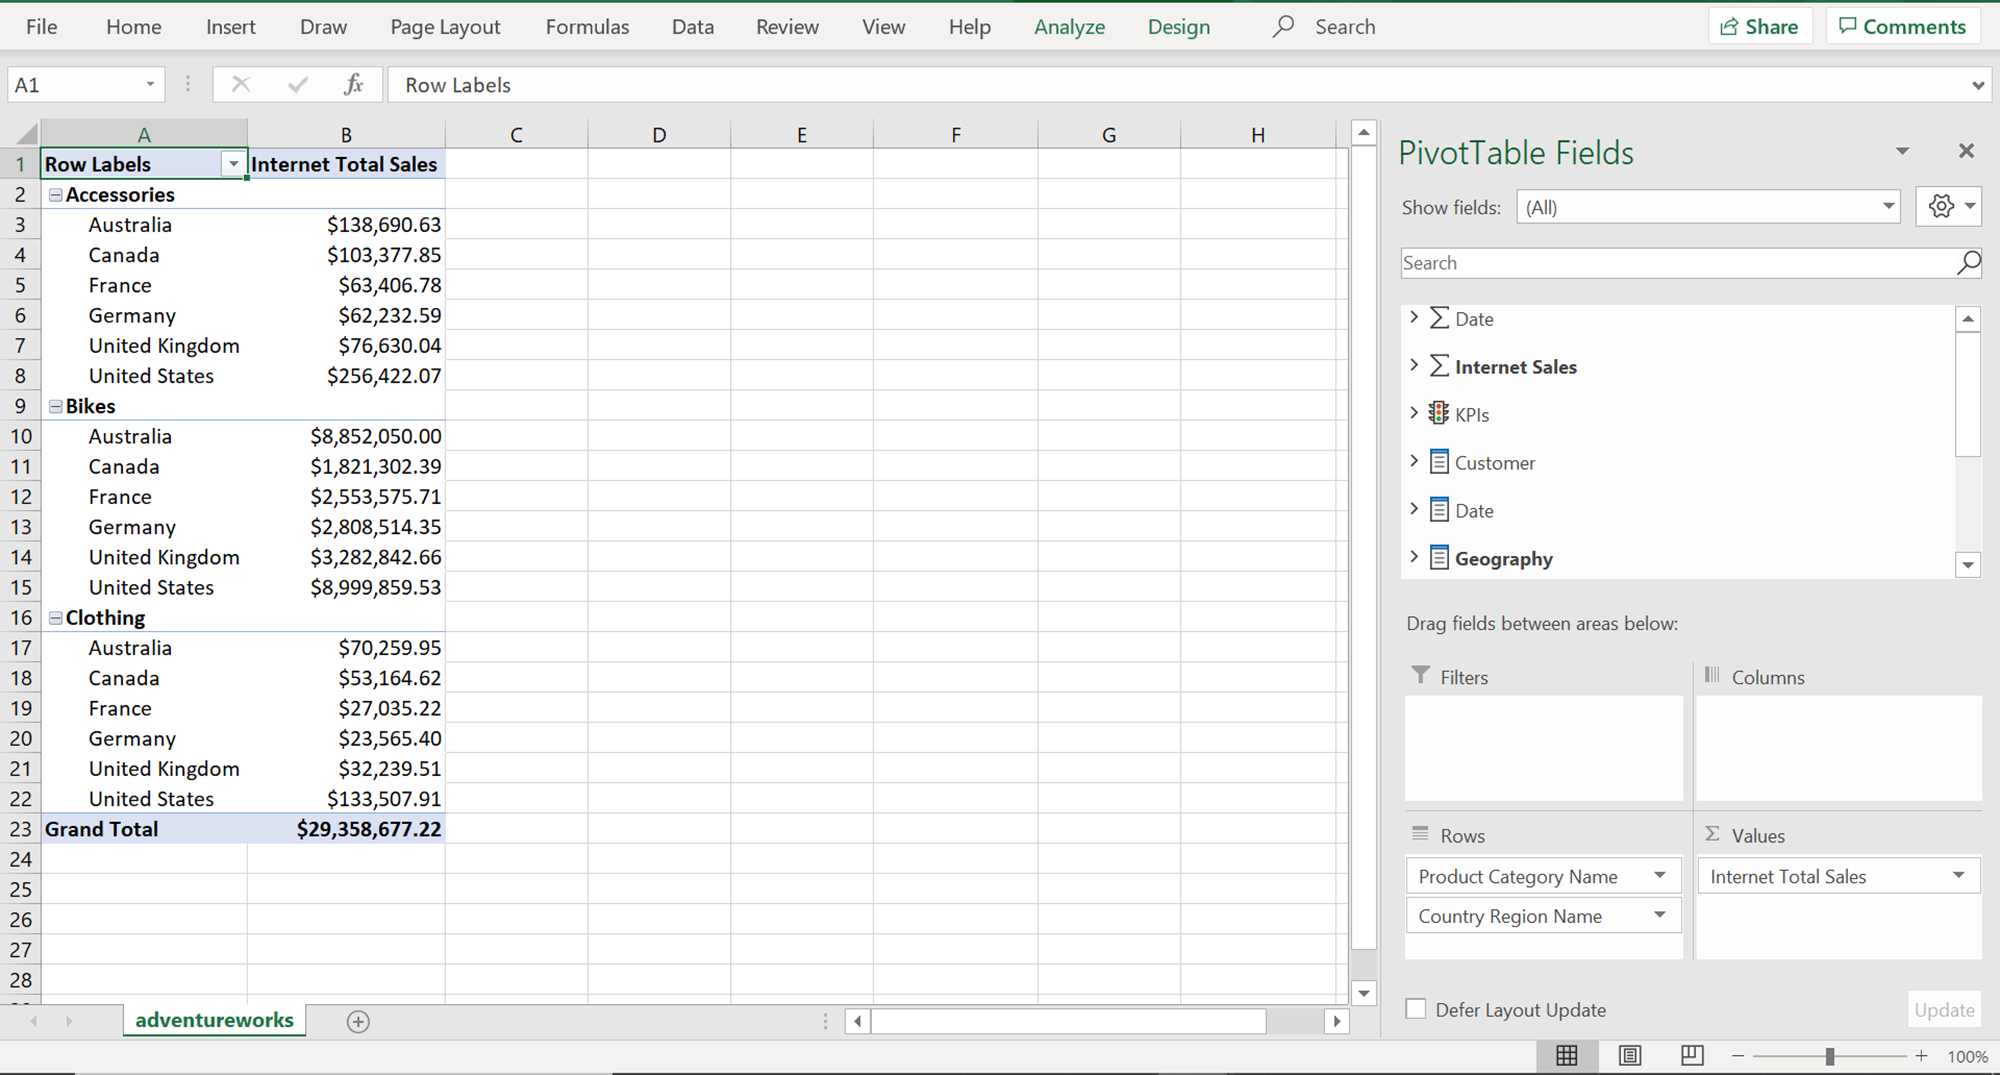
Let’s say we intend to create a report using these dimensions and measures, we can add few fields as shown below. We have added the Internet Total Sales measure to the values section, and added Product Category Name and Country Region Name to the Rows section, and the report on excel would look as shown below.
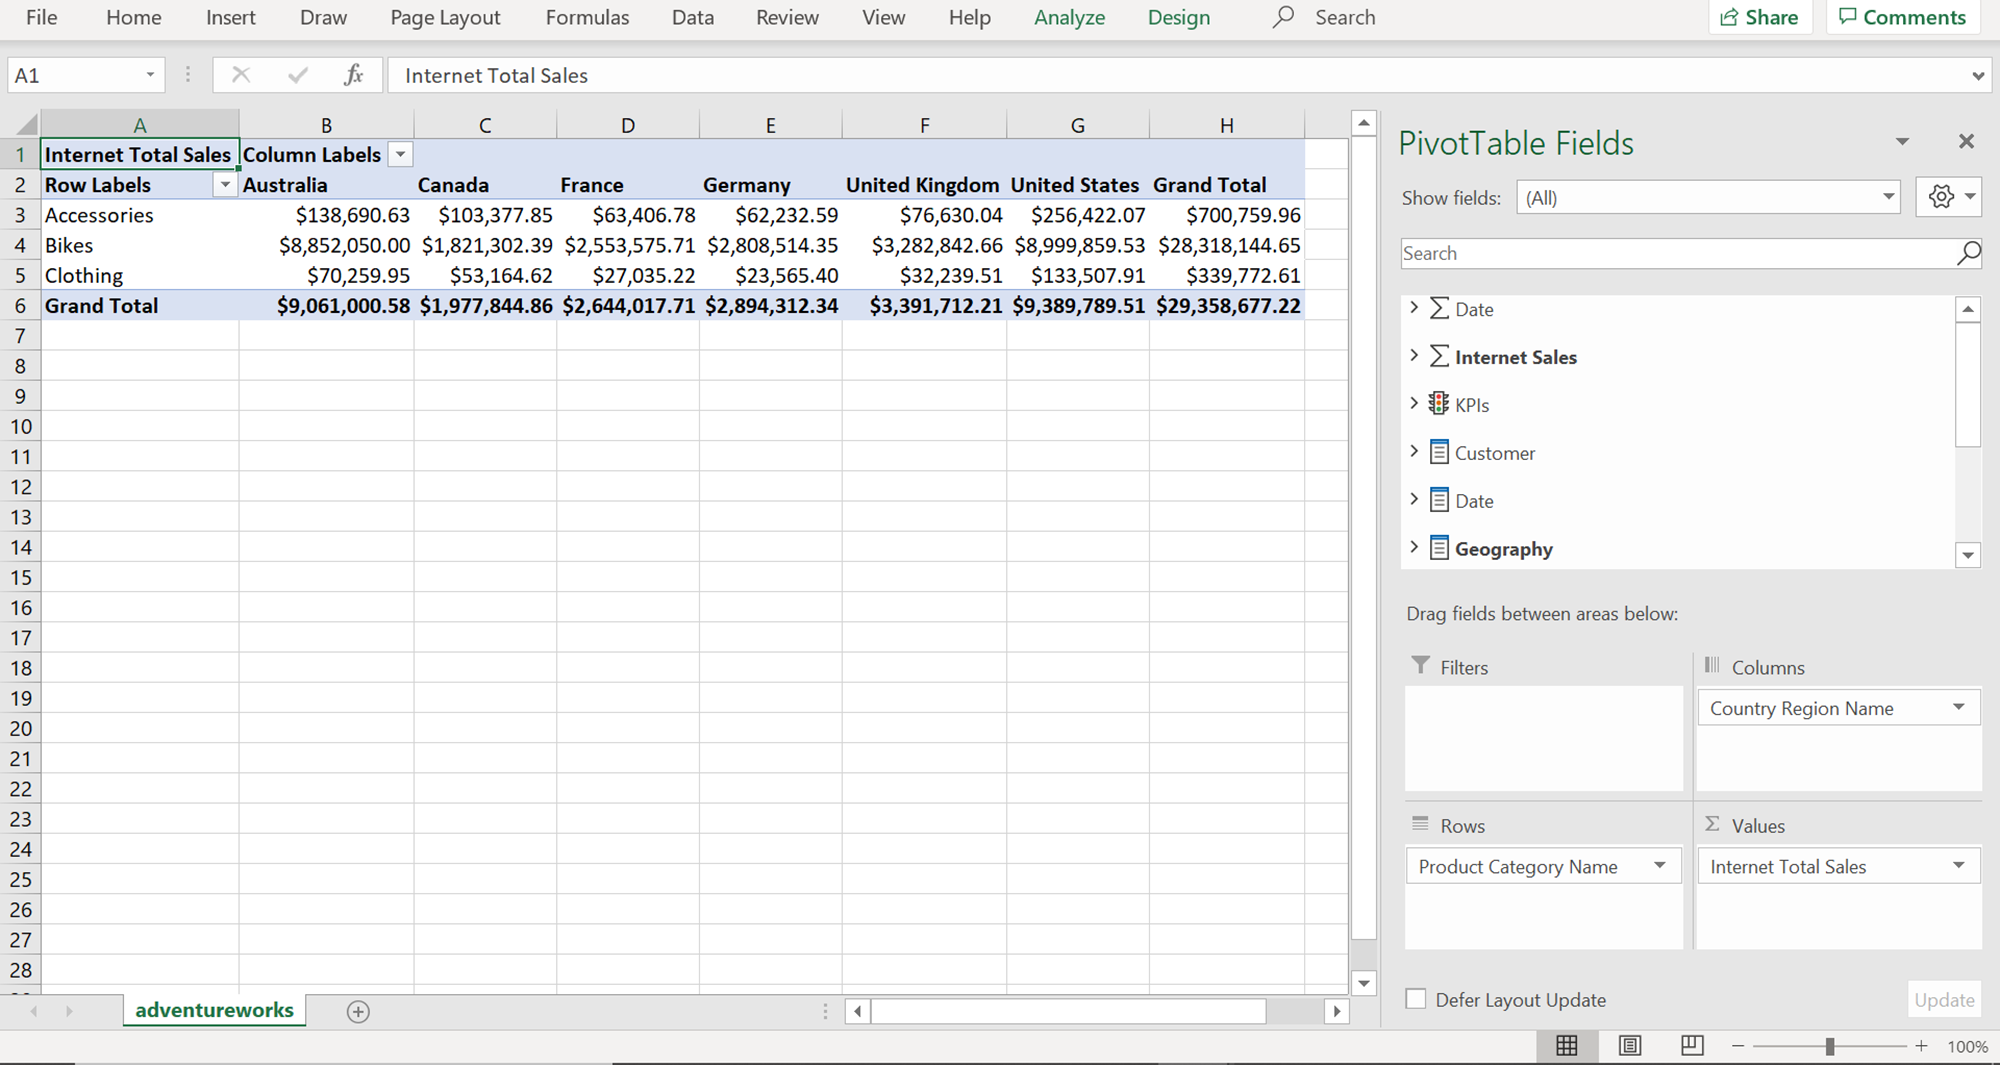
If we add more fields this list would get too long. Let’s say that we want to pivot the report column-wise, we can move the Country Region Name dimension to the Columns section, and the report would look as shown below. In this way, we can slice and dice data and analyze the data hosted in the Azure Analysis Services model using the features provided by Excel.
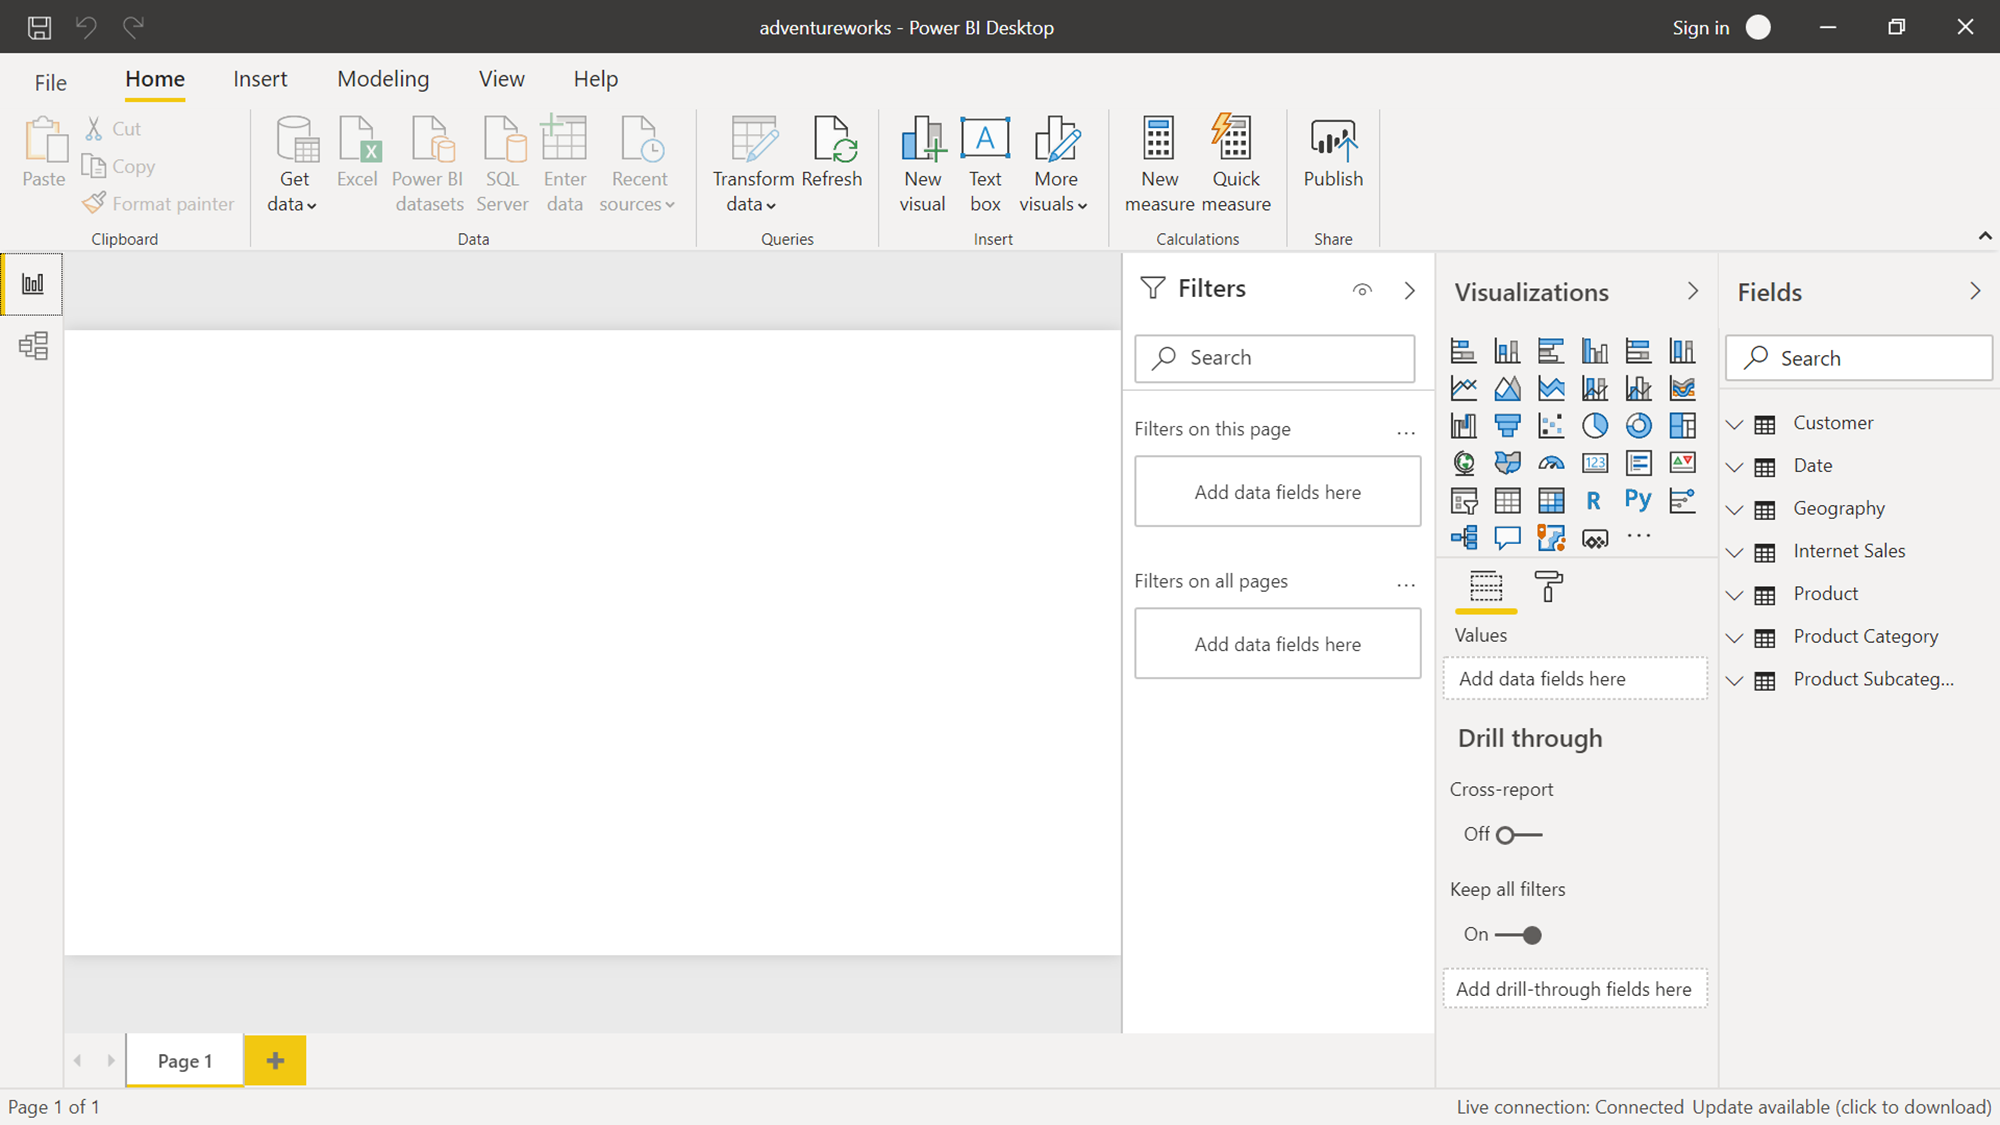
The next tool that can be used to analyze the model is Power BI Desktop, which is a very popular and frequently used tool for end-user reporting purposes. Make sure, the Power BI Desktop version is already installed on the development machine. Navigate to the Analysis Services Server dashboard page and using the same steps that we used to download the excel file, download the Power BI Desktop file this time. A file with the extension .pbix would get downloaded. Open the file and it would ask for your Azure account credentials to connect to the model as this file already has a built-in connection configured to connect to the model. Once you can successfully connect to the model from this Power BI document, it would look as shown below.
In the Fields pane, you would be able to find the same set of dimensions, measures and KPIs that we saw earlier while consuming this model from Excel.
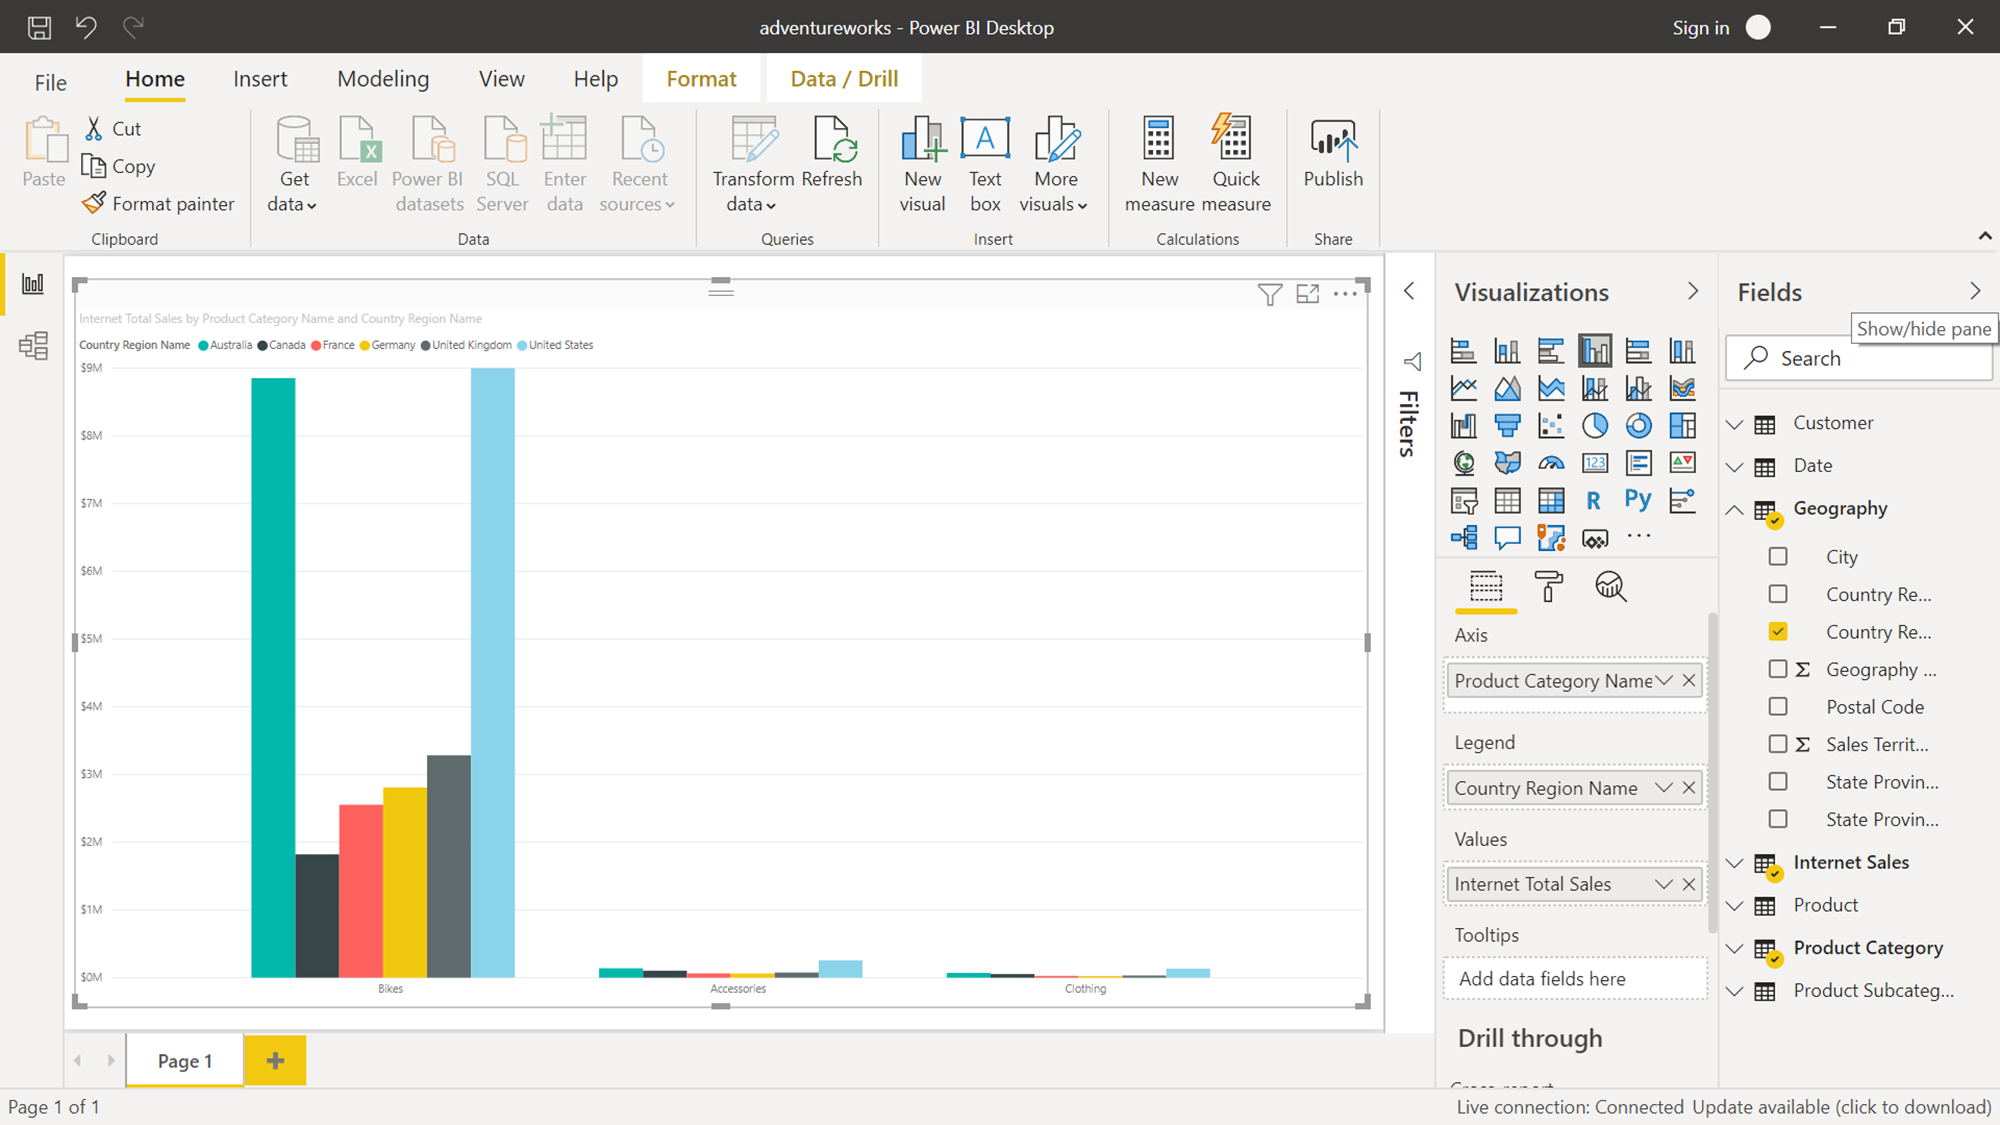
Let’s say we want to create the same report that we created earlier using Excel. Select the same set of fields and the report would look as shown below. We have added the Product Category Name attribute in the Axis section, Country Region Name attribute in the Legend section, and Internet Total Sales measure in the values section.
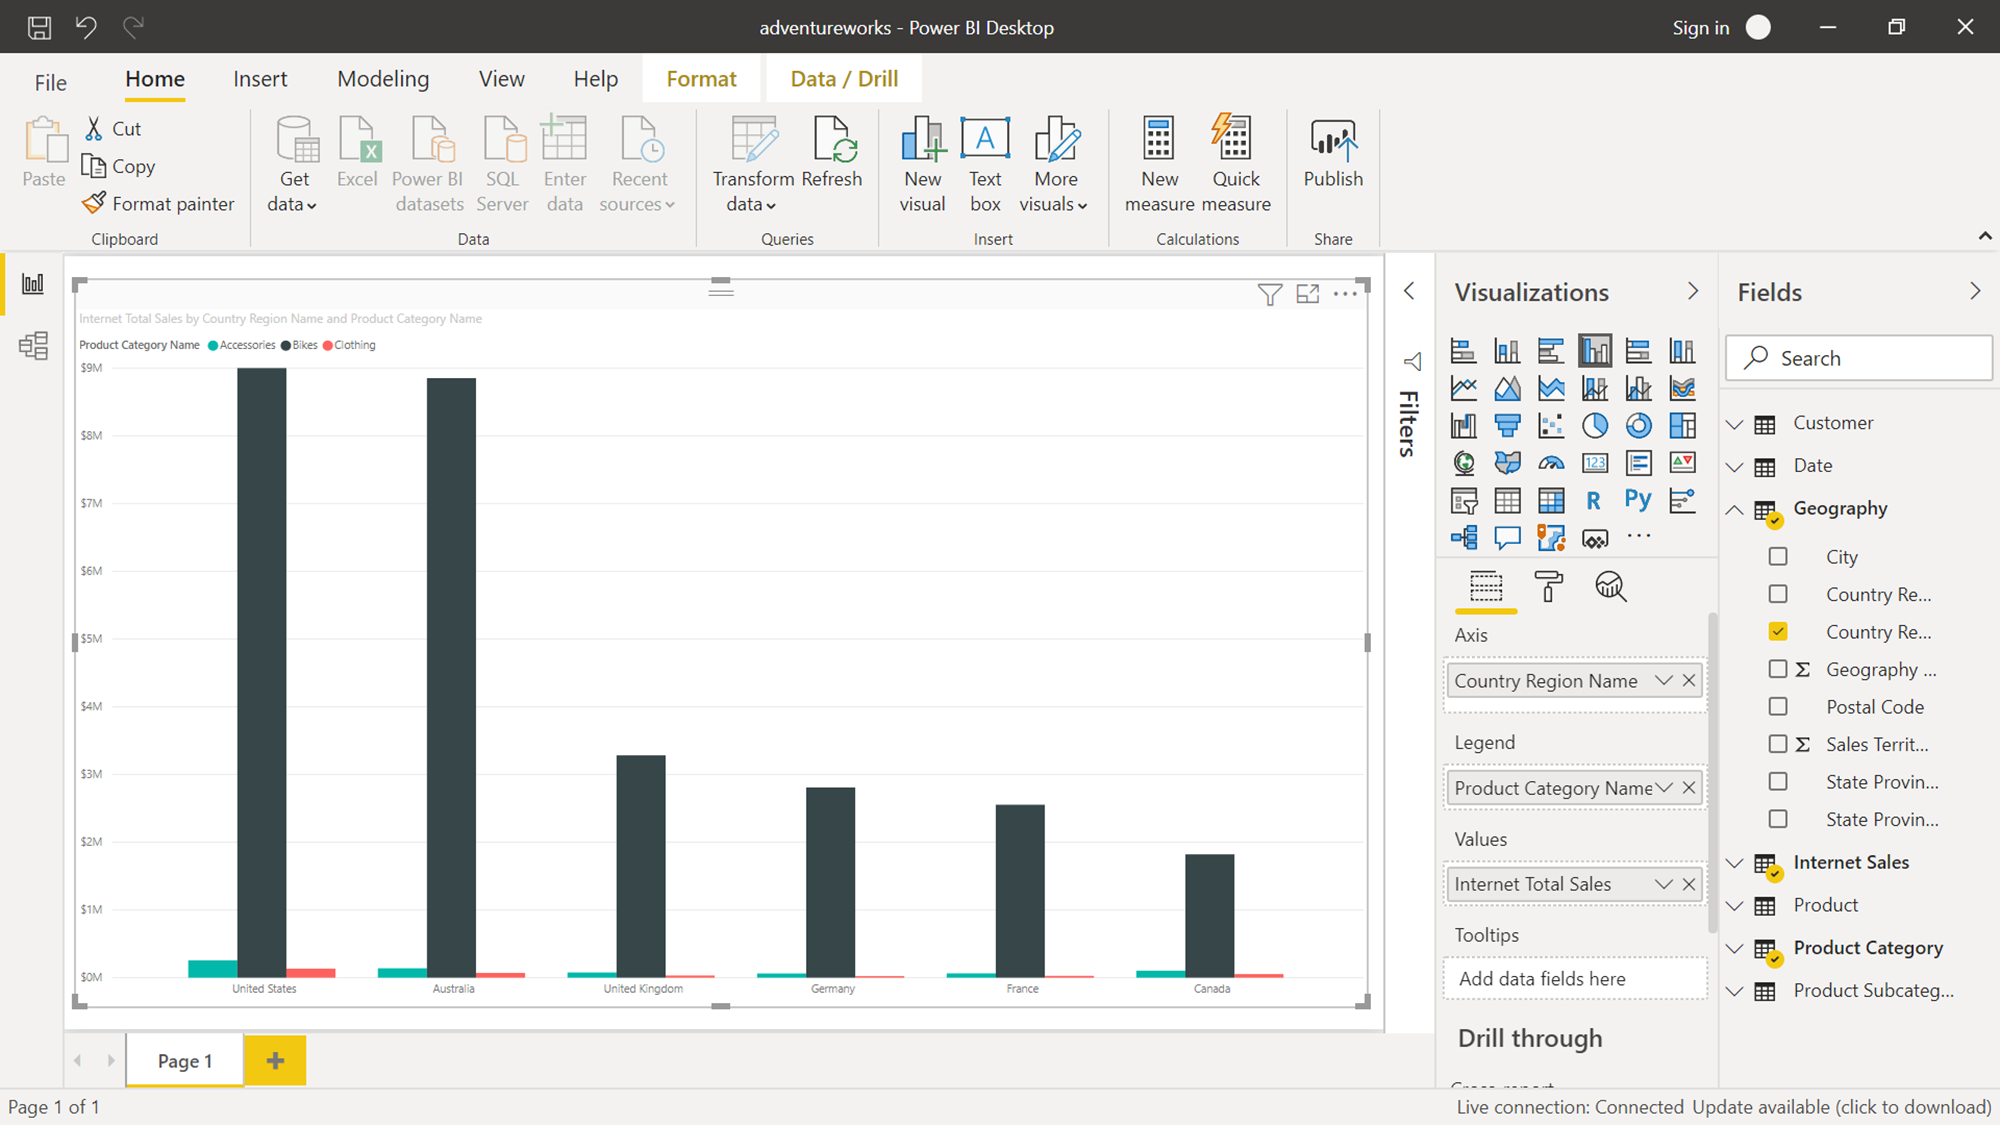
If we want to pivot this report to show the Internet Sales of products by Country, we can swap the dimension attributes in Axis and Legend section and it would look as shown below. The same type of level of exploration that can be done in excel can also be done in Power BI Desktop. Power BI is a rich visual exploration and reporting tool whereas Excel is a local file-based data analysis tool that is often used by business analysts.
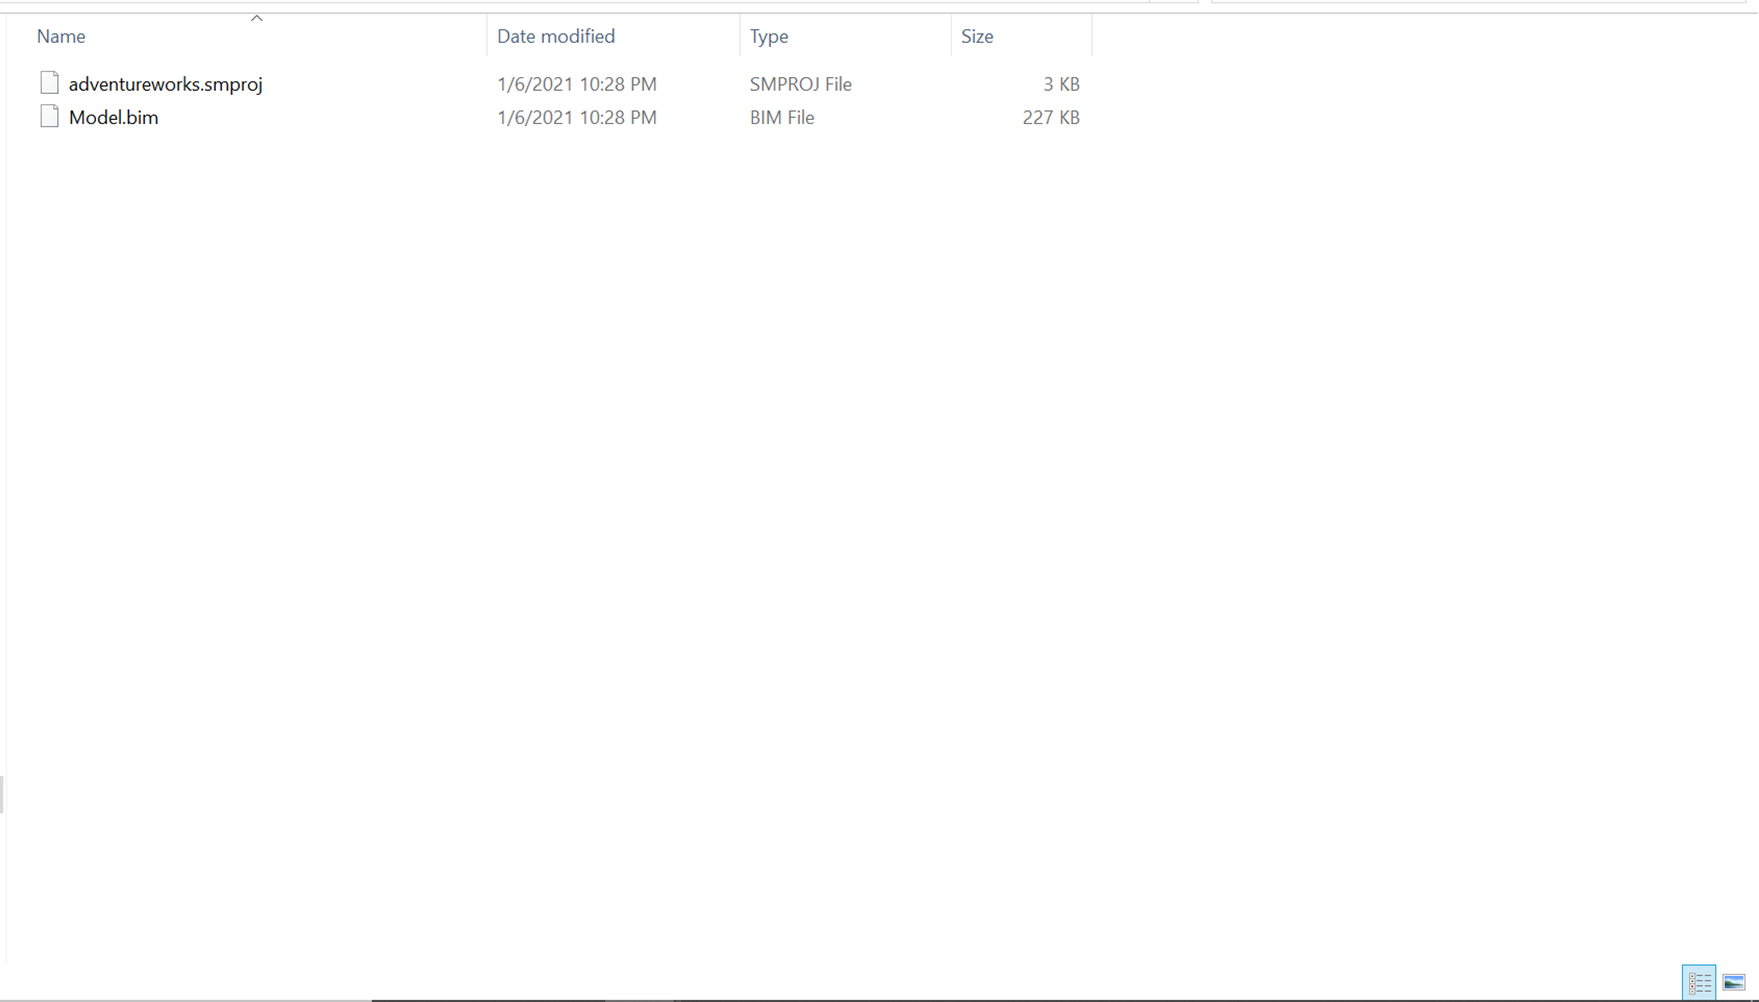
Now that we have learned how to use Excel and Power BI Desktop to explore the Azure Analysis Services model, we can look at how to use Visual Studio. One point to keep in view is that Visual Studio is neither a data exploration nor a reporting tool. It’s is a development IDE often used by developers to develop SSAS projects and models, and other types of projects supported by it. Follow the steps that we followed to download excel and Power BI Desktop files, and this time download the Visual Studio file. It will download a zip file on the local machine, which we need to unzip. Once done, it would contain two files as shown below. One is a smproj extension file which is a project file and another one is a .bim file which is the actual model file.
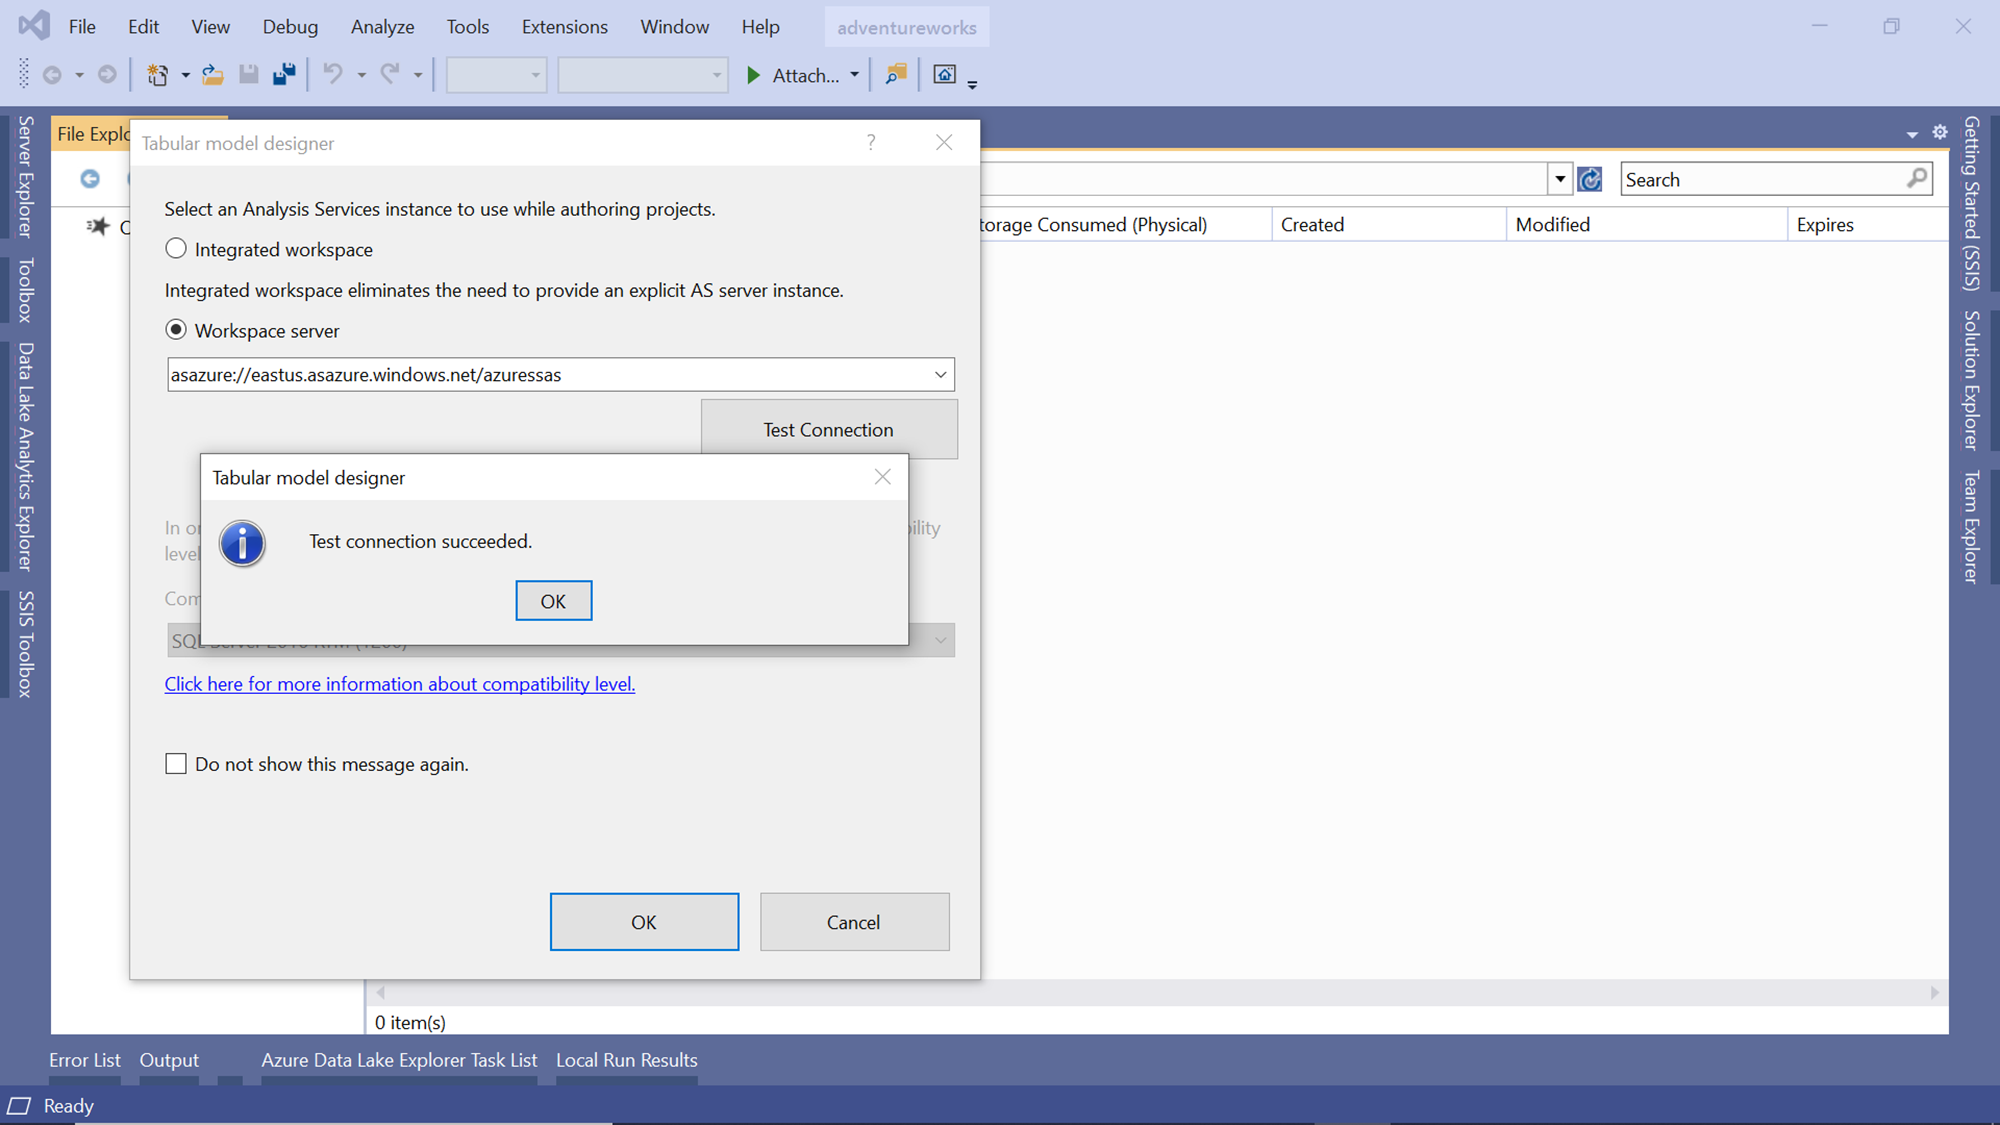
To open this file, one would need Visual Studio installed on the local machine with the Analysis Services pack already installed, which allows accessing these types of files. Assuming Visual Studio is installed, open it and try to open the smproj file. It would ask for the details of the workspace server. You can use a local integrated workspace or mention the address of the Azure Analysis Services server and test the connection. Once the connection is successful, it would look as shown below.
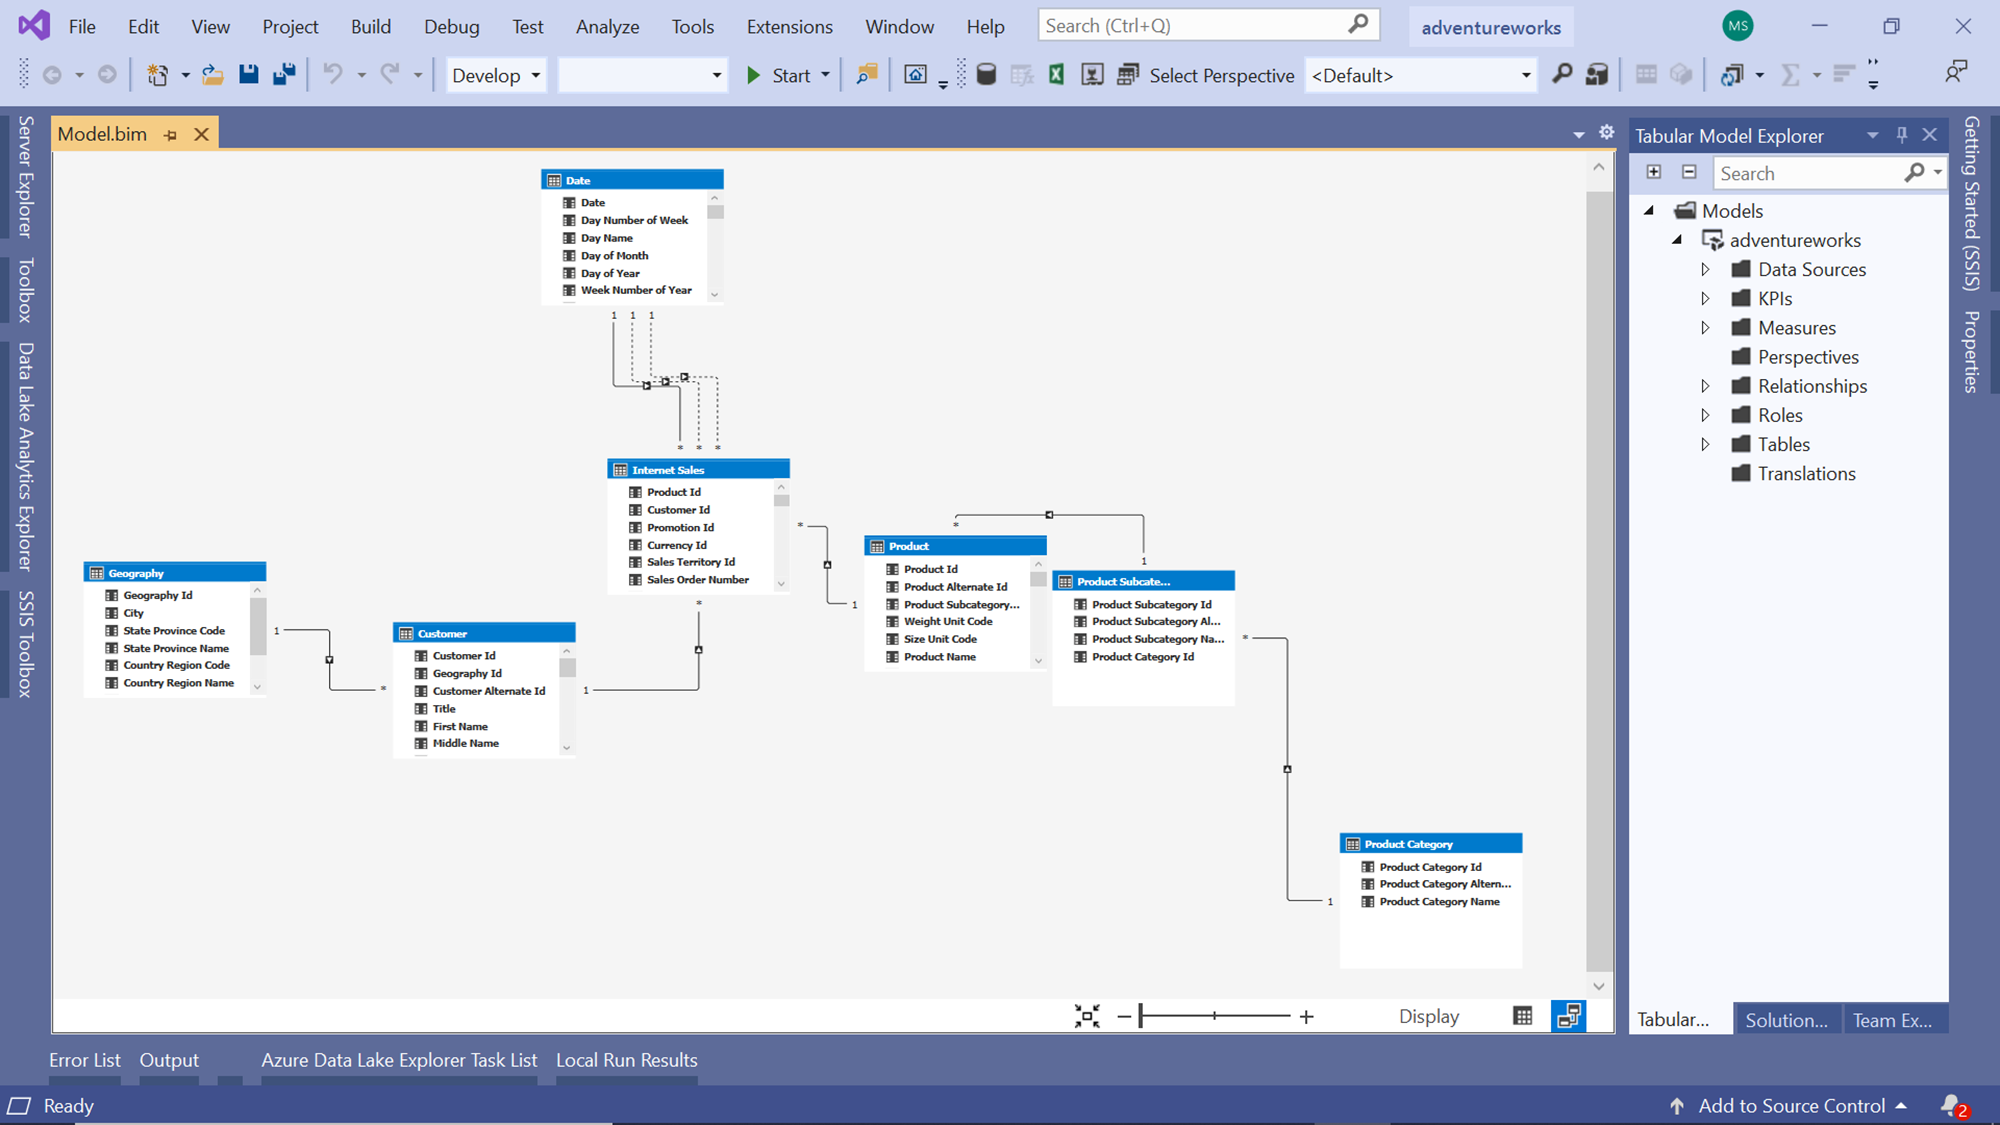
Once the project opens, from the solution explorer window, open the model file in diagram view and it would look as shown below. One can easily navigate the model and explore the attributes and schema from this view. This is particularly useful when analyzing a model that one has not developed, but want to investigate in an ad-hoc manner for occasional use.
In this way, we can use the options provided natively from Azure Analysis Services to create ready-to-use files that can be operated from different consumption and development tools.
Conclusion
In this article, we started with an existing setup of the Azure Analysis Services server and learned how to deploy a new model. Once the model was deployed, we learned how to create ready to use Excel, Power BI Desktop and Visual Studio files for data as well as schema exploration.

She has a deep experience in designing data and analytics solutions and ensuring its stability, reliability, and performance. She is also certified in SQL Server and have passed certifications like 70-463: Implementing Data Warehouses with Microsoft SQL Server.
View all posts by Gauri Mahajan
- Oracle Substring function overview with examples - June 19, 2024
- Introduction to the SQL Standard Deviation function - April 21, 2023
- A quick overview of MySQL foreign key with examples - February 7, 2023