

In this article, we are going to explore how to embed Power BI reports in Jupyter notebooks. Power BI is one of the most popular data visualization tools in the market that is being heavily used by Data Analysts to visualize existing data and to discover patterns lying in the data. Power BI provides a desktop application to author the reports and it can be deployed to the Power BI Service and consumed by users using a web browser.
Jupyter Notebooks is a code-based notebook platform that is used by Data Scientists to analyze data in a step-by-step process-based manner and build machine learning models based on the analyzed data. Jupyter Notebooks make data analysis a lot easier as it enables users to execute snippets of code in cells. These cells are executed individually, and the results can be used in another cell within the notebook. Power BI provides an enhanced feature to embed live reports into websites and notebooks using the Power BI Embedded functionality. We will learn more about it in the next sections.
Creating the Power BI Report
Power BI Embedded Reporting is a feature of the Power BI cloud service that enables customers to embed their Power BI reports and dashboards. Now that we have some idea about what Power BI is, let us start by creating a report from scratch and then deploying it to the Power BI service, from where it can be embedded in a Jupyter Notebook. For the purpose of this tutorial, I am going to use the WideWorldImportersDW database. You can download it from the official GitHub page. Once the database backup is downloaded, the next step is to restore it to the SQL Server. You should now be able to browse the database objects as below.
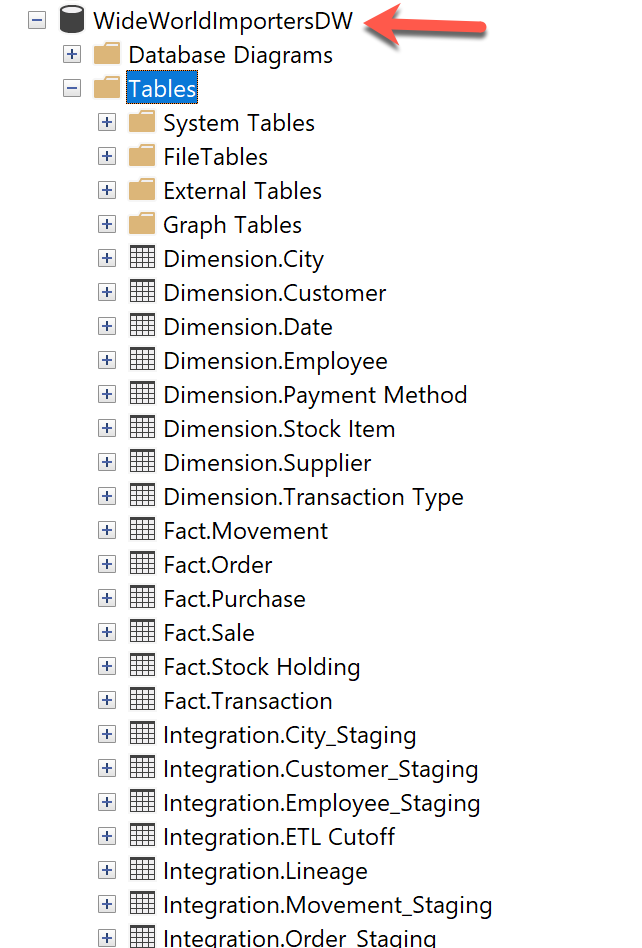
Figure 1 – WideWorldImportersDW database imported and restored to SQL Server
Now, the next step is to open the Power BI Desktop and connect to this database and fetch the tables. We are going to create a report in Power BI using the tables from the WideWorldImportersDW database. To keep things simple, I am going to import only the following three tables in the Power BI report.
- Dimension.Customer
- Dimension.StockItem
- Fact.Order
It might take some time depending on the number of records that are being imported into the Power BI report.
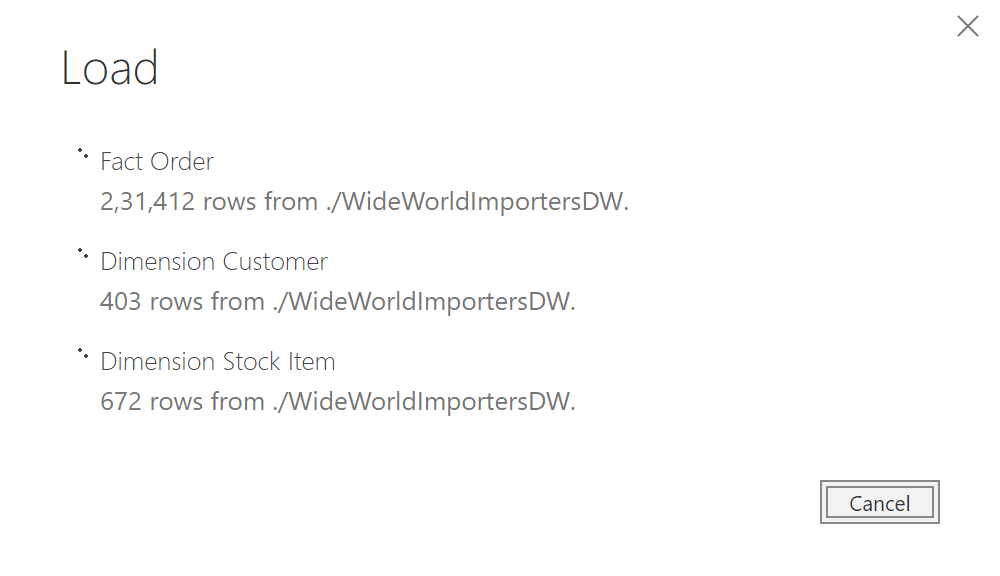
Figure 2 – Importing records from SQL Server Database
Once all the rows are imported into the Power BI report, the next step is to build some visualizations using the data. Here, you can choose your own visualization as well, however, I am going to create very simple charts that can be used for embedding in the Jupyter Notebook.
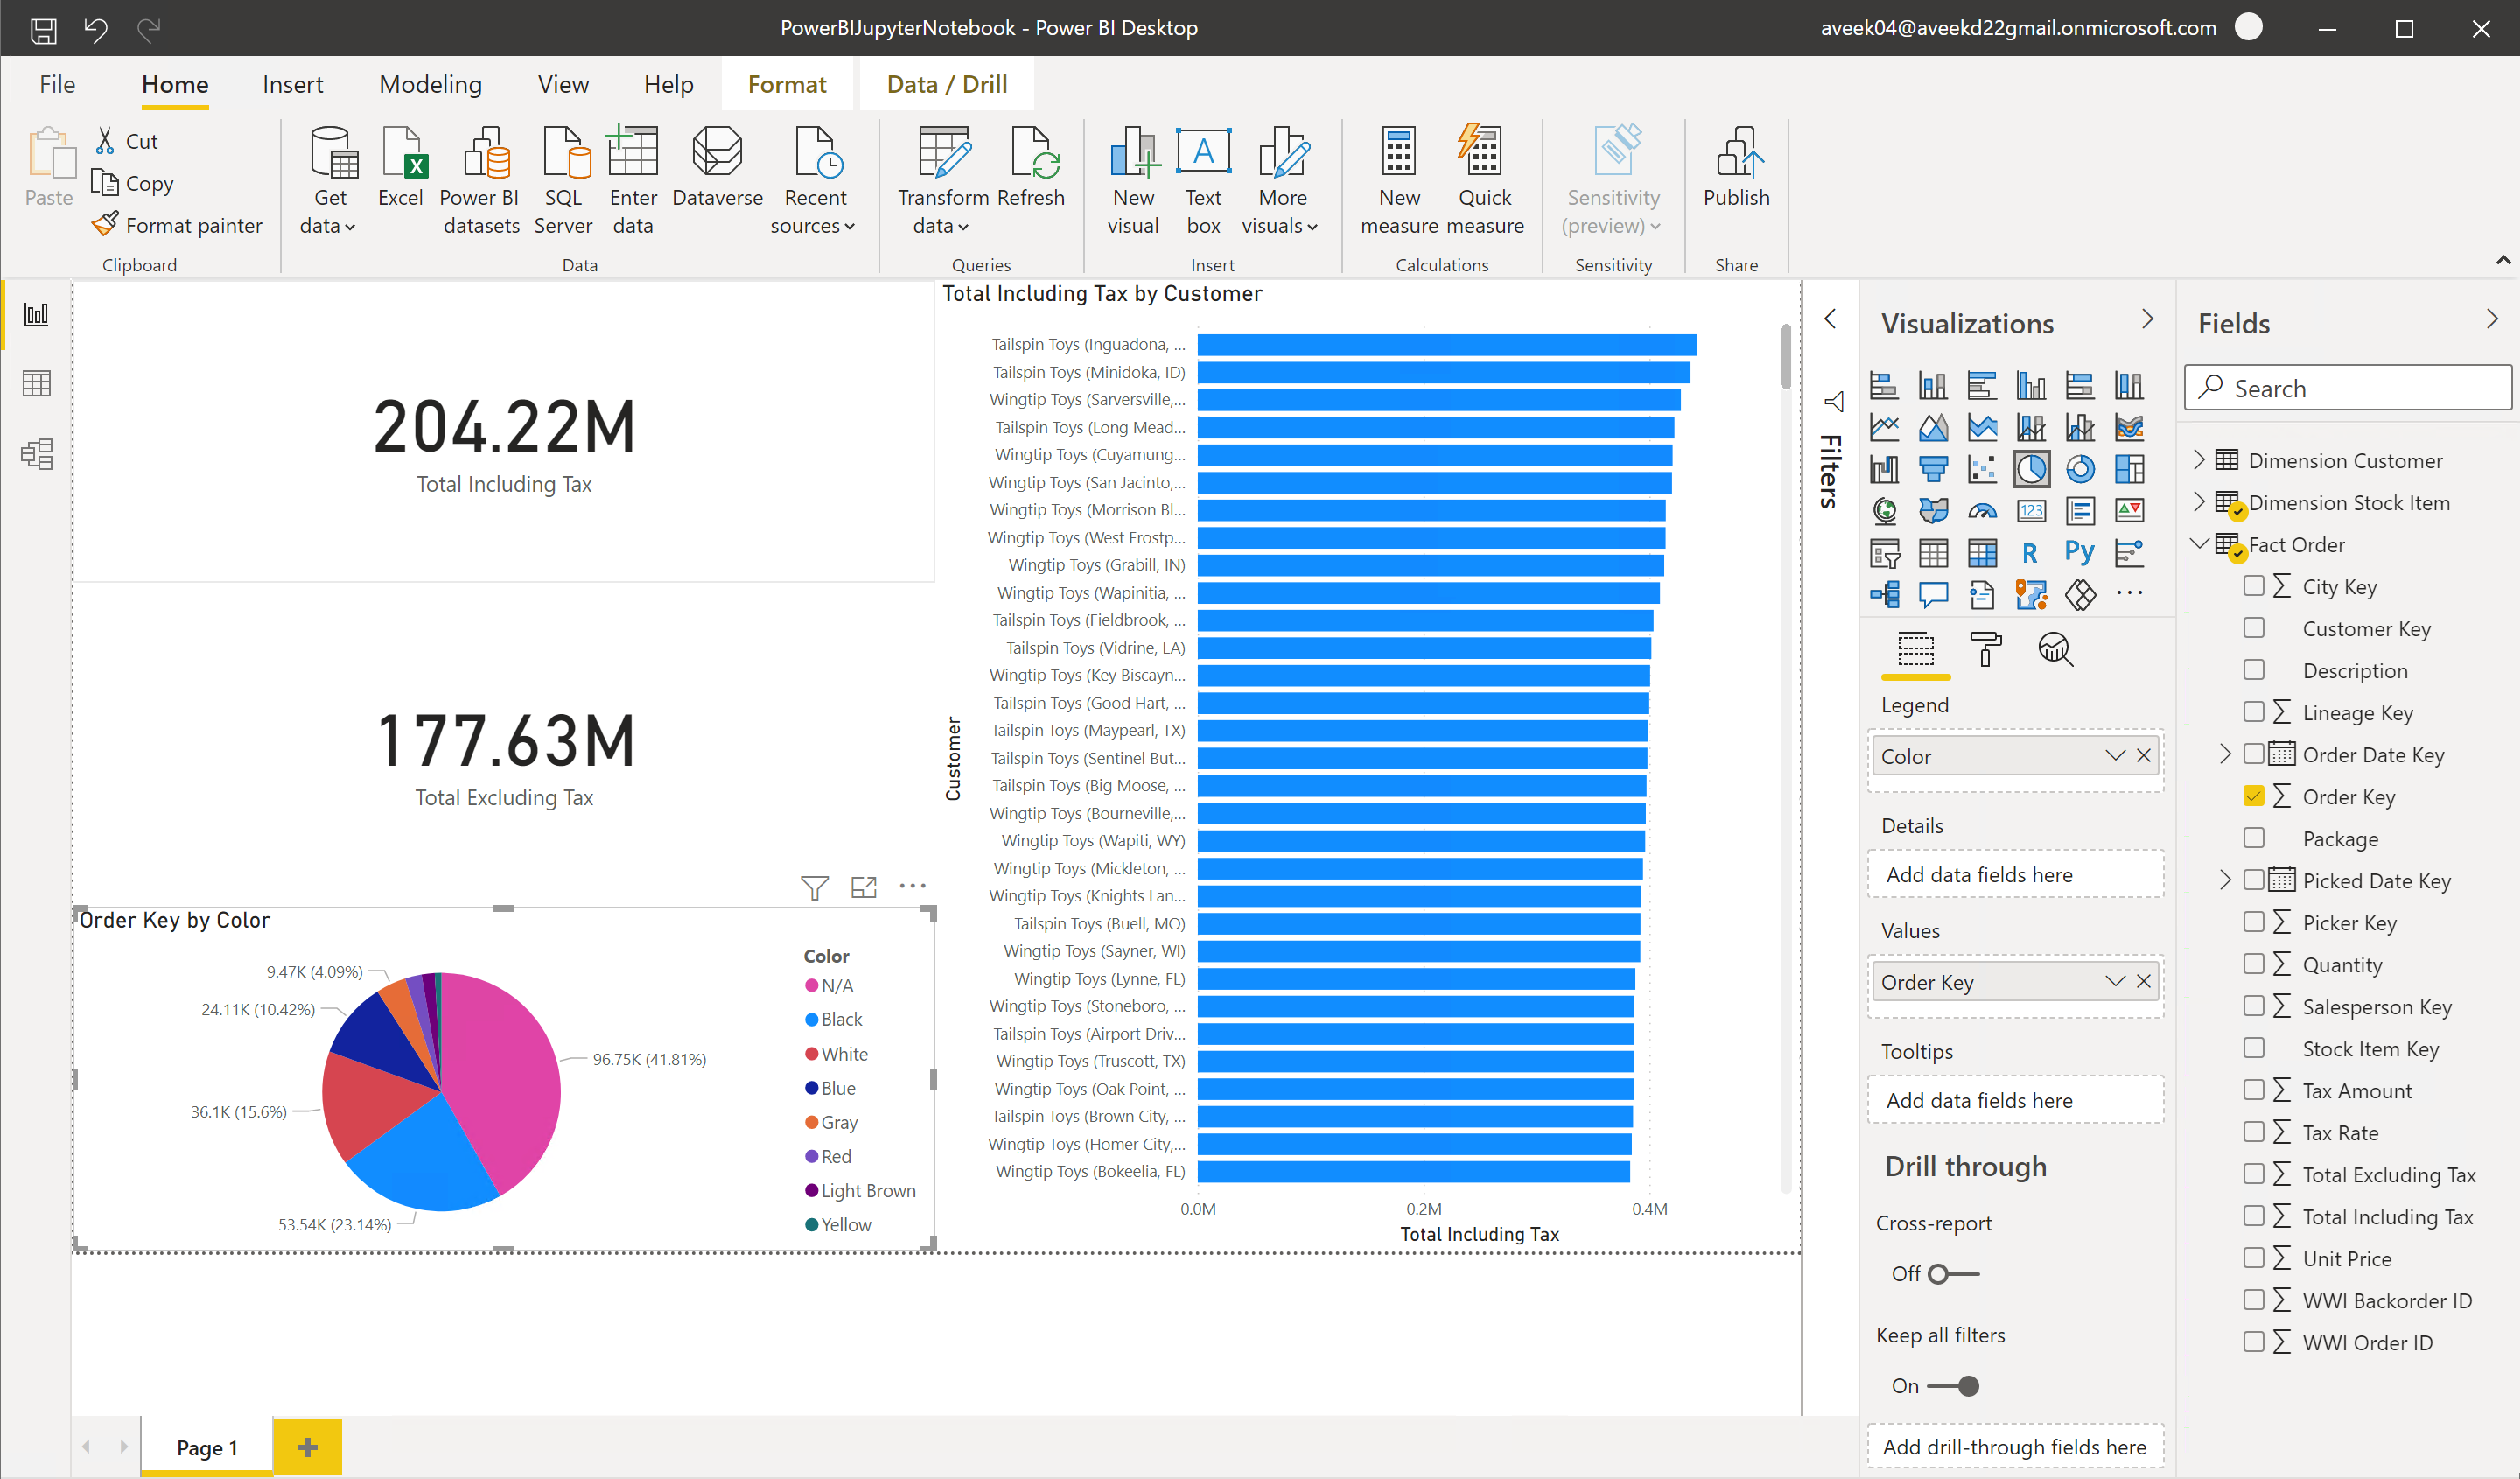
Figure 3 – Building the Power BI Report from scratch using the WideWorldImportersDW Database
As you can see in the figure above, the report has been created by using the fields from the tables that we have imported in the previous step. Once the report is created, save it to your local and then publish it to the Power BI service. You can do that by signing into the Power BI account and then selecting the Publish option.
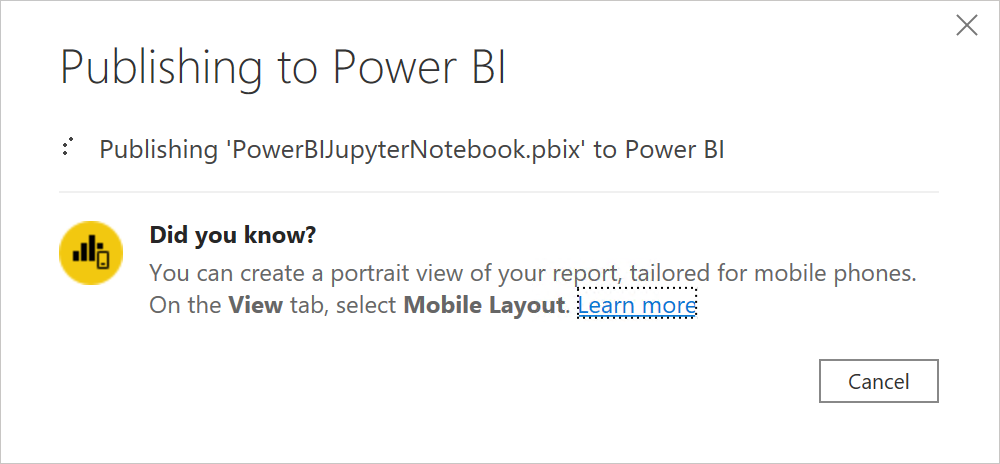
Figure 4 – Publishing the report to Power BI Service
As you can see above, I have published the Power BI Report into the Power BI Service. Please note that I have published the report into a named workspace in the account as I am using Power BI Pro. Once the report is published, you can verify it by navigating to https://app.powerbi.com and browsing the workspace under which the report has been published.
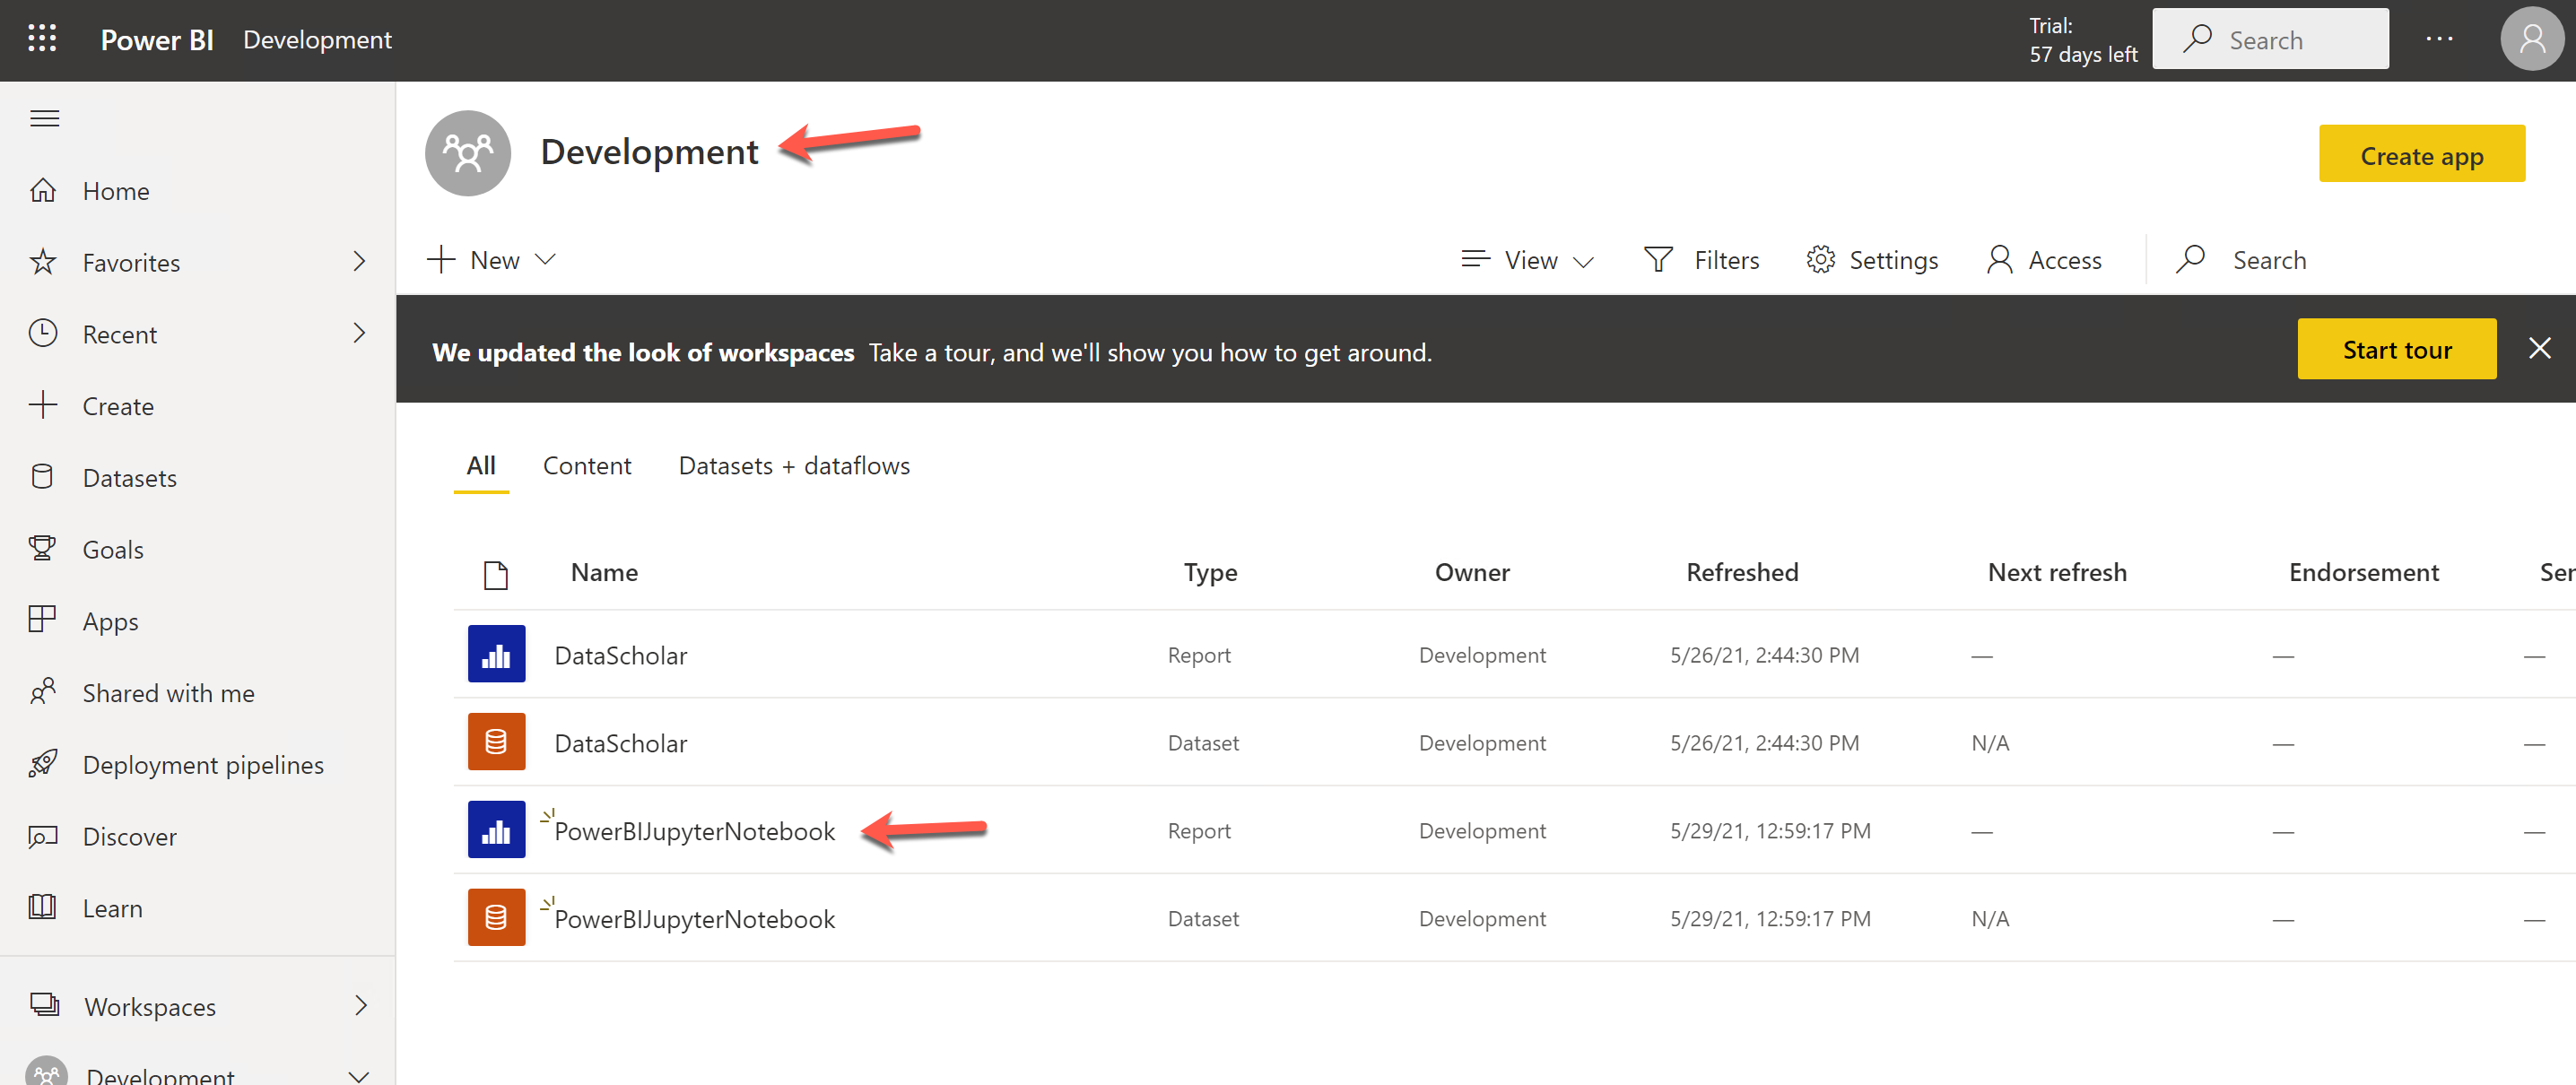
Figure 5 – Browsing the report on Power BI Service
As seen in the above figure, the report has been published under the Development workspace. Now, we can open the report on the portal and get the GroupID and the ReportID from the URL.
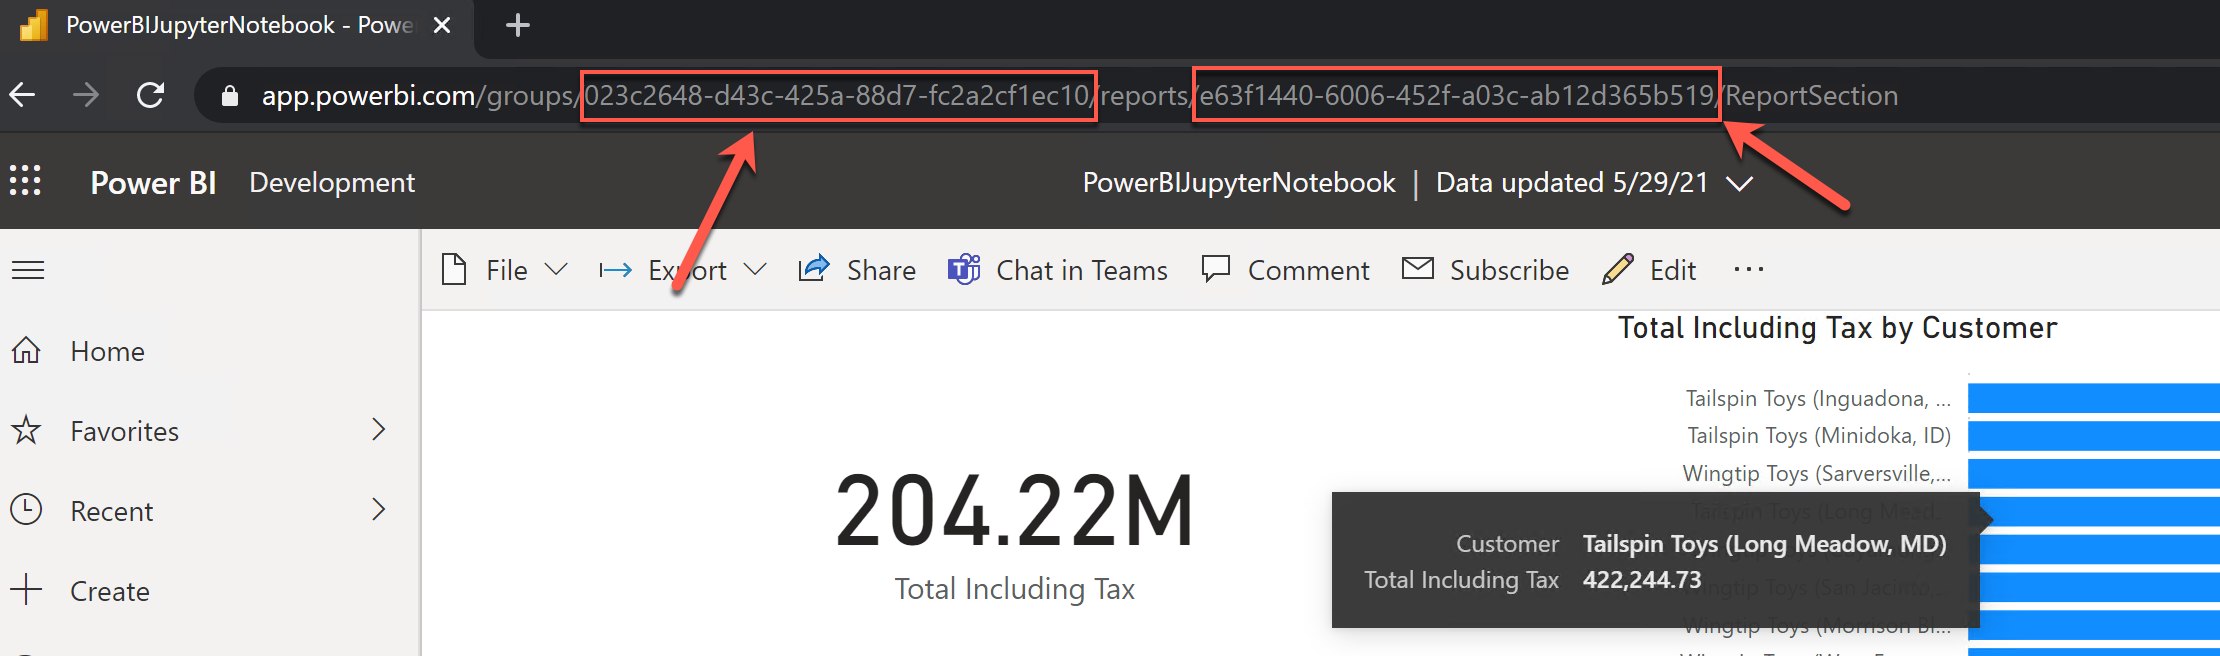
Figure 6 – Extracting the GroupID and ReportID from the URL
From the URL, we are going to extract the following UUIDs for future references:
- GroupID – 023c2648-d43c-425a-88d7-fc2a2cf1ec10
- ReportID – e63f1440-6006-452f-a03c-ab12d365b519
Starting the Jupyter Lab or Notebook
So far, we have created the Power BI report and published it to the Power BI Service on the cloud. The next step here is to start the Jupyter Notebooks running on the machine and then embed the report that we have published. In order to start Jupyter Notebook, you can use the following command to download it from the Python Library. Jupyter Notebook is an old version of Jupyter Lab. For this tutorial, we are going to use JupyterLab directly. You can use the following command to install it on your machine.
|
1 |
pip install jupyterlab |
This command will download and install the Jupyter Notebook to your machine. Once it is installed, you can simply start the service by running the following command from the terminal.
|
1 |
jupyter-lab |
This will redirect you to a web browser and open the Jupyter Lab window for you.
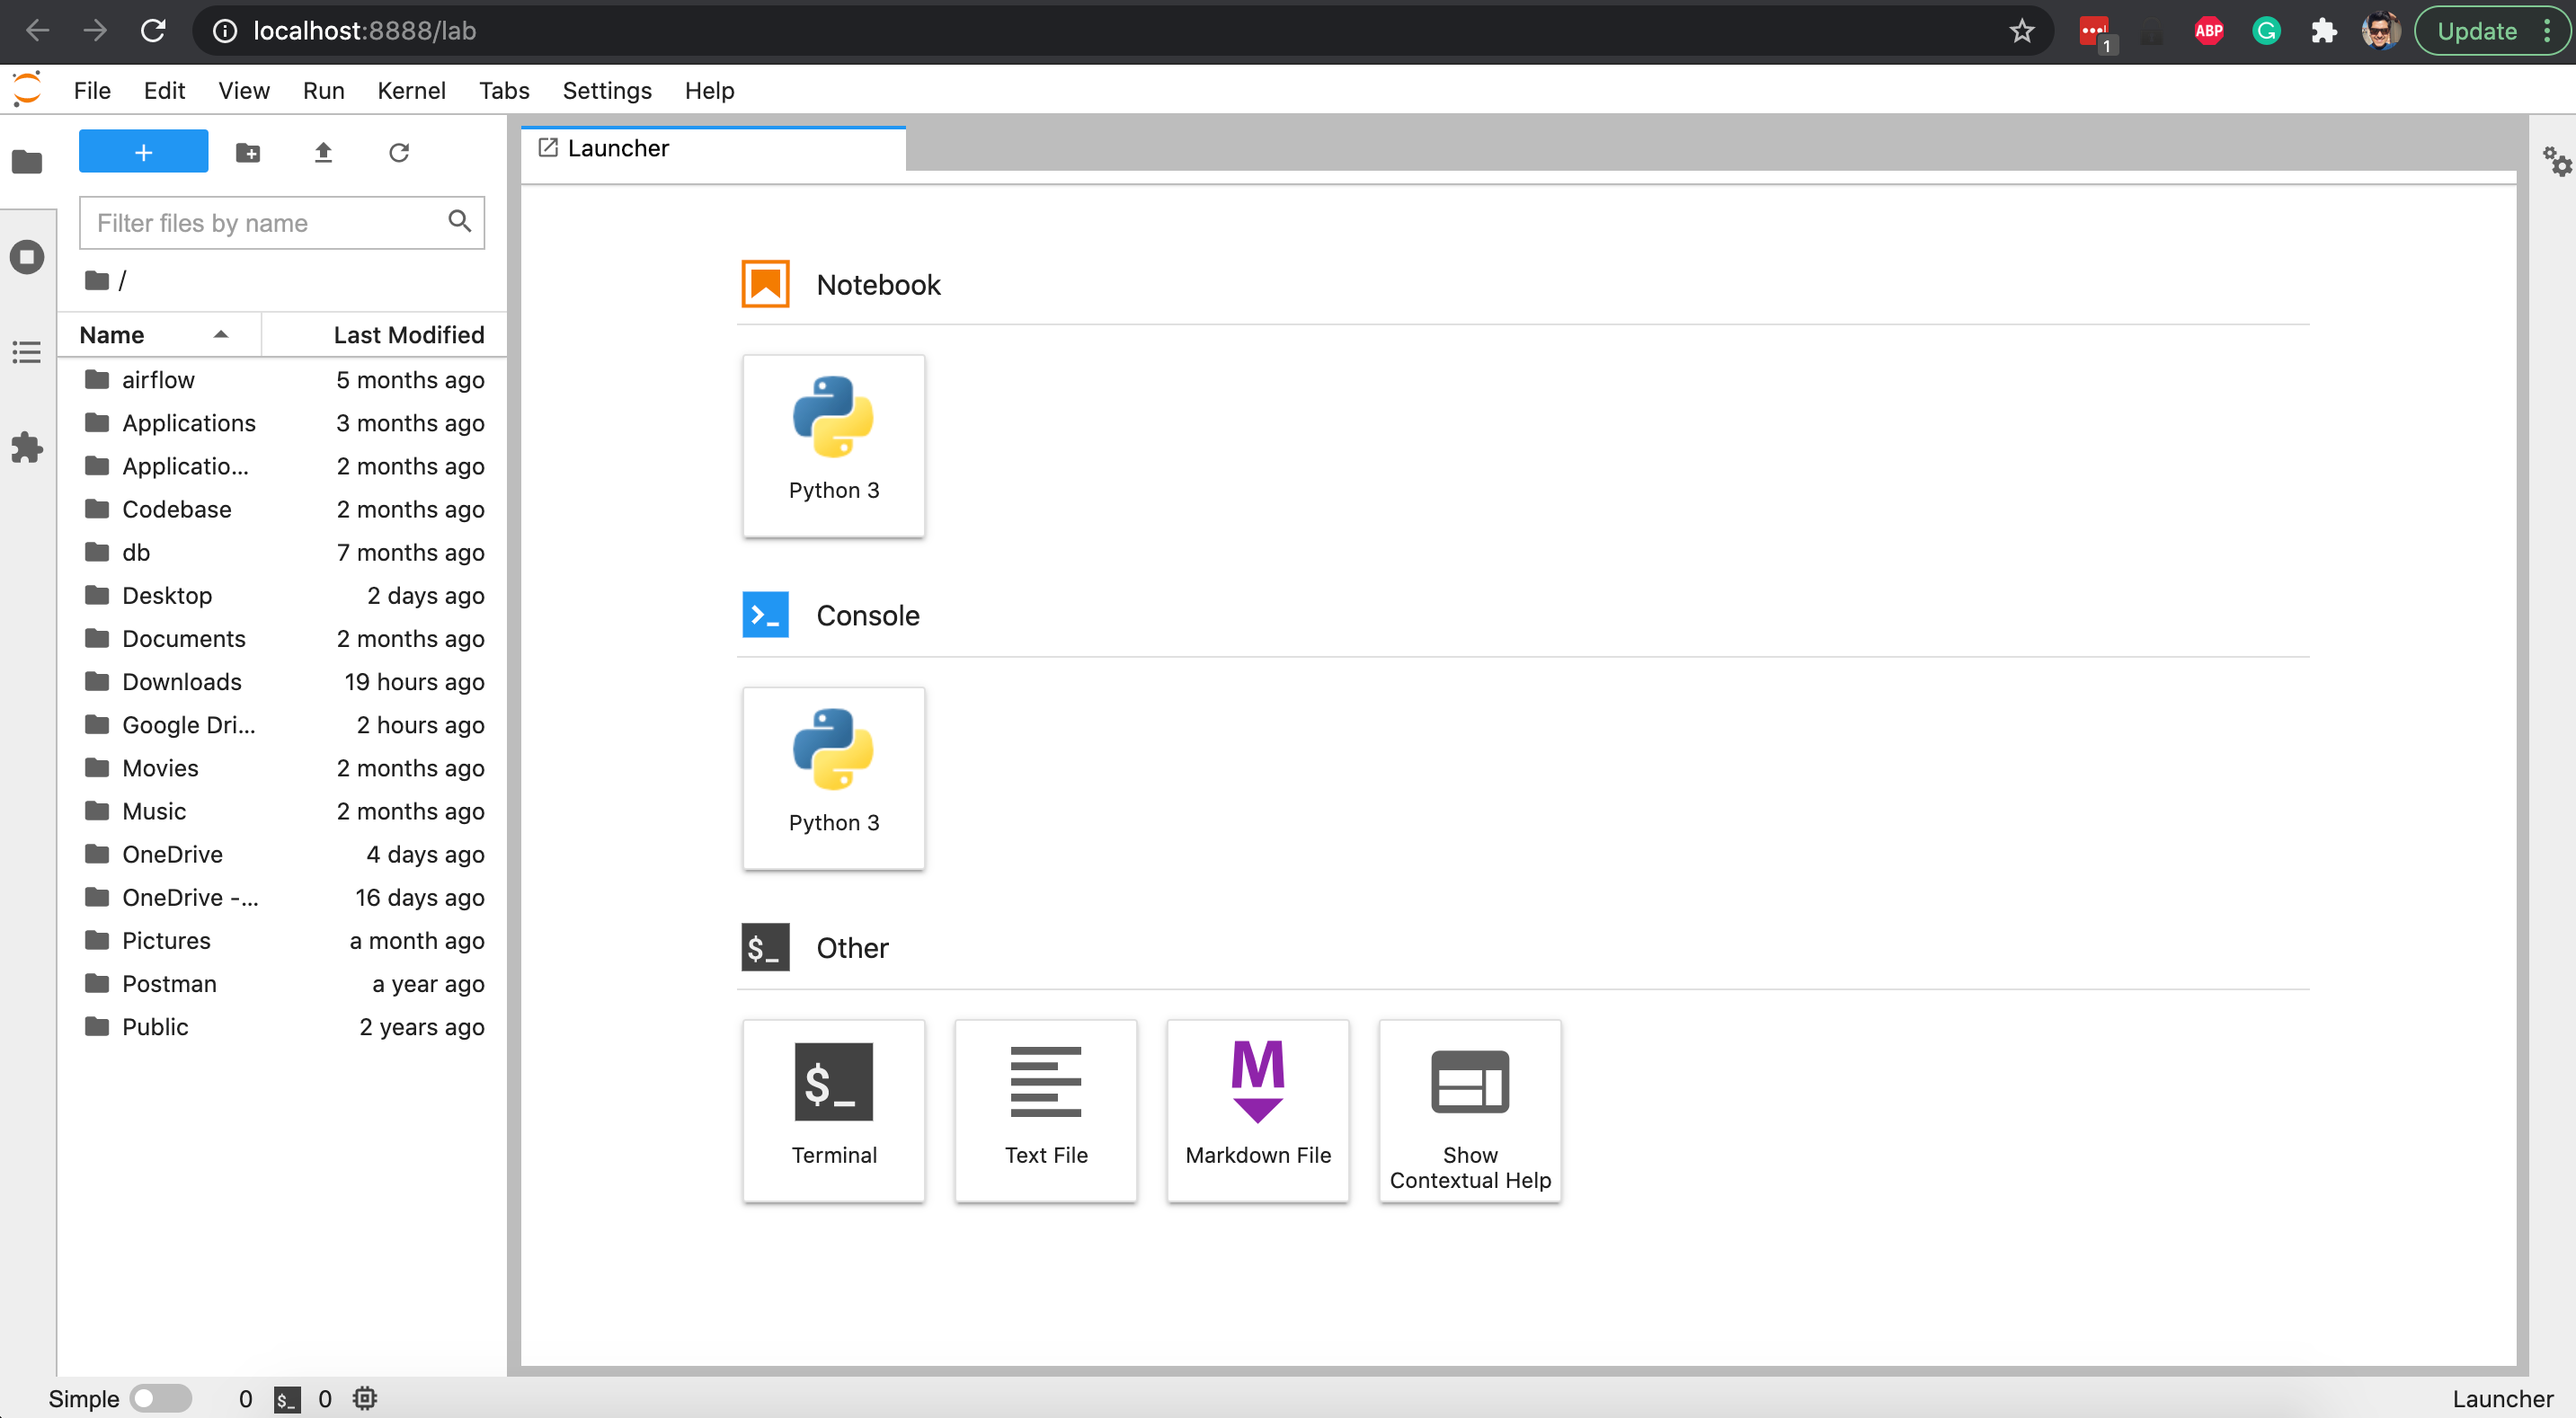
Figure 7 – JupyterLab started
Click on Python 3 Notebook and a new notebook will open up in which we can write our code for embedding the Power BI report.
Embedded Analytics in Jupyter Notebooks
In order to embed the report, we need to install the Power BI client for Jupyter Notebook. You can install it by using the following command.
|
1 |
pip install powerbiclient |
Now, we can import the client into our notebook and start embedding the dashboard. In order to embed the report, we need to follow the following four steps.
Import the report class into the Notebook
To begin, we need to import the Report class into the notebook first using the following command.
|
1 |
from powerbiclient import Report |
Setup the GroupID and the ReportID
In the next step, we are going to provide the GroupID and the ReportID that we have saved in the previous steps.
|
1 2 |
group_id = "023c2648-d43c-425a-88d7-fc2a2cf1ec10" report_id = "e63f1440-6006-452f-a03c-ab12d365b519" |
Authenticate the Device for Power BI to embed
In order to embed the report, we need to generate the Authentication Token and the Embed Tokens. These tokens are taken care of by the Power BI client library that we have imported. The Authentication module from the Power BI client enables device authentication. Let us learn how to authenticate the device for the same.
|
1 2 3 4 5 |
# Authenticate the device to embed from powerbiclient.authentication import DeviceCodeLoginAuthentication # Initiate device authentication device_auth = DeviceCodeLoginAuthentication() |
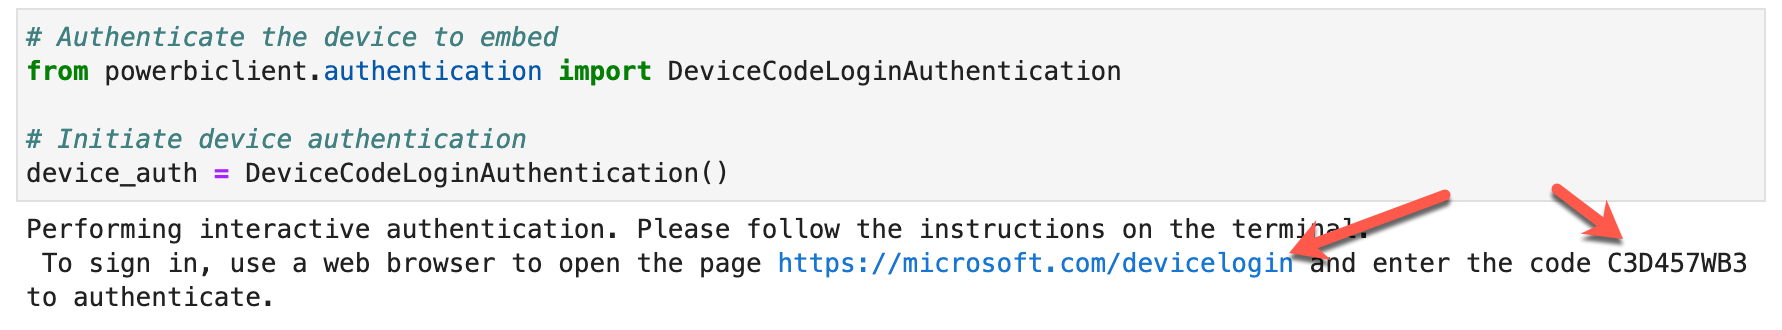
Figure 8 – Running the Authentication Snippet
As soon as you run the snippet, you will see a URL for device login and a code for the same. Navigate to the URL and enter the device code as is. You will be asked to sign in to your Power BI account and once done, the output in the notebook will also reflect the same.
Generating the report
In the final step, you can initiate the Report class by providing the necessary parameters and get the report embedded in the notebook.
|
1 2 3 |
# Generate the report report = Report(group_id=group_id, report_id=report_id, auth=device_auth) report |
As soon as you run the above command, the Power BI report will render and get embedded in the report as follows.
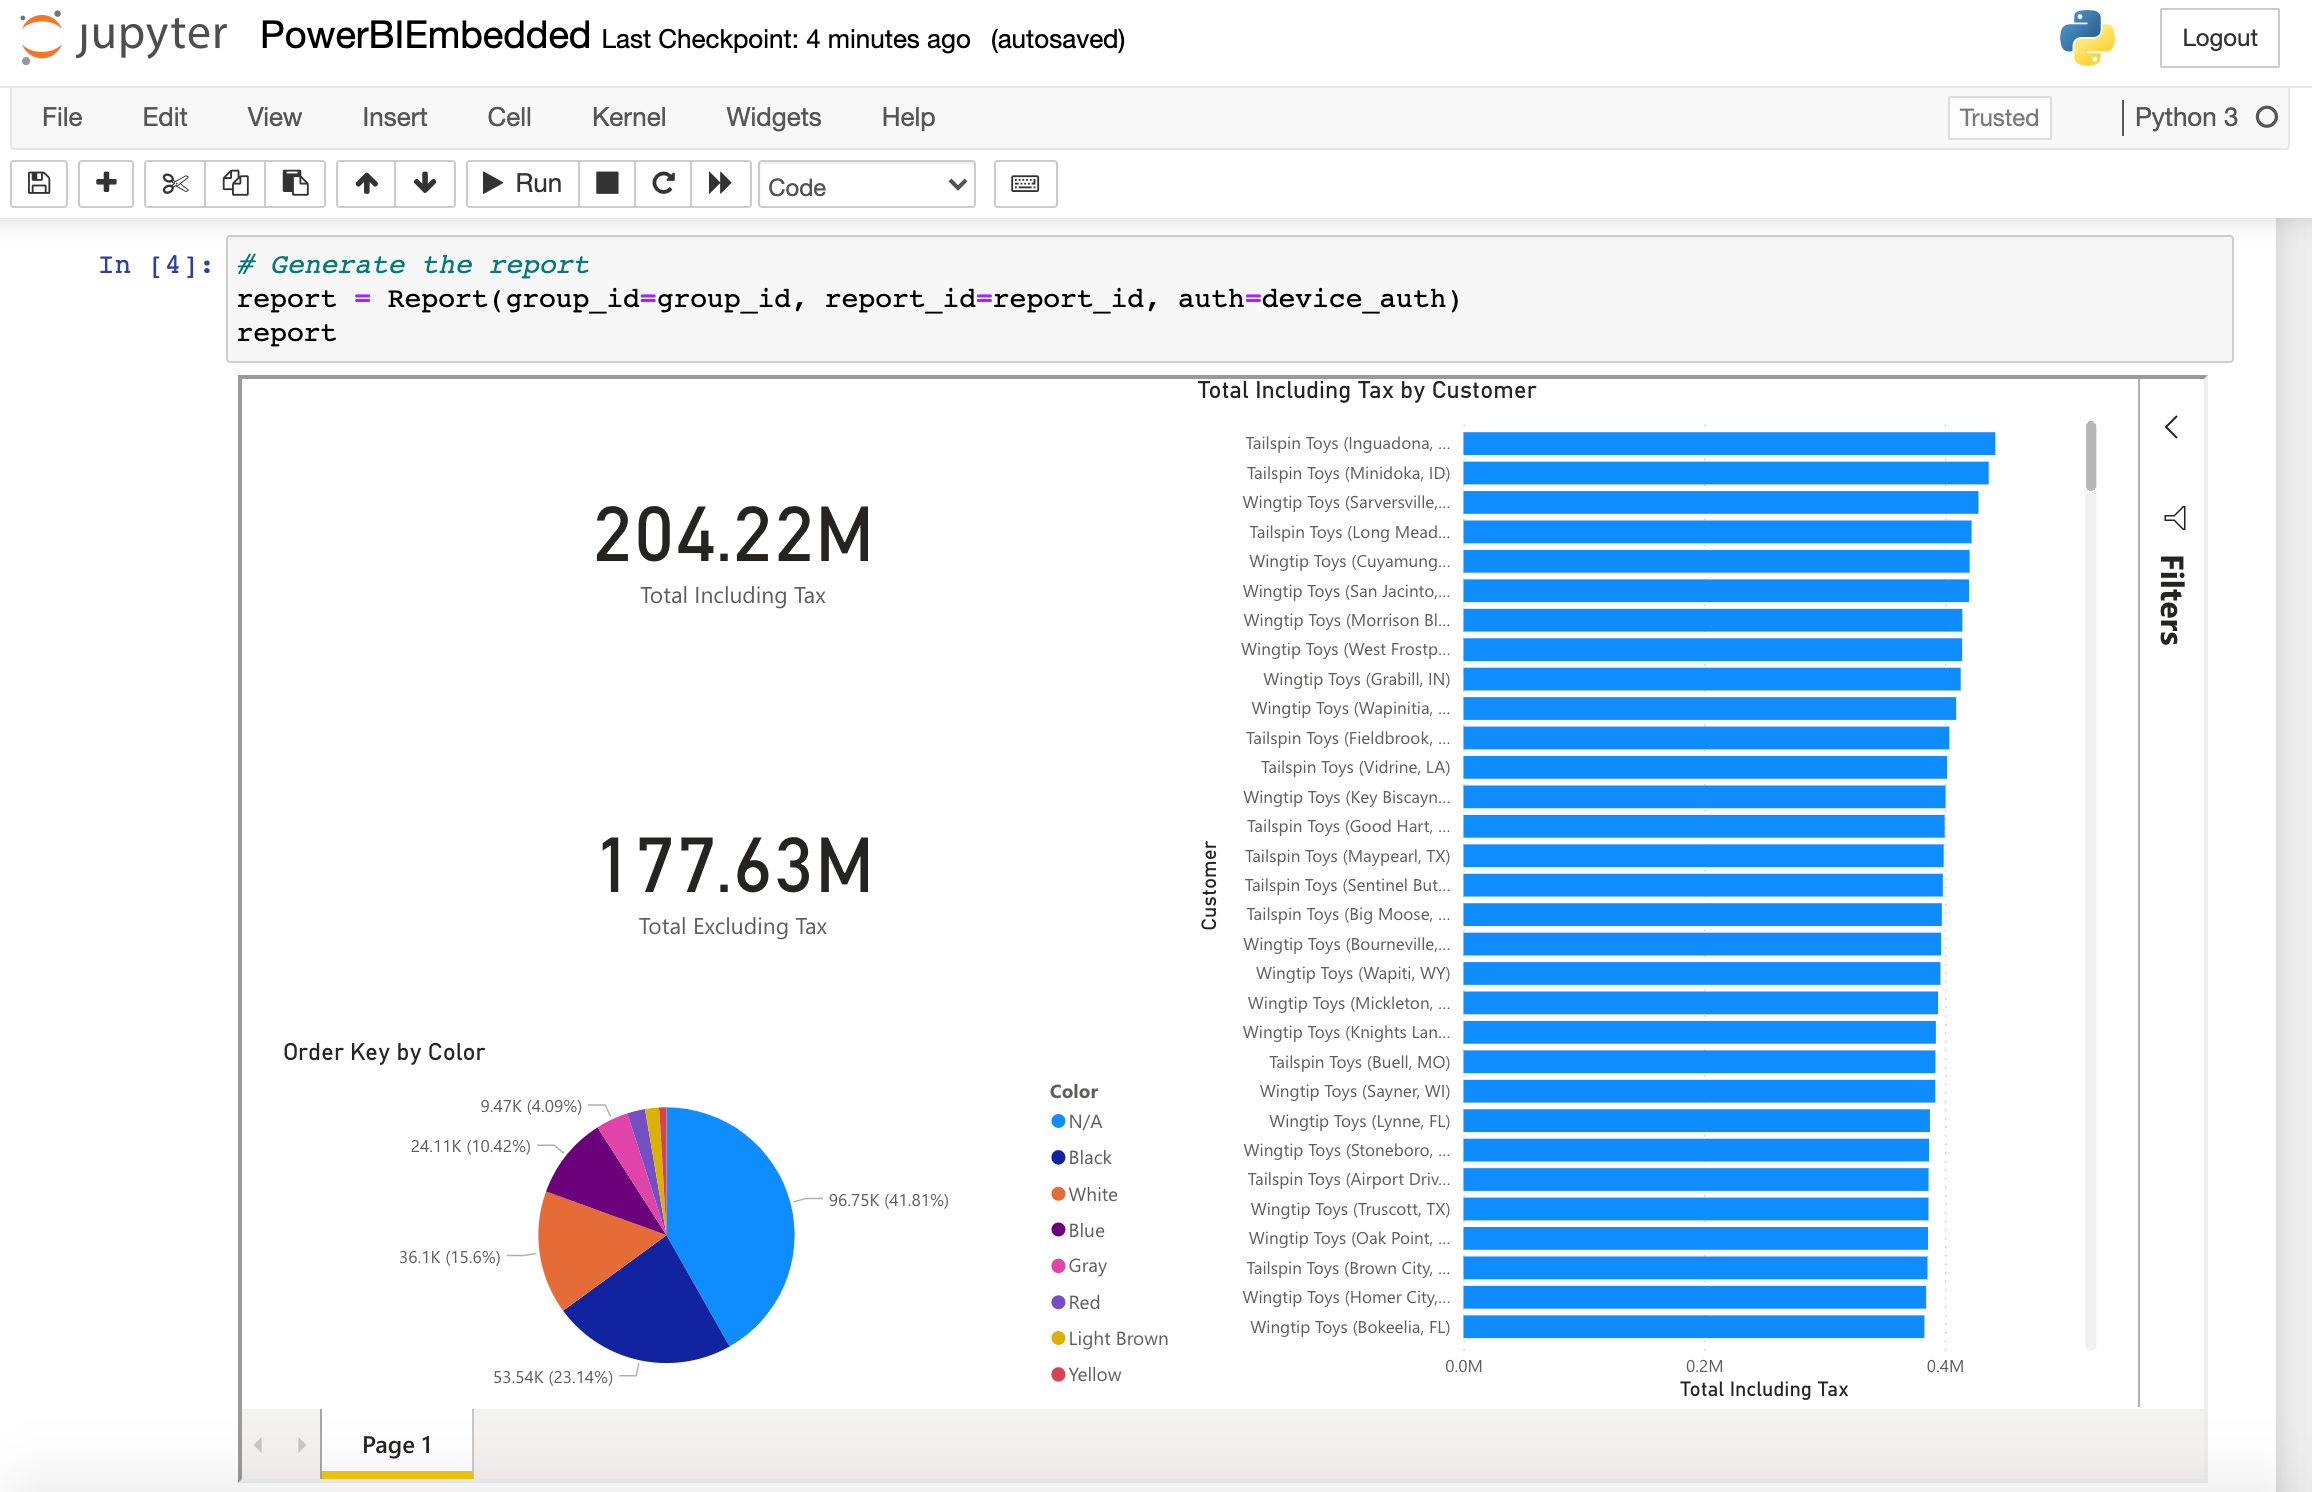
Figure 9 – Report embedded in the Jupyter Notebook
Conclusion
In this article, we have seen how to embed Power BI into a Jupyter Notebook. Power BI is one of the most used tools in the world of Data Visualization. Using Power BI, you can build reports that can query data from multiple data sources like flat files, relational databases, NoSQL data stores, data warehouses, other SaaS platforms like Salesforce, etc. Reports can be deployed to the Power BI Service which is also known as the Power BI cloud. Once the report is in the cloud, it can be shared with other customers. Power BI also provides a feature that enables users to embed the dashboards into their websites. This article describes how to embed a report in Power BI into a Jupyter The notebook using the python client. Once you embed your report into a notebook, you can use it for further analysis.
To learn more about embedding Power BI Reports into your Jupyter Notebook, you can also follow the official documentation from the GitHub page.

He is a prolific author, with over 100 articles published on various technical blogs, including his own blog, and a frequent contributor to different technical forums.
In his leisure time, he enjoys amateur photography mostly street imagery and still life. Some glimpses of his work can be found on Instagram. You can also find him on LinkedIn
View all posts by Aveek Das
- Getting started with PostgreSQL on Docker - August 12, 2022
- Getting started with Spatial Data in PostgreSQL - January 13, 2022
- An overview of Power BI Incremental Refresh - December 6, 2021