

In this article, we will discuss the k-means algorithm and how can we develop a k-means model on Azure Machine Learning Studio.
Machine learning is an area of artificial intelligence that helps us develop relationships between data and predict the future. There are many secrets that are hidden in the data. To discover these secrets, we need Machine Learning algorithms. Machine learning plays the key role in leveraging existing data to exploit business opportunities.
In this paragraph, we will discuss about the K-Means algorithm definition and how it works. The K-Means algorithm is one of the simple, unsupervised (As per Wikipedia : Unsupervised machine learning is the machine learning task of inferring a function to describe hidden structure from “unlabeled” data “a classification or categorization is not included in the observations”.) machine learning algorithms that solves the clustering problem. The K-means algorithm helps us to divide groups of our datasets which hold similar attributes or properties. These groups show the characteristics of the dataset and identify abnormal character data.
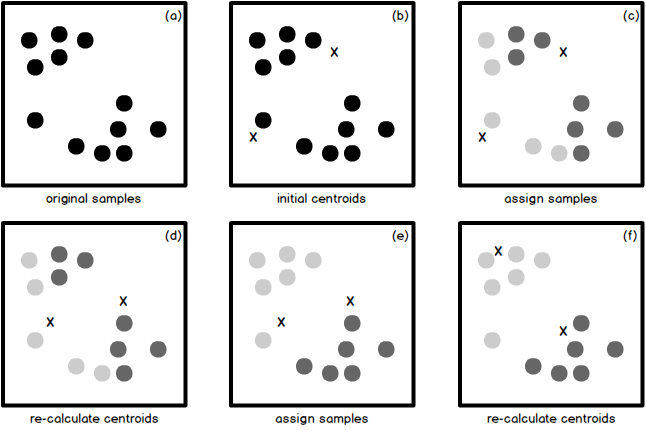
In short, the algorithm works like this, cluster centers (aka centroids) are determined at the beginning of algorithm. Then we calculate the distance between each object and each centroid. After this step, each object will be assigned to the nearest centroid. When the assignment is completed, algorithm recalculates the cluster centers and reassigns the data to the new centroid. If the cluster centers don’t change algorithm stop works.
The main steps in the k-means algorithm are:
- Define centroids (the k letter defines how many centroids will be selected)
- Assign samples
- Re-calculate centroids
- Re-assign samples
Experiment
First, we will login into Azure Machine Learning Studio. Azure Machine Learning Studio has different types of subscriptions. You can use any one of them. I will use a free account. We will use countries protein consumption statistics csv dataset. This data set includes how to countries meet their protein needs.
This experiment will demonstrate how to model K-Means algorithm in Azure Machine Learning. Our goal in this experiment is to group the countries which have similar eating habits. Especially we want to determine which countries white meat and red meat eating habits are similar.
The key point is to group the data that may be related to each other. For example, shoe size may be related to gender, but there is no relationship between shoe size and eye color.
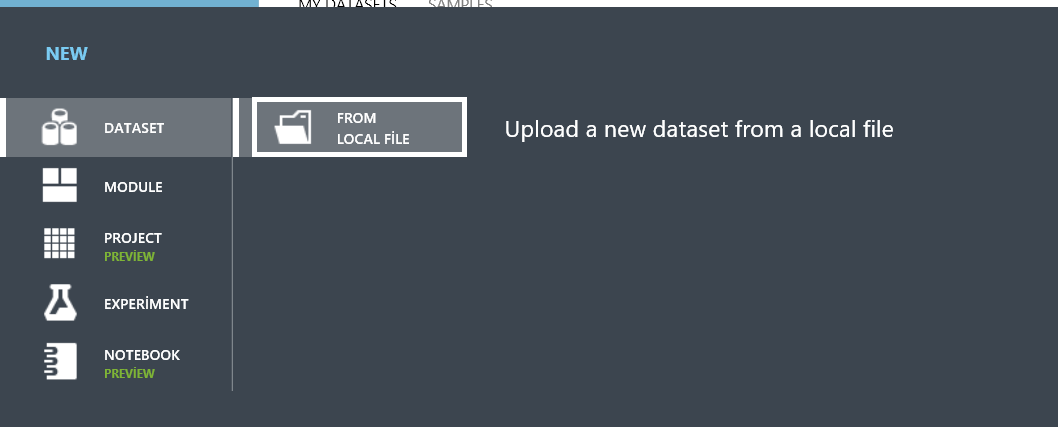
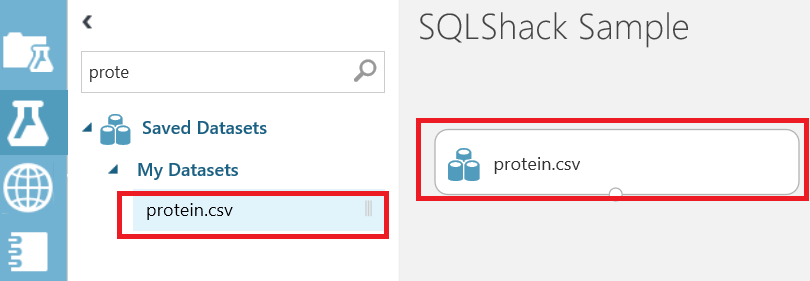
In first step we will load a csv dataset. We will select Datasets tab and add new dataset.

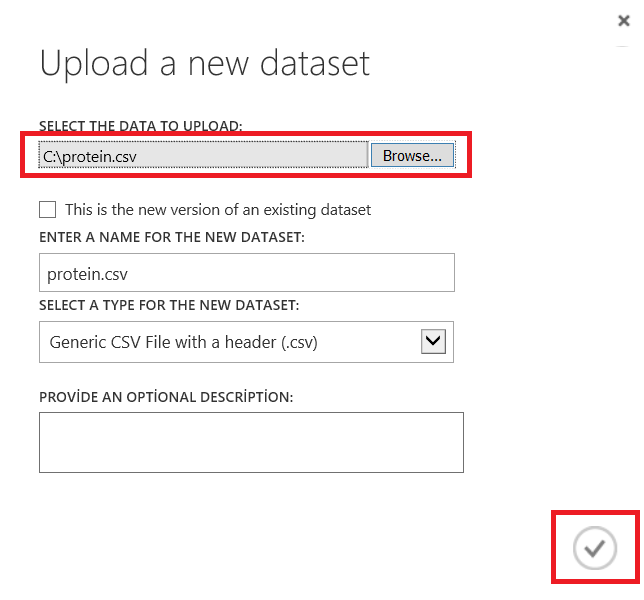
After this step we will load protein.csv file.
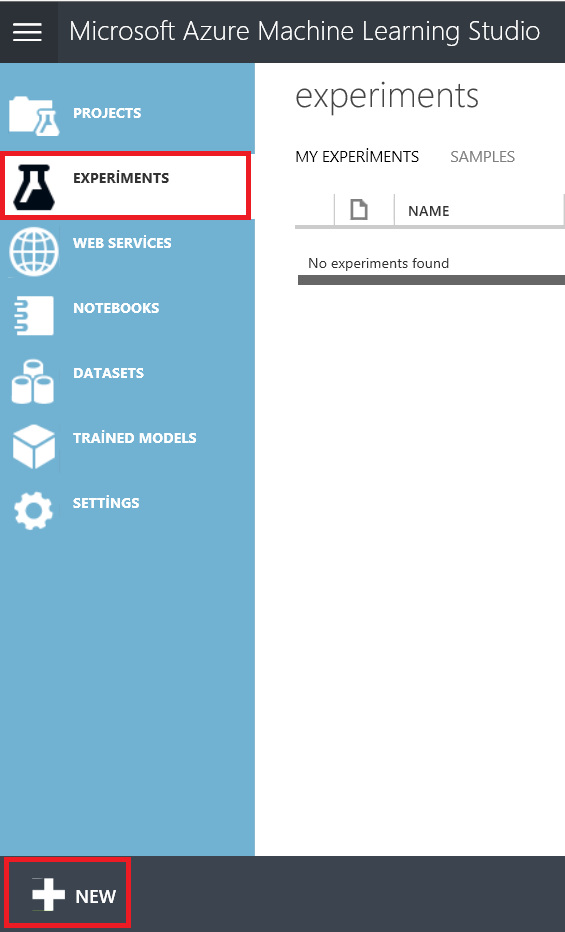
Now we will create a new experiment.
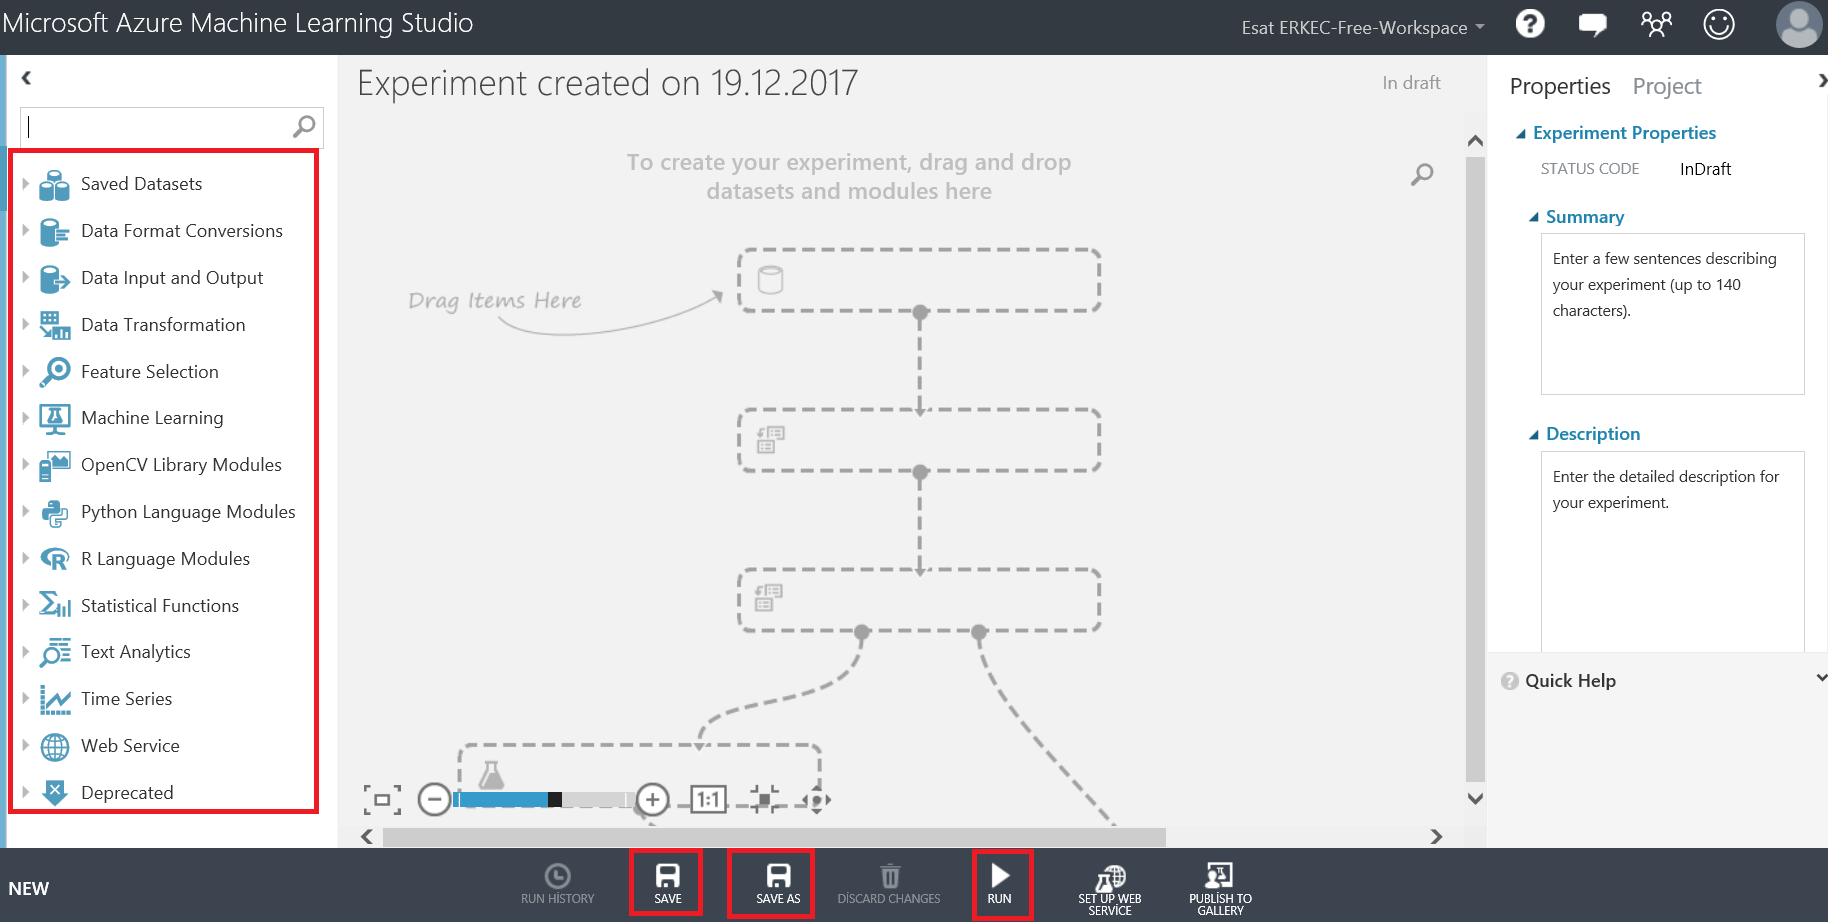
In the right side of the canvas screen, we can find all of the statistical functions, data transformation, and similar components. We can find SAVE, SAVE AS and RUN button below of screen. We can also find clicked component properties. Now, we will create an empty experiment and then add protein.csv dataset.
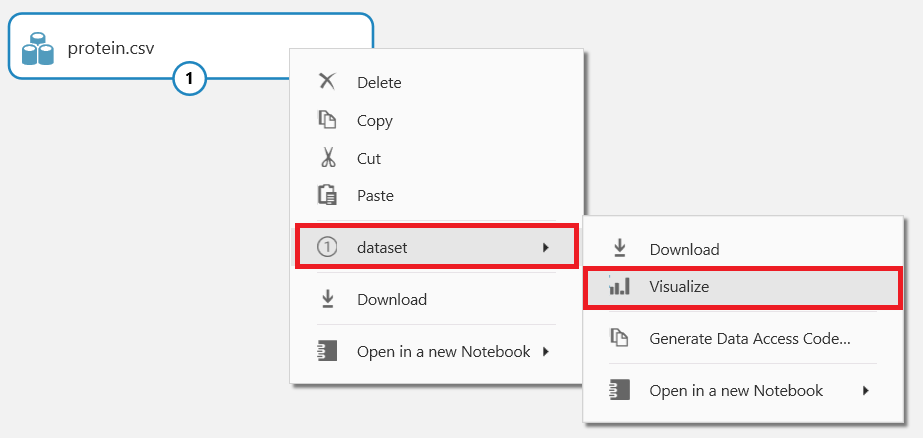
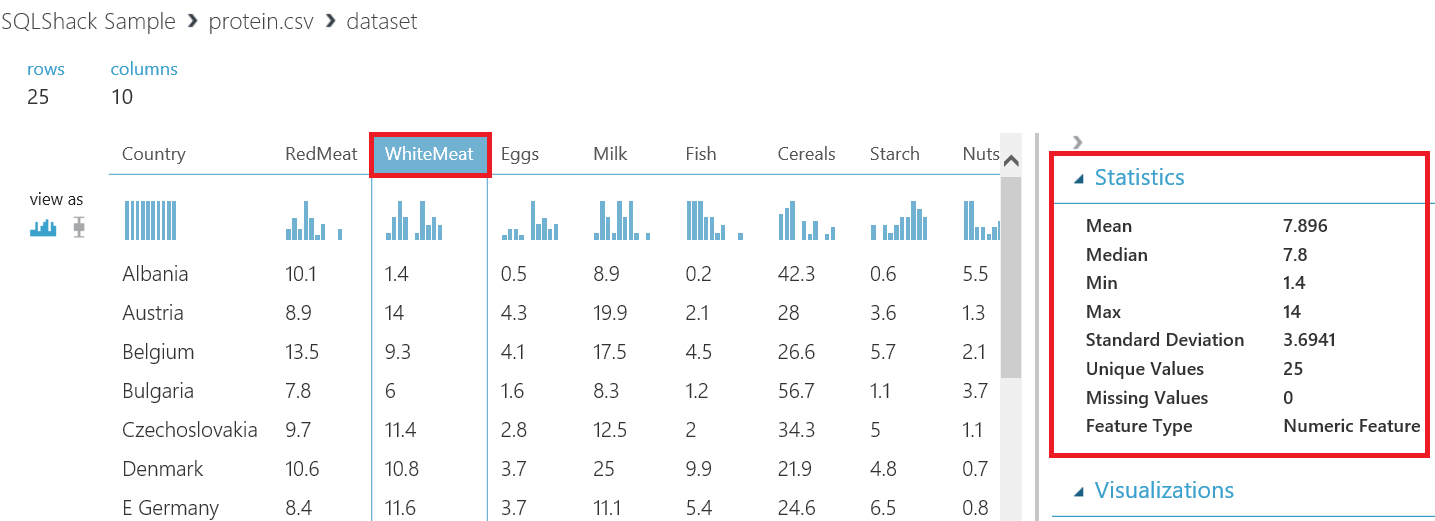
In this screen, we are able to look at the dataset and analyze main statistic values of columns
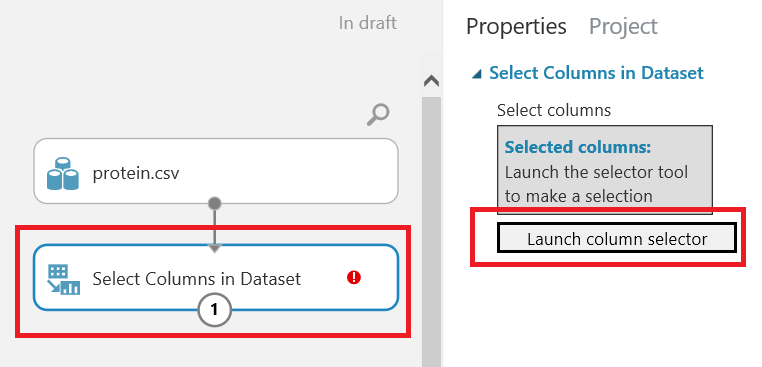
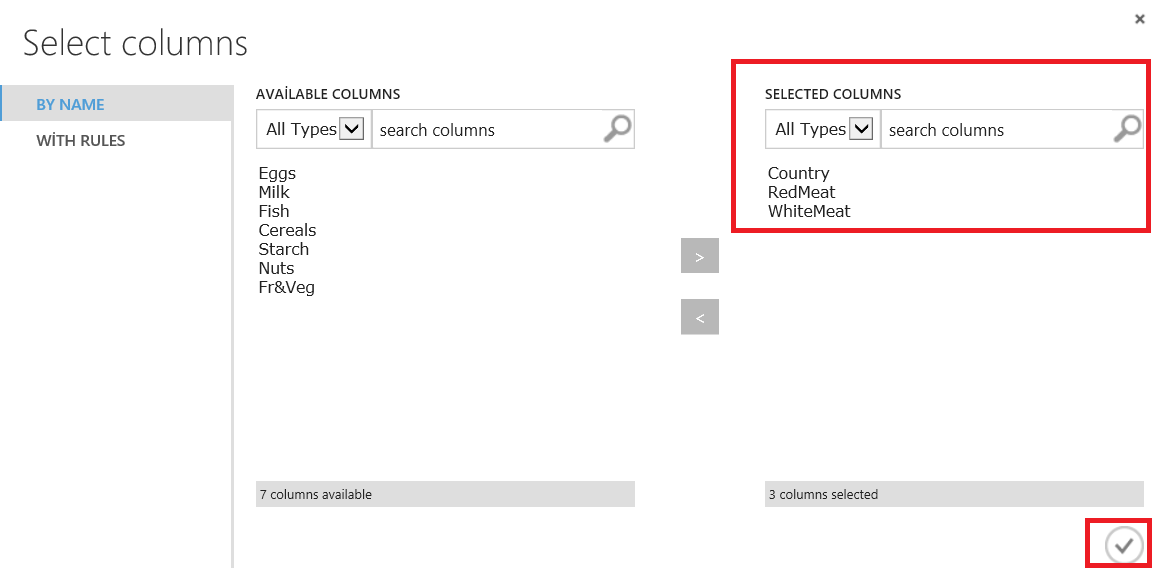
In the next step, we will add Select columns in dataset component and we will chose the columns which we think related to each other. This component will help us to limit columns or reduce the size of dataset. In this example we will chose country, redmeat and whitemeat columns.
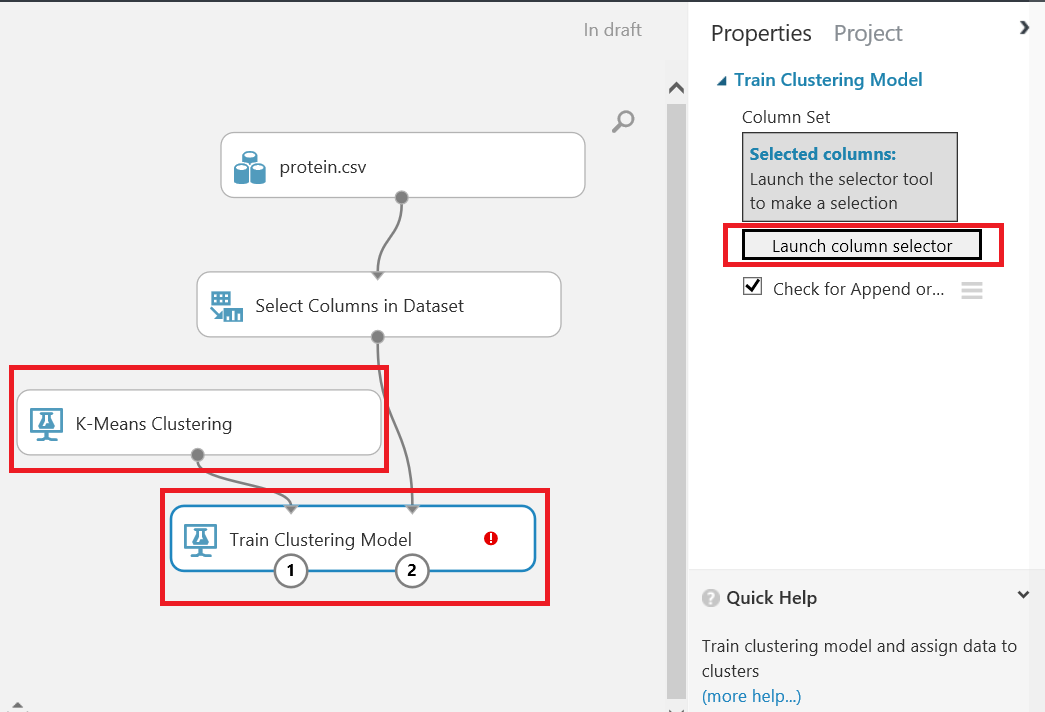
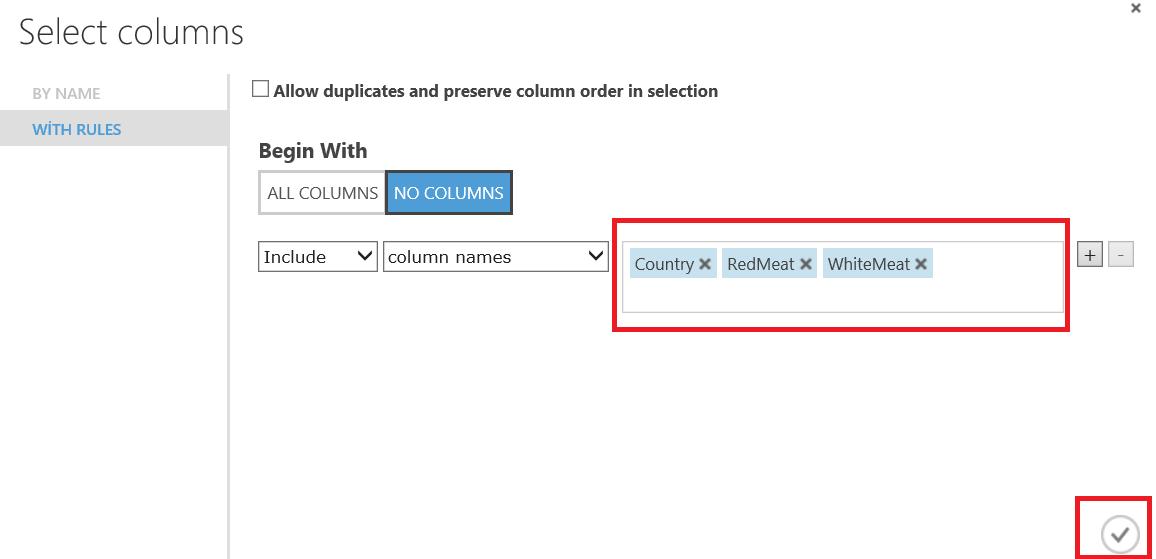
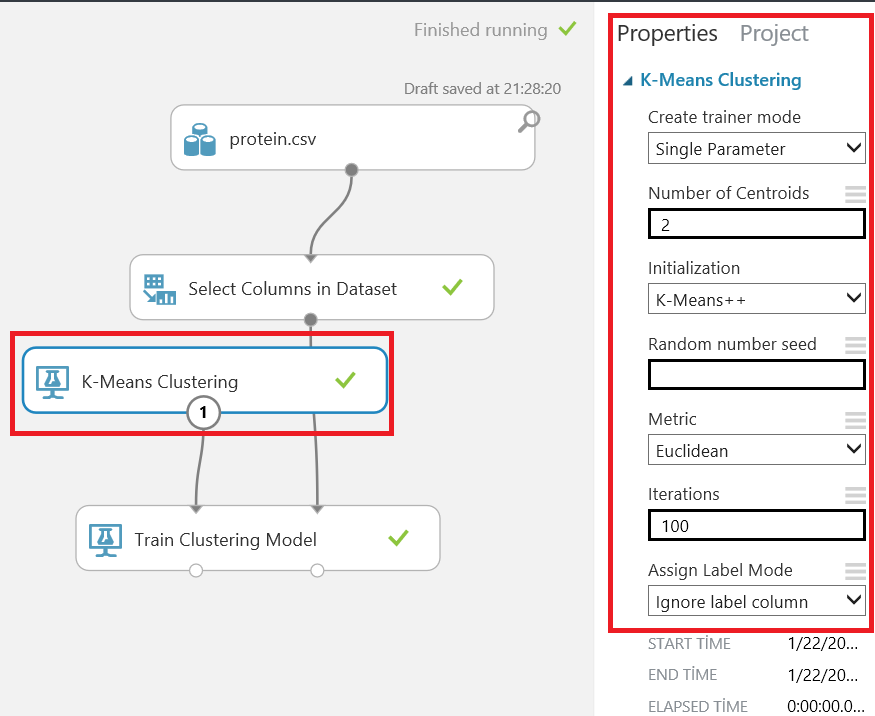
We will add the Train clustering model component and K-means clustering model components and then we will select columns for our k-means algorithm model on the train cluster model
The Azure Machine Learning k-means clustering model offers many properties about the k-means algorithm.
If we select a single parameter model, we can set the number of centroids. This value defines how many clusters we want to create. But how do we choose our k parameter? Azure Machine learning consists a helper component for this which is named “Sweep Clustering”. This component can help us to find the optimal parameters for our clustering model. We will learn the usage of this component at the end of the article.
The initialization parameter defines different types of k-means algorithms. The Iterations value defines how many times the k-means algorithm assigns values to clusters.
In this example, we will use default parameters. When we run our model we must have all components checked green. It means our model has worked successfully.
In this next step, we analyze our model result. When we right click the Train clustering model we are able to see a cluster separation diagram. In our example, we will see two clusters.
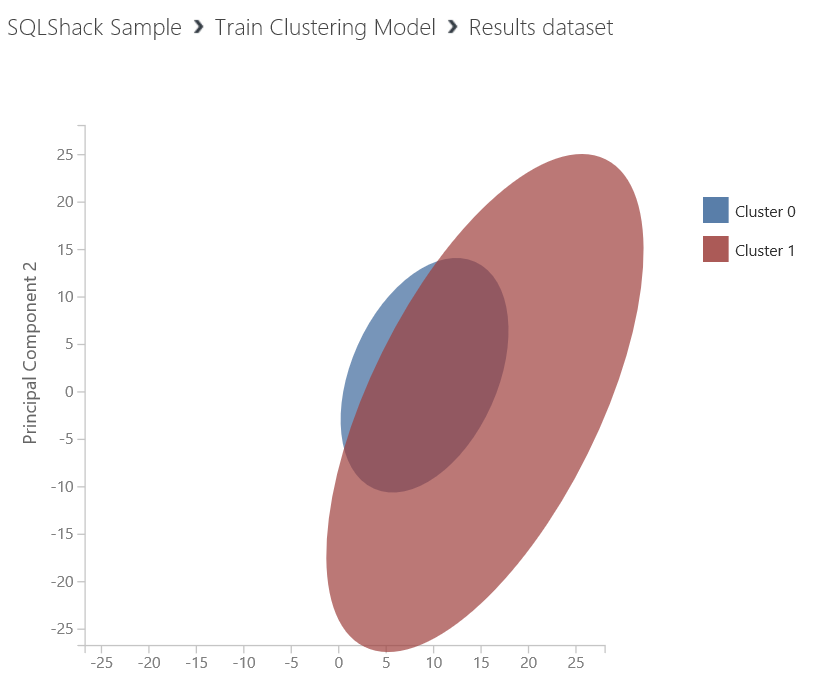
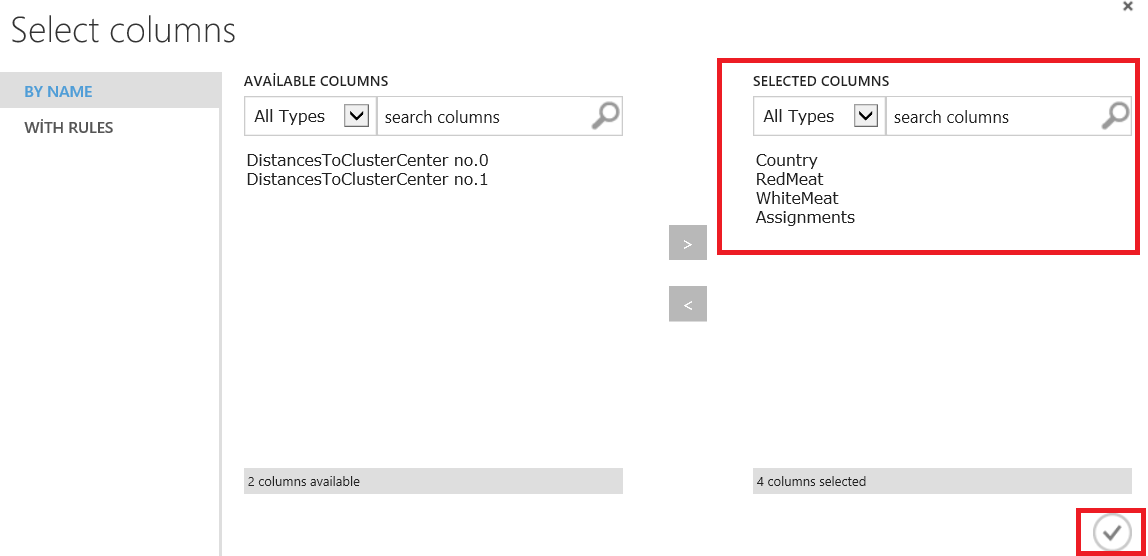
But this diagram is not enough to analyze our dataset, it only defines how many times the dataset has been separated. Now we will add Select columns in the dataset and connect it to the Train clustering model results dataset. After that, we will select columns and assignment of rows.
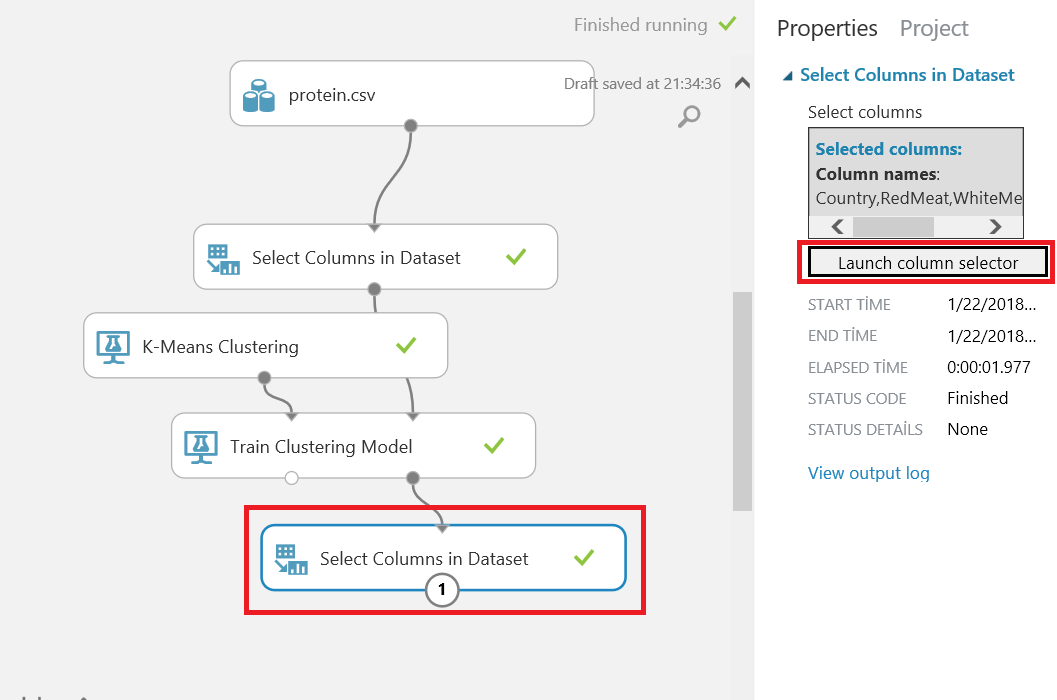
Now we run our model and look at the results of our model.
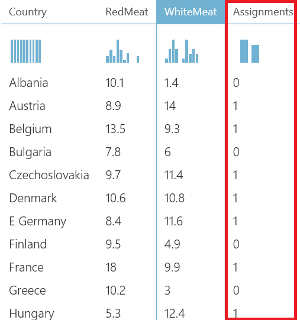
In the below chart, we can see the assignment of dataset rows.
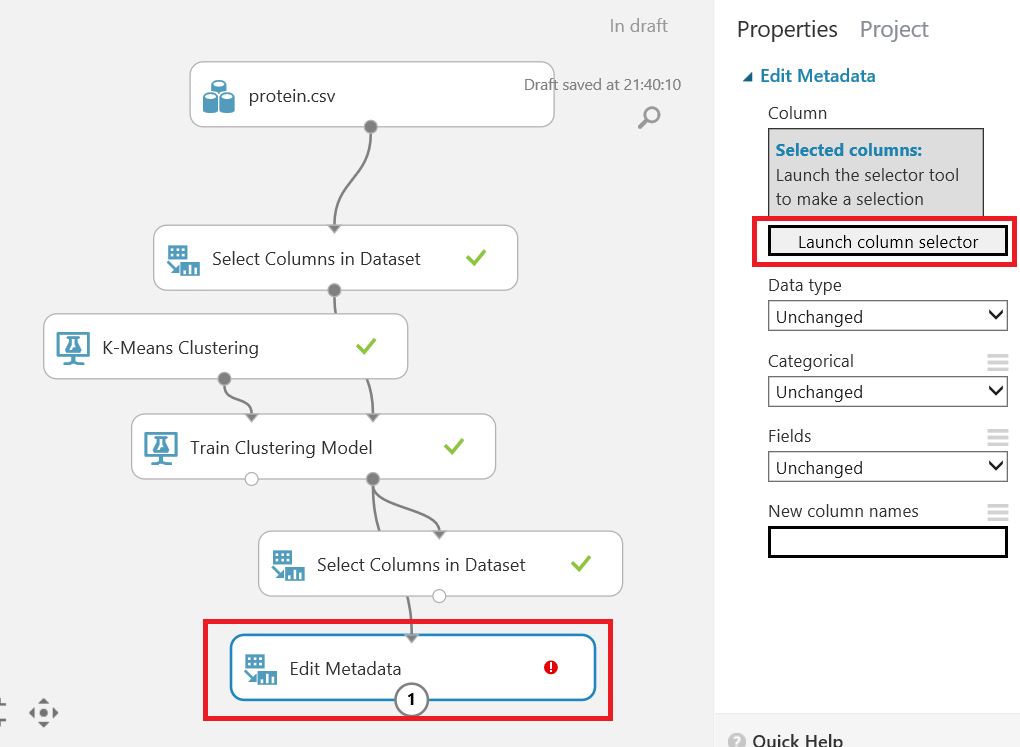
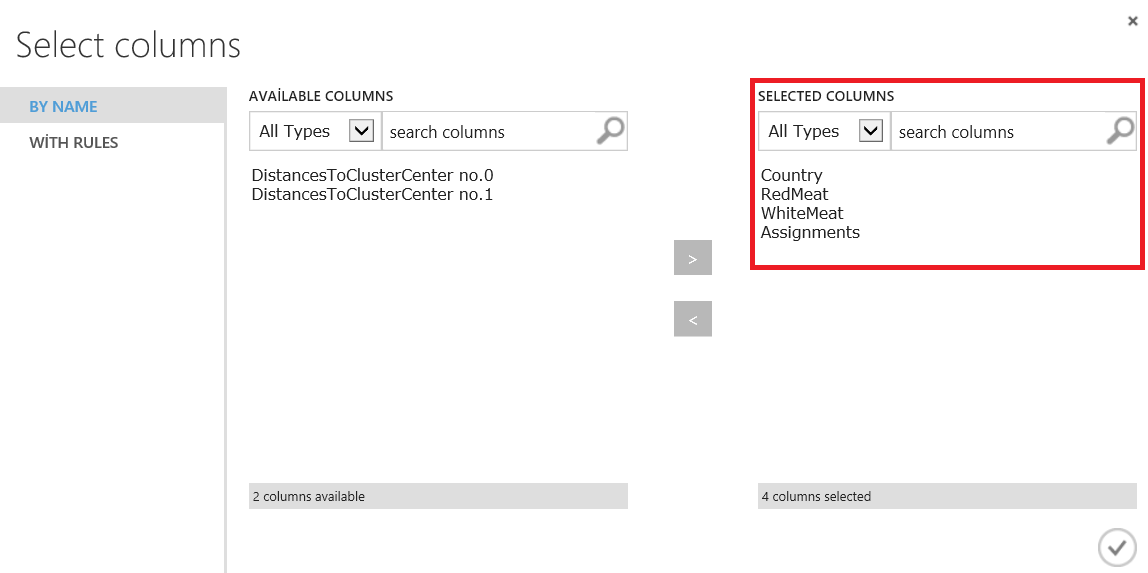
In this part of our example, we will examine our k-means algorithm. Now we will add Edit metadata and connect it to our Train clustering model result dataset. Then we will add columns for the Edit metadata.
Next, we will right-click Edit metadata and visualize. We will compare White Meat and assignments and it will create a plot box graphic.
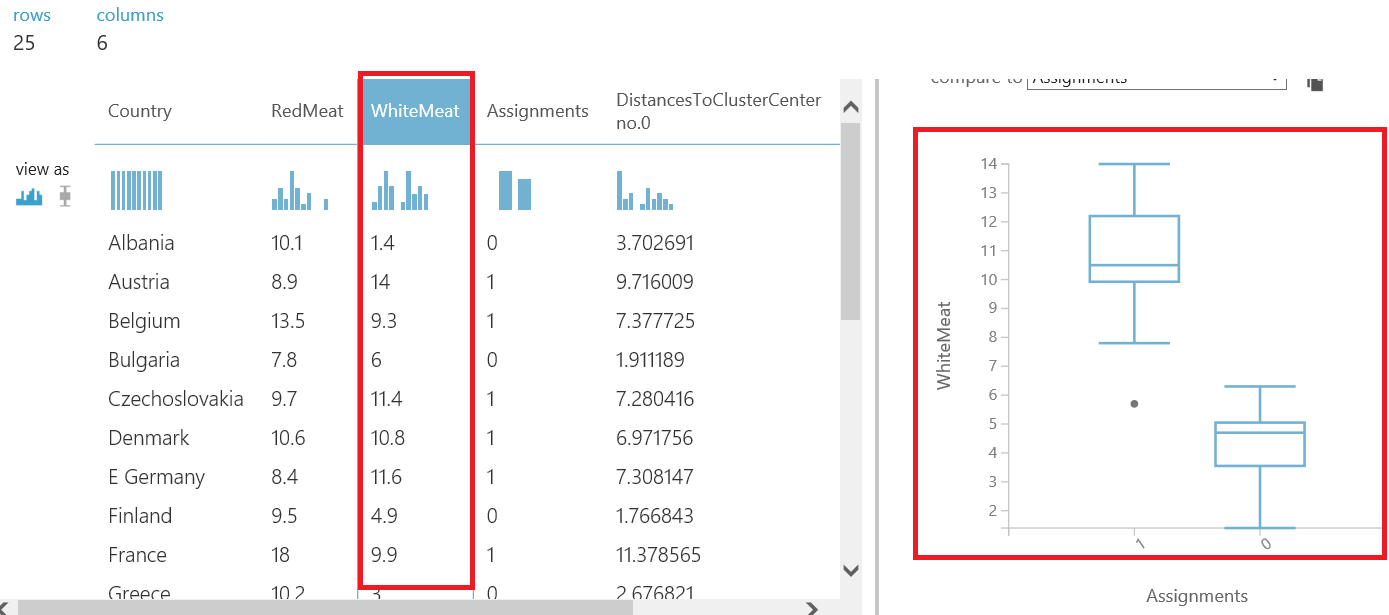
When we look at the above chart, it demonstrates the main idea of our k-means algorithm. The K-means algorithm separates white meat consumption into two clusters. We can see this clusters in the plot box chart it shows two (“0”, “1”) values in x axis.
When we compare to the country column to assignments our chart will be changed.

When we look at the above chart, we can see countries cluster assignments. The goal of the experiment is to predict the closest outputs to the real. For this reason, we will add sweep clustering component to our model and make some changes for more accuracy. We will hook up K-Means algorithm to sweep clustering and change k-means clustering property of creating trainer mode to parameter range.
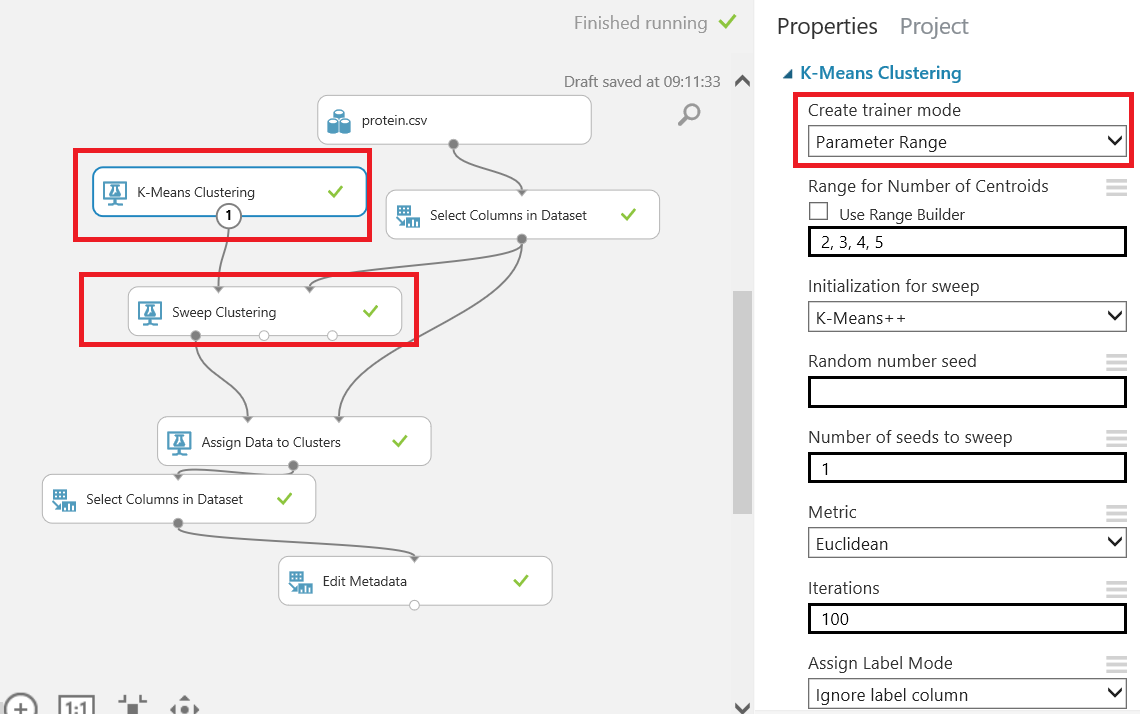
And we will connect sweep clustering best training output to assign clusters because we want get more accuracy about our dataset. When we look at the assign data clusters to it will create three clusters.
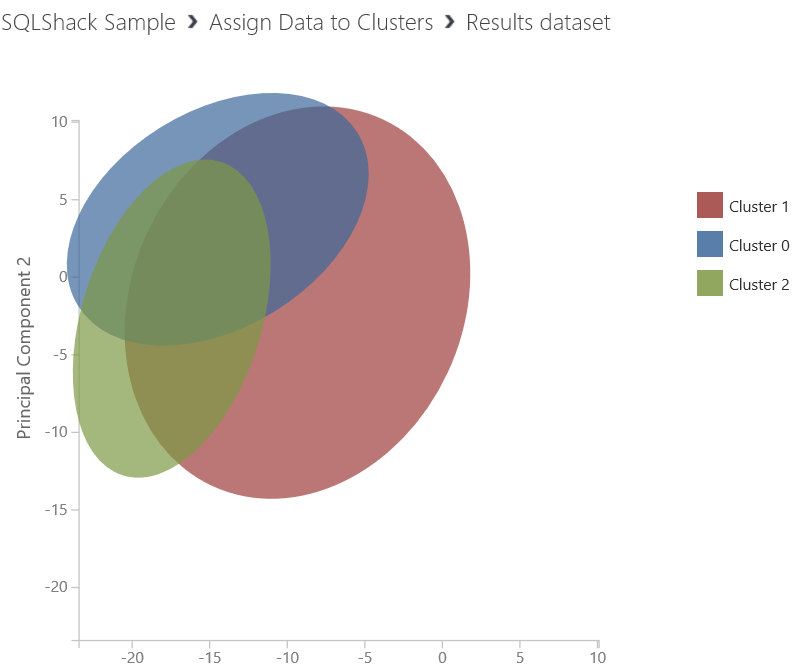
So we have seen that the optimal number of groups for our data set is three. Because sweep clustering component tests some iterations and decide the optimal parameter.
Conclusion
In this article, we learned K-Means algorithm and usage in Azure Machine Learning. We created a very simple example. On Azure Machine Learning side we have seen that it is not too difficult to use some basic machine learning algorithms.

Most of his career has been focused on SQL Server Database Administration and Development. His current interests are in database administration and Business Intelligence. You can find him on LinkedIn.
View all posts by Esat Erkec
- SQL Performance Tuning tips for newbies - April 15, 2024
- SQL Unit Testing reference guide for beginners - August 11, 2023
- SQL Cheat Sheet for Newbies - February 21, 2023