

Debugging is one of the most important but painful parts of any software process. To find some errors you have to run the code step by step to see which section of the code is responsible for the error. This is called runtime debugging.
Luckily, SQL Server Management Studio (SSMS) comes with automated debugging capabilities to help developers debug their scripts. In this article, we will explain practically how SSMS can be used to debug stored procedures in SQL Server by working through a very simple example.
Example
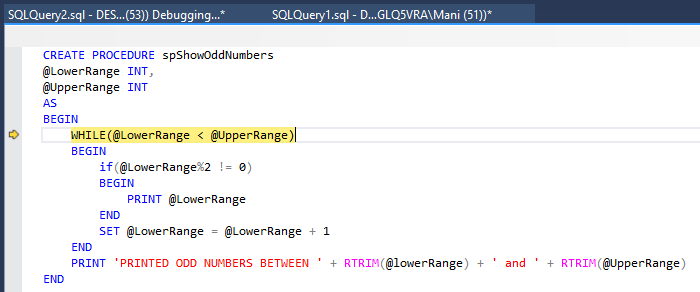
For our example, we will use a stored procedure “spShowOddNumbers” that takes two numbers as its parameters and prints all the odd numbers between those two specified numbers.
|
1 2 3 4 5 6 7 8 9 10 11 12 13 14 15 |
CREATE PROCEDURE spShowOddNumbers @LowerRange INT, @UpperRange INT AS BEGIN WHILE(@LowerRange < @UpperRange) BEGIN if(@LowerRange%2 != 0) BEGIN PRINT @LowerRange END SET @LowerRange = @LowerRange + 1 END PRINT 'PRINTED ODD NUMBERS BETWEEN ' + RTRIM(@lowerRange) + ' and ' + RTRIM(@UpperRange) END |
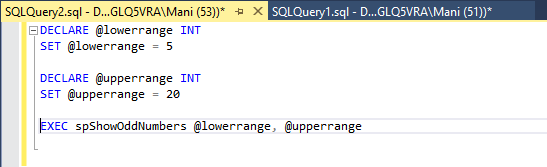
The script that calls the stored procedure in SQL Server:
|
1 2 3 4 5 6 7 8 9 |
DECLARE @lowerrange INT SET @lowerrange = 5 DECLARE @upperrange INT SET @upperrange = 20 EXEC spShowOddNumbers @lowerrange, @upperrange DROP PROC spShowOddNumbers |
Debugging options
In SQL Server Management Studio, you have a variety of debugging options.
Start Debugging
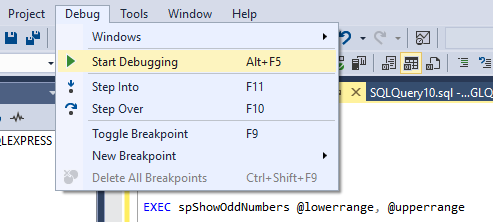
To start debugging a SQL server stored procedure in SQL Server, press ALT + F5, or go to Debug -> Start Debugging, as shown in the figure below:
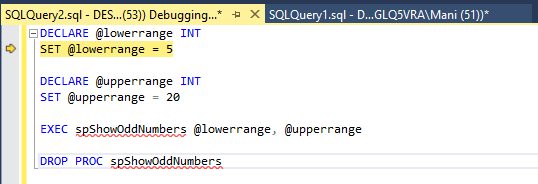
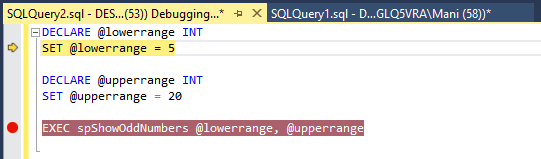
After starting the debugger in the window where you are calling your stored procedure in SQL Server, you will see that there will be a yellow cursor at the start of the query window as shown below:
Now you have started debugging you can step through the code.
Stepping Through Script
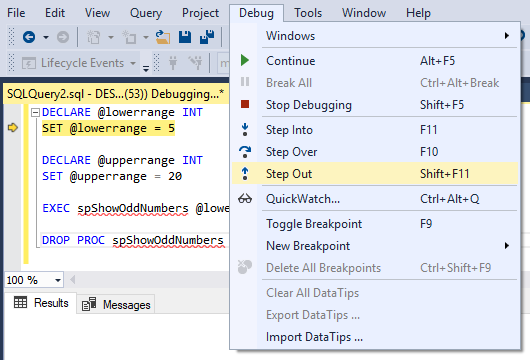
There are three options to step through the code: 1) Step Over, 2) Step Into and 3) Step Out. You can see these options by clicking Debug as shown in the screenshot below:
- Step Over (F 10)
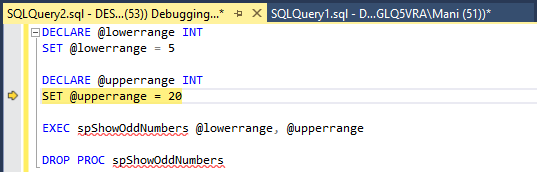
Step Over simply moves the cursor to the next line of executable script. For instance, if the debugger is at the following location in the script:

Clicking Step Over or pressing F10 simply moves the cursor to the following line:
- Step Into (F 11)
This is one of the most important and useful debugging features. Step Into lets you break into the stored procedure script from the script that calls that stored procedure.
It is important to mention that Step Into works like Step Over. If the line of script being executed doesn’t contain any call to the stored procedure in SQL Server.
For instance if you Step Into at:
1SET @upperrange = 20The debugger will simply move the control to the next line:
1EXEC spShowOddNumbers @lowerrange, @upperrangeThe above line contains a call to the stored procedure in SQL Server. Now if you Step Into at this line of script, the debugger will take you to the script of ‘spShowOddNumbers’ stored procedure as shown in the following figure.
- Step Out (Shift + F11)
Step Out is the opposite of Step Into. If you are inside a stored procedure in SQL Server and you want to go back to the script that calls the stored procedure you can use Step Out. For instance, if you click Step Over at:
1WHILE(@LowerRange < @UpperRange)The debugger will take you back to the script that calls the function i.e.

Run To Cursor
Debugging options execute one line at a time. If there is a loop or a long piece of code that you want your debugger to skip, you can use the ‘Run To Cursor’ option.
|
1 |
WHILE(@LowerRange < @UpperRange) |
For instance, if the cursor is at the following line of the stored procedure in SQL Server and you want to skip the loop and go to the print statement after the loop. You can simply go the print statement and click “Run To Cursor” as shown below:
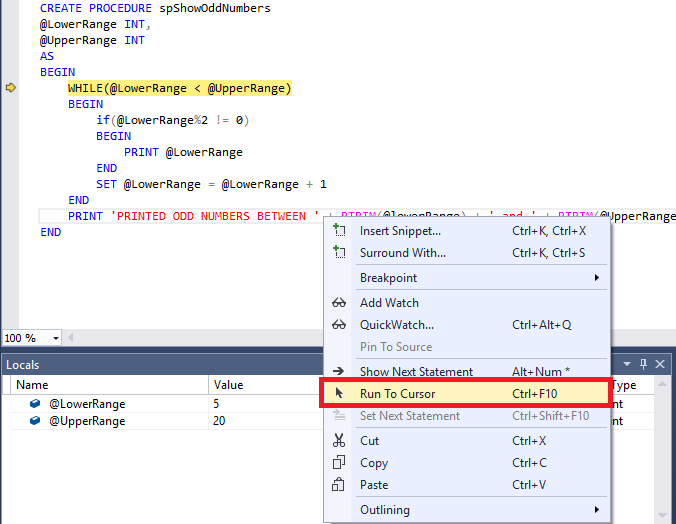
The loop will be skipped and your cursor will now point at the print statement.
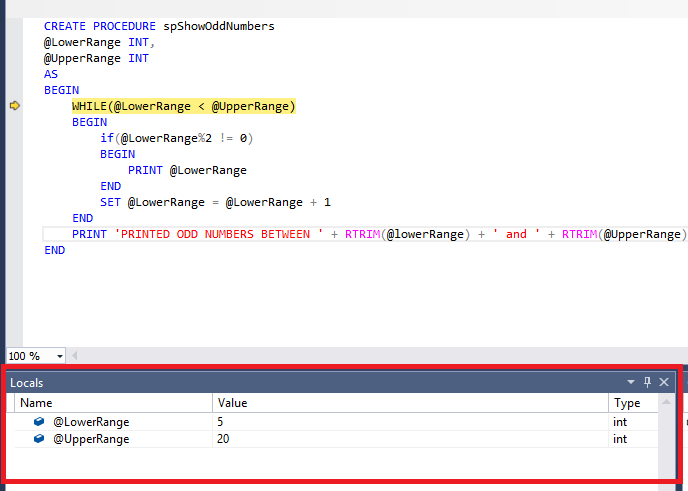
The Local Window
The local window helps you keep track of the values of the variables in the script. In this example, we have two variables @LowerRange and @UpperRange in our script. At the start of the while loop in the stored procedure in SQL Server the value of @LowerRange variable is 5 while the @UpperRange variable is 20 as shown in the figure below:
Once you execute the loop and then check the value of the variables you will see that the @LowerRange and @UpperRange variables will both show 20 as their value. The Locals window displays the Name, Value, and Type of the variable. Using the Locals window makes it very simple to can keep track of the changes in the values of your variables as you progress through the script.
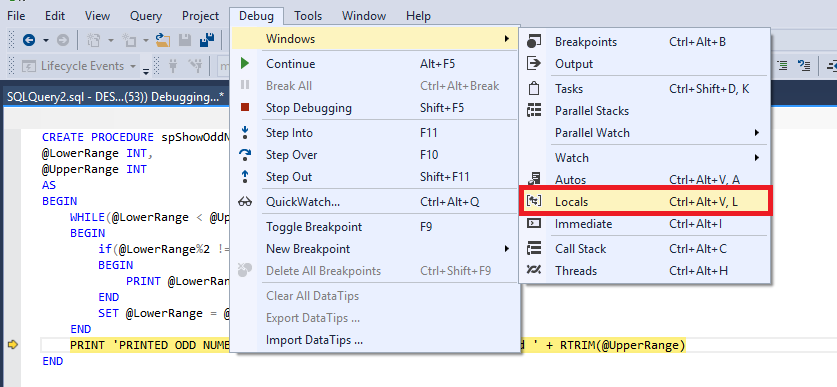
If you close the Locals window accidentally and you want to bring it back, you can simply go to Debug -> Windows -> Locals as shown below:
The Watch Window
The Watch window is very similar to the Locals window. The only difference is that you can add to or remove variables from the Watch window, which can be useful when working with large numbers of variables in larger scripts.
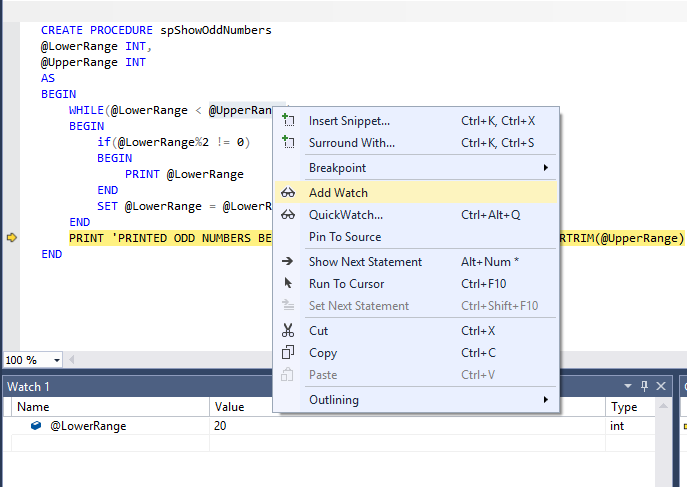
To add a variable to the Watch window, simply select the variable, right click and then select “Add Watch” as shown in the following screenshot:
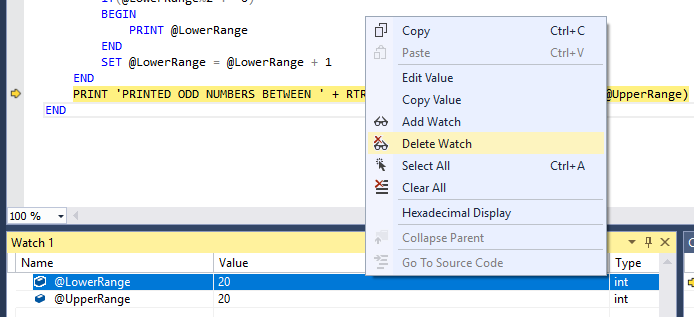
Similarly, to remove a variable, right-click the name of the variable in the Watch window and click “Delete Watch” from the list of options. As shown below:
The Call Stack
The Call Stack, as the name suggests, displays the stack of calls that have been executed up to the current point.
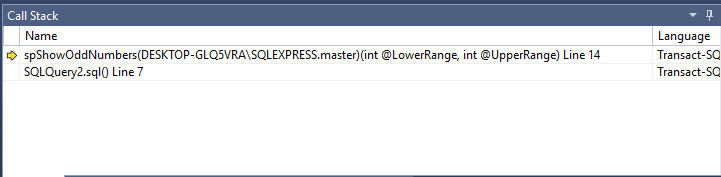
The first line of the Call Stack in the figure above, tells us that currently the spShowOddNumbers stored procedure is being executed and at the moment the debugger is at line 14 of the file that contains this stored procedure. The second line indicates that this stored procedure was called from the script at Line 7 of the SQLQuery2.sql file.
The Immediate Window
The Immediate window is similar to the console window. For example, you can perform mathematical operations within the Immediate window, check for the values of variables, etc. The following screenshot contains an example of an immediate window.
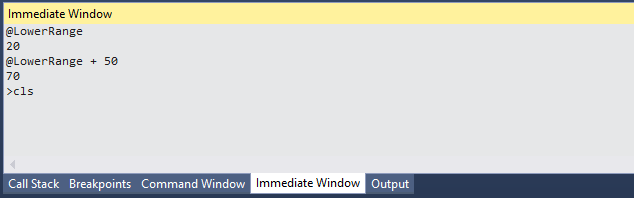
Note: cls command clears the immediate window!
Breakpoints
A breakpoint is one of the most commonly used debugging tools in any programming language. Breakpoint lets you specify the location where you want your debugger to stop executing the code. They come particularly in handy when you don’t want to debug all the lines of code, rather you want to check the status of variables at specific locations in your code.
To put a breakpoint in your code, simply right click on the grey area to the left side of the line of the script where you want to put your breakpoint. Alternatively, pressing F9 will automatically add a breakpoint to the line. Pressing the F9 key again will remove the breakpoint.
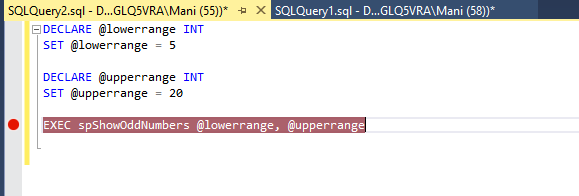
You can see in the figure above, that a breakpoint has been added to the line that executes the “spShowOddNumbers” stored procedure in SQL Server. Now, debug this script. You will see that the debugger will start at first line of the script.
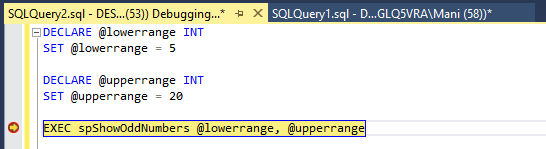
Now press ALT + F5 or go to the debug menu again and click Debug -> Continue. You will see that instead of debugging the next line, the debugger will jump straight to the nearest line with the breakpoint.
You can also create conditional breakpoints. Conditional breakpoints are hit only when specified conditions are met.
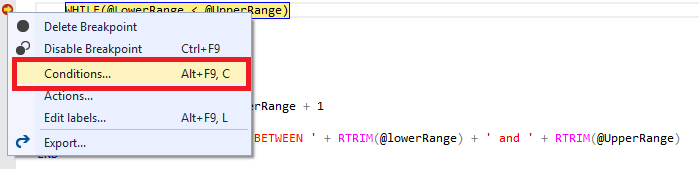
To specify a condition on the breakpoint, simply right click the breakpoint and select “Conditions” as shown in the figure below:
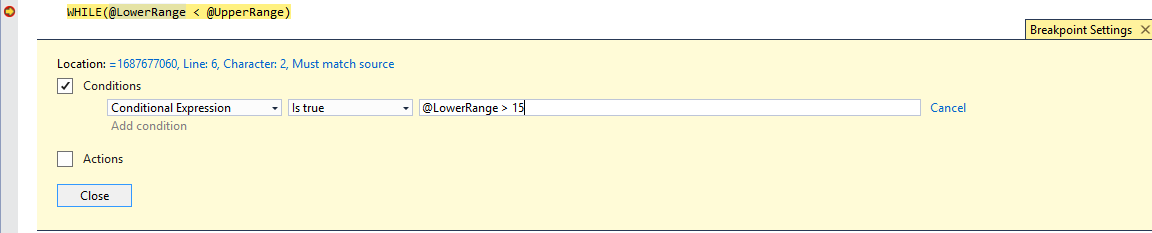
A new window will be opened where you can specify the conditions to be satisfied before a breakpoint can hit. If you want this breakpoint to only be hit when @LowerRange is greater than 15, you could add this as condition, as shown in the image below:
Conclusion
In this article, we discussed what different options does Microsoft SQL Server Management Studio provides for debugging a script or stored procedure in SQL Server.
Other great articles from Ben
| How to use SQL Server built-in functions and create user-defined scalar functions |
| How To Use Window Functions |
| Debugging stored procedures in SQL Server Management Studio (SSMS) |

View all posts by Ben Richardson
- Working with the SQL MIN function in SQL Server - May 12, 2022
- SQL percentage calculation examples in SQL Server - January 19, 2022
- Working with Power BI report themes - February 25, 2021