

This article will explore the process to capture deadlock XML and deadlock graphs for AWS RDS SQL Server databases.
Introduction
As a database professional, you confront the performance issues with databases. It might be due to a lack of indexes, improper indexes, poorly written T-SQL statements, outdated statistics, blocking, or deadlocks. It is essential to monitor the deadlocks in a SQL database irrespective of hosting on-premises or Cloud infrastructure.
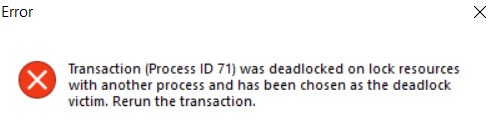
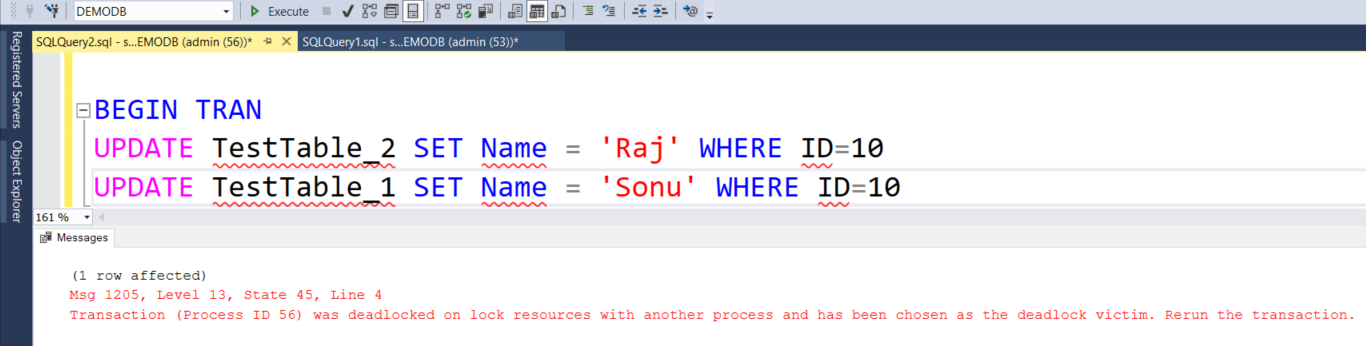
Usually, we receive the following error in an application if SQL Server kills a process as the deadlock victim.
You might be familiar with capturing deadlock XML and graphs for an on-premises SQL Server database. However, if you plan to migrate your resources to AWS cloud-managed service – RDS, you might not be familiar with the process to capture deadlock on AWS RDS SQL Server.
Before we move further, I suggest you go through the following articles and become familiar with SQL Server deadlocks.
- SQL Server deadlock definition and Overview
- Monitoring SQL Server deadlocks using the system_health extended event
In the on-premise SQL Server instance, we enable the trace flag 1222 as the start-up parameter and view the deadlocks data. We can view deadlock information in SQL Server error logs, capture deadlock graphs through SQL profile, extended events, or ring buffer.
AWS RDS SQL Server is a managed Database Service, and you can quickly set up, manage, operate, scale the resources in the cloud for SQL Server.
You might face deadlock issues in AWS RDS as well. It is a managed service, and you do not have full administrative permissions on the server. For example, the few restrictions are as below.
- You cannot take the remote desktop connection to an AWS RDS SQL Server instance
- We cannot use start-up parameters using the SQL Server Configuration Manager like an on-premise SQL instance
- You do not have directory level access for your data files, log files, event logs, or error logs
- AWS provides a specific stored procedure for performing administrative tasks. You cannot use all native stored procedures in the RDS instance
Therefore, you might have a question: How do we identify and diagnose deadlocks in AWS RDS SQL Server.
Environment details
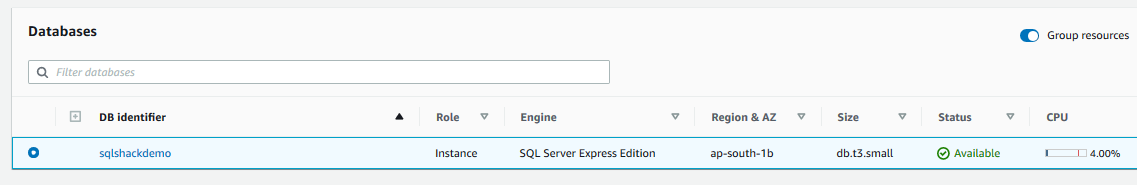
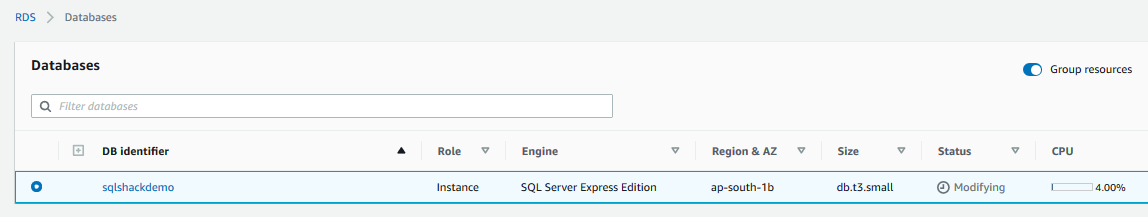
In this article, we use an RDS instance [SQLShackDemo] version 15.0.4043, as shown below.
- DB Identifier: [SQLShackDemo]
- Engine: SQL Server Express Edition
- Region: ap-south-1b
- Status: Available
If you do not have an active RDS database, you can refer to this AWS RDS and configure an instance before proceeding further.
SQL Server deadlocks in AWS RDS SQL Server
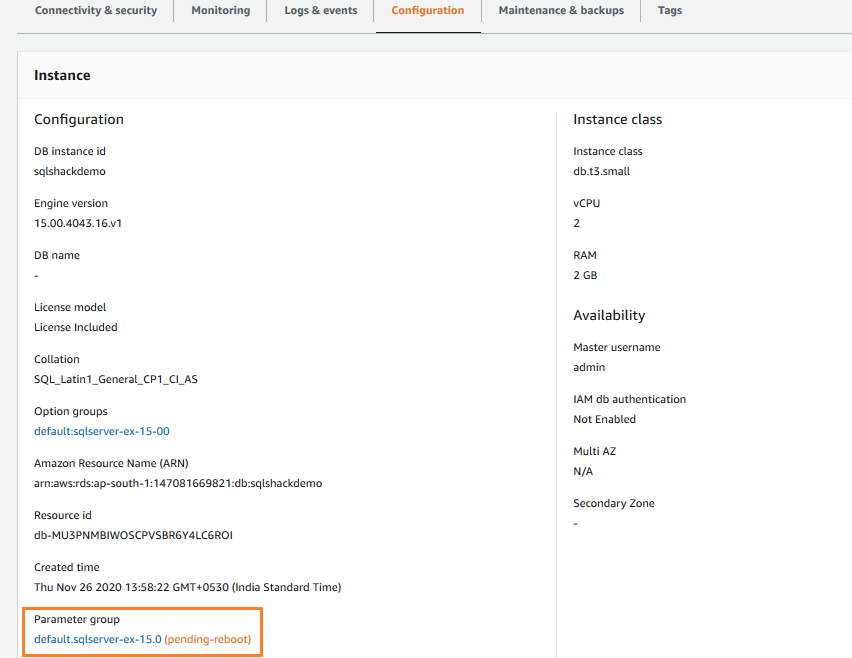
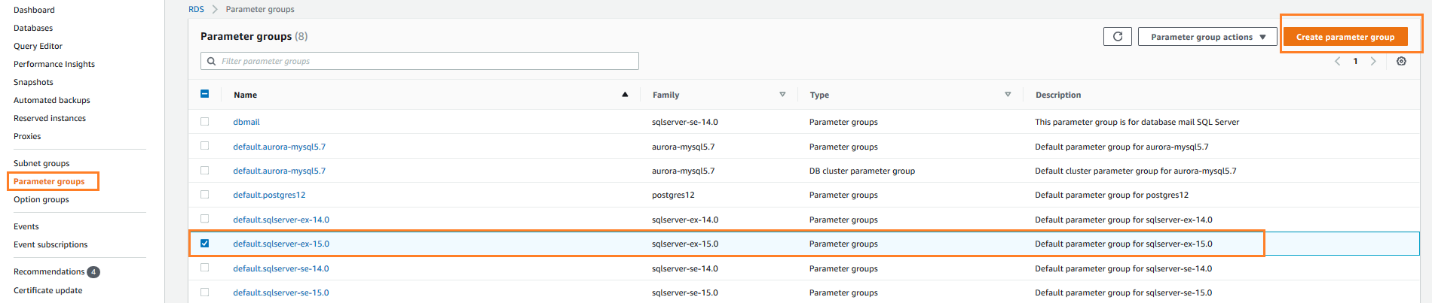
AWS RDS instance uses a parameter group for the default configuration of a SQL instance. This parameter group varies depending upon the SQL Server version, edition. In the RDS dashboard, to view the parameter group, click on the Configuration and note-down the parameter group.
Here, my parameter group for SQL engine 15.0.4043.16.v1 and express edition is default.sqlserver-ex-15.0.
If you require details on a specific parameter group, Navigate to the parameter groups and open them and you get default configurations.
We cannot modify a default parameter group. Therefore, to enable the deadlock trace flag in the RDS instance, we modify a parameter configuration, go to the RDS dashboard, select the existing parameter group and click on the Create Parameter group.
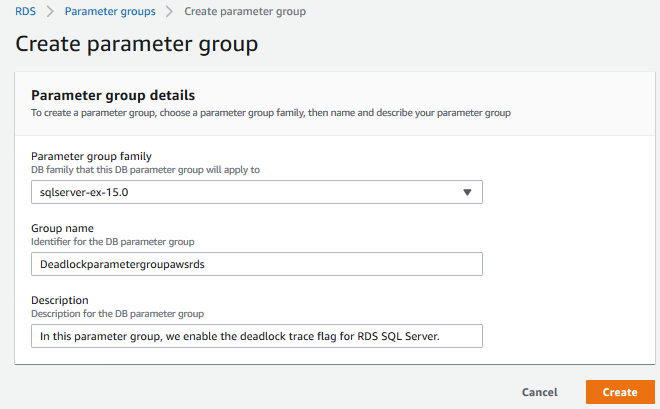
In the create parameter group page, enter a group name and description.
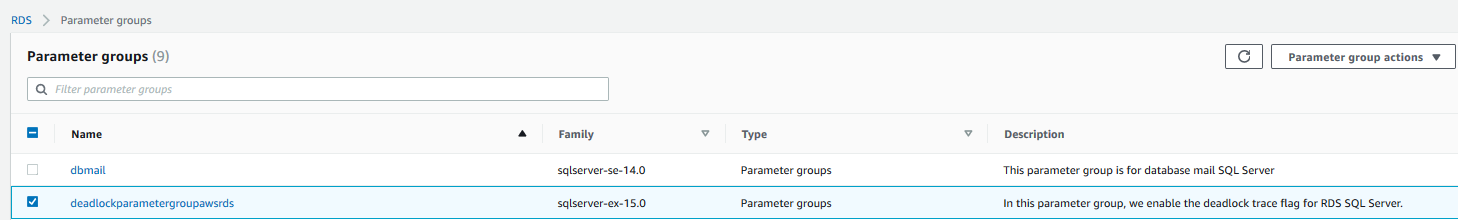
As shown below, we have a new parameter group in the RDS dashboard.
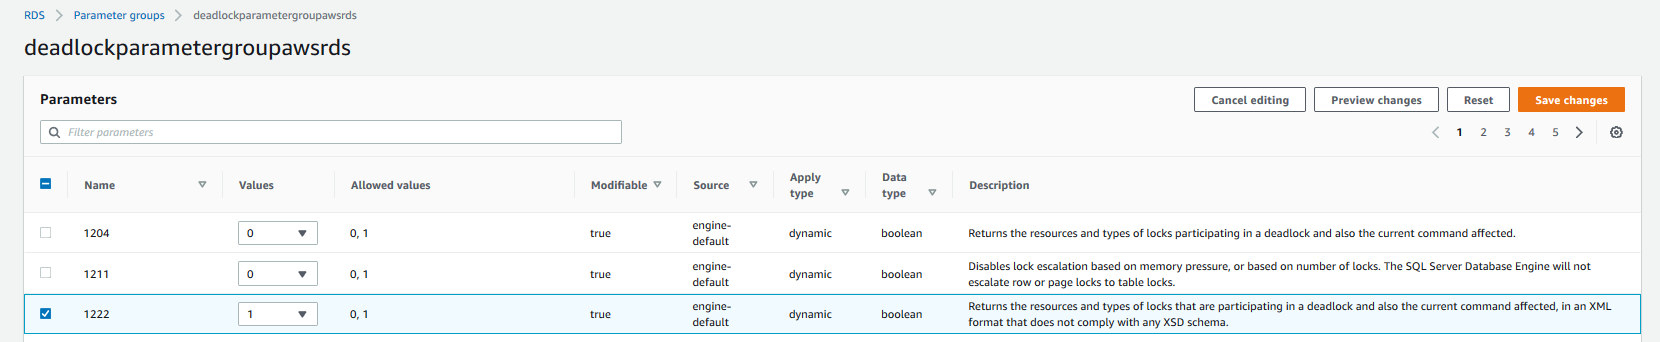
By default, the new parameter group is a copy of configurations from a default parameter group. For capturing deadlocks, edit the newly created parameter group and modify the value for trace flag 1222 from zero to one. It enables the trace flag parameter in the new parameter group.
Save the changes. We have currently modified the trace flag configuration in the newly created parameter group; however, our RDS instance still runs with the default parameter group. Therefore, edit your AWS RDS SQL Server instance, select a new parameter group from the drop-down values, and assign the new parameter group in the database options section.
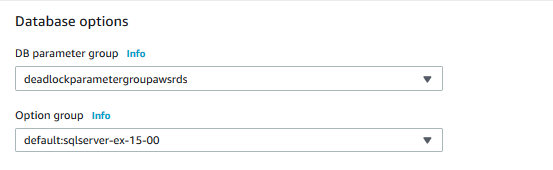
You can choose to activate this new parameter group during the maintenance window or apply the changes immediately for the RDS instance.
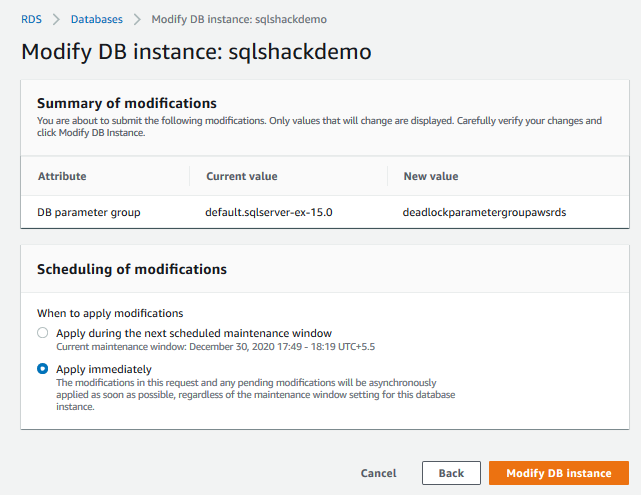
It starts modification for your RDS instance. We need to wait for the instance status to become available.
Simulate SQL Server deadlocks for the RDS database
Once the RDS instance is an available state with a parameter group for capturing deadlocks, connect to your RDS instance in the SSMS and simulate a deadlock by following the code in the Monitoring SQL Server deadlocks using the system_health extended event.
View SQL Server deadlocks data for AWS RDS SQL Server
To view the deadlock information, click on the RDS instance in the AWS Web Console and navigate to Logs & events. It displays a list of SQL Server error logs.
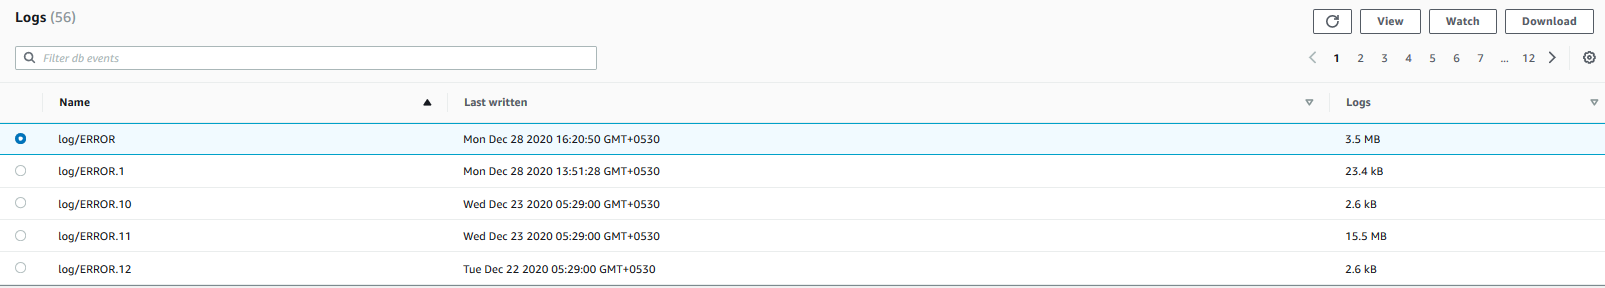
Select the latest log and click on View. It displays the error logs content in a separate window.
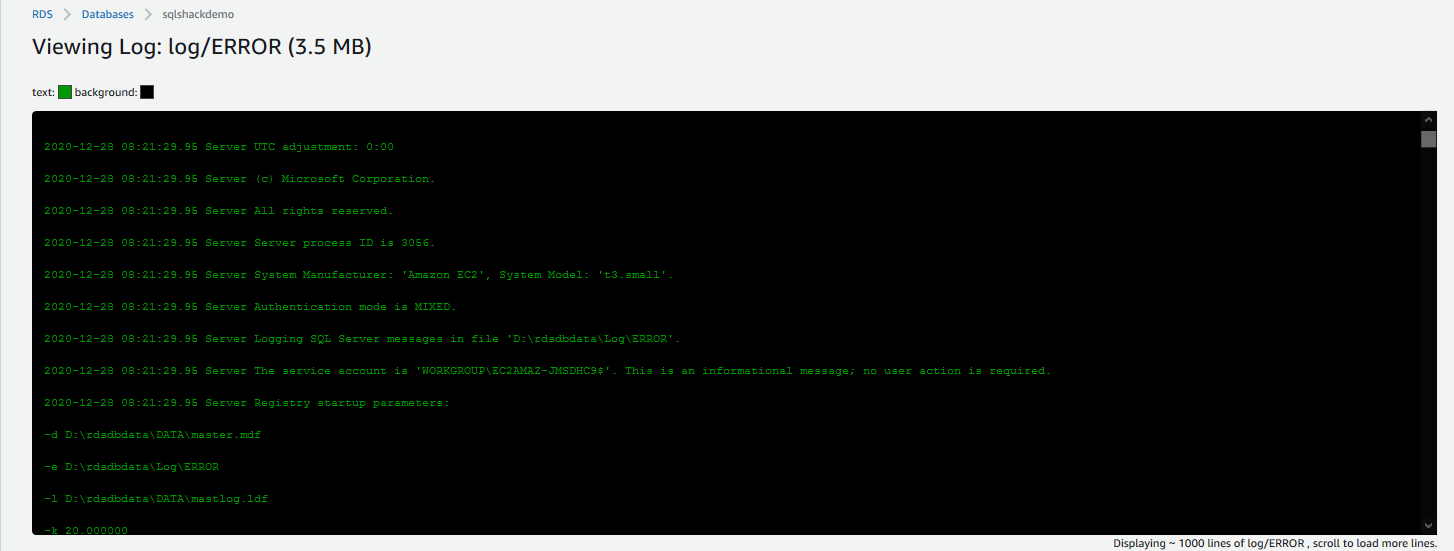
You can scroll down in the logs to find a specific message. The problem with viewing logs here is that you cannot search for a specific keyword. For example, we are interested in the deadlock-related information, but we need to scroll for each line and look for the contents.
Therefore, you can go back, select the latest logs and download them in a text format on your local system. Open the log in notepad or text-editor such as Visual Studio Code.
-
Press Ctrl + F and search for 1222. You can verify that trace flag 1222 is enabled for your AWS RDS SQL Server

-
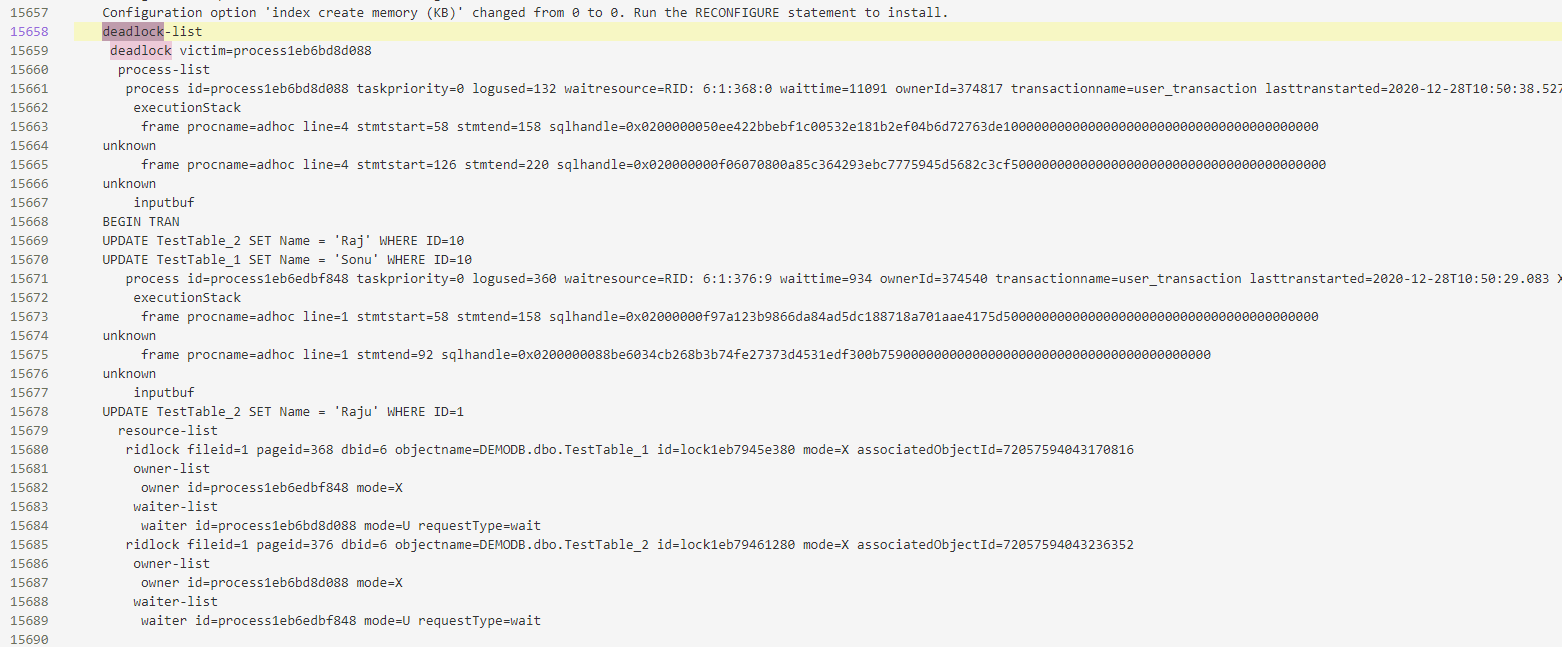
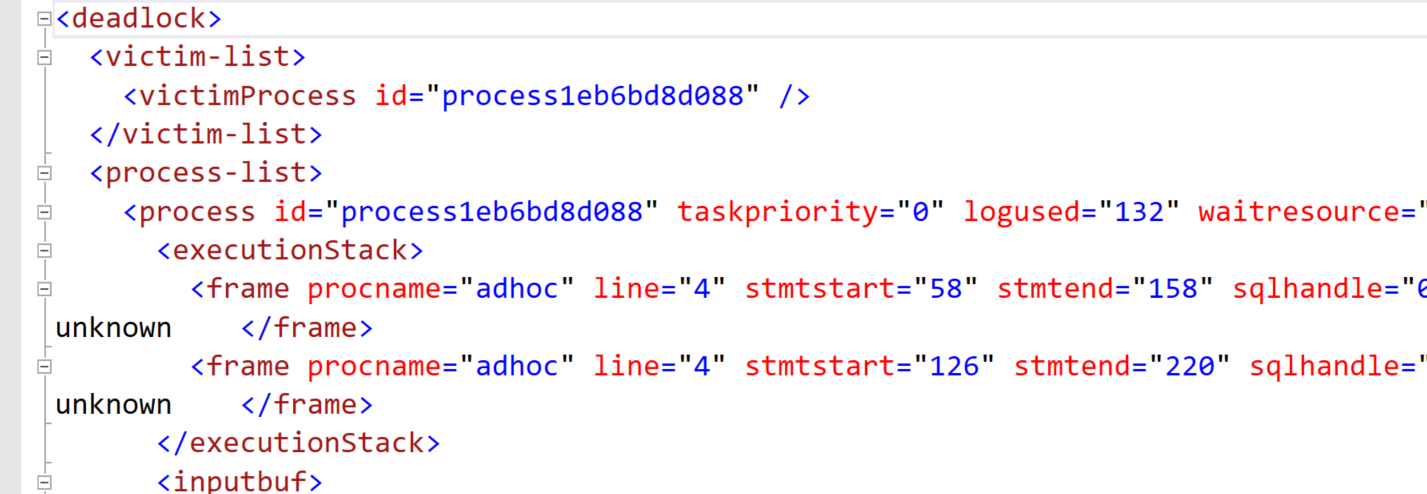
Search for keyword Deadlock, and you get deadlock XML as shown below

Generate deadlock graph in AWS RDS SQL Server
In the above step, we get deadlock XML in the SQL Server error log. It is a challenging task to get the deadlock information from the XML. Therefore, most of the time, DBA prefers deadlock graphs that clearly show you the deadlock victim, deadlock winner, and graphically processes information.
In the article, Monitoring SQL Server deadlocks using the system_health extended event, we discussed the usage of system_health extended events for capturing deadlock graphs. In the highlighted article, we used the on-premise SQL Server for deadlock monitoring.
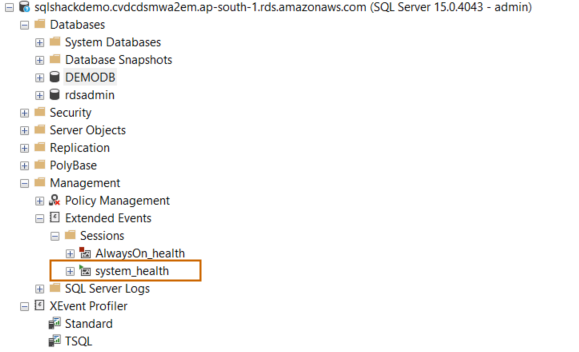
While preparing this article, I thought we have a system_health extended event for the AWS RDS SQL Server. To verify this, connect to the RDS instance in SSMS and navigate to Extended Events -> Sessions. Here, you can see the system_health extended event session is in a running state.
To check the captured monitoring data, expand the System_health session, right-click on the package0_event_file and choose View Target Data. You can filter the events, and configure required columns to view the deadlock graph in this window.
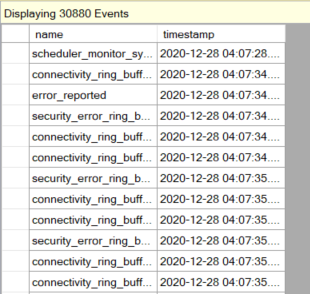
However, I would suggest using the T-SQL for fetching required data. In the below query, we use the function sys.fn_xe_file_target_read_file() for the system_health extended event-related file and capture the deadlock graph.
|
1 2 3 4 5 6 7 8 9 10 |
WITH DeadlockGraph AS (SELECT CAST(t1.event_data AS XML) AS Event_Data FROM sys.fn_xe_file_target_read_file(N'system_health*.xel', NULL, NULL, NULL) AS t1 ) SELECT tl.deadlockgraph FROM ( SELECT t2.query('.') AS deadlockgraph FROM DeadlockGraph CROSS APPLY event_data.nodes('(/event/data/value/deadlock)') AS d(t2) ) AS tl; |
It gives the deadlock graph XML as shown below.

Click on the hyperlink in the output XML, view the XML and save the file in XSD format.
Now, you can open the XSD file in SSMS to view the deadlock graph.
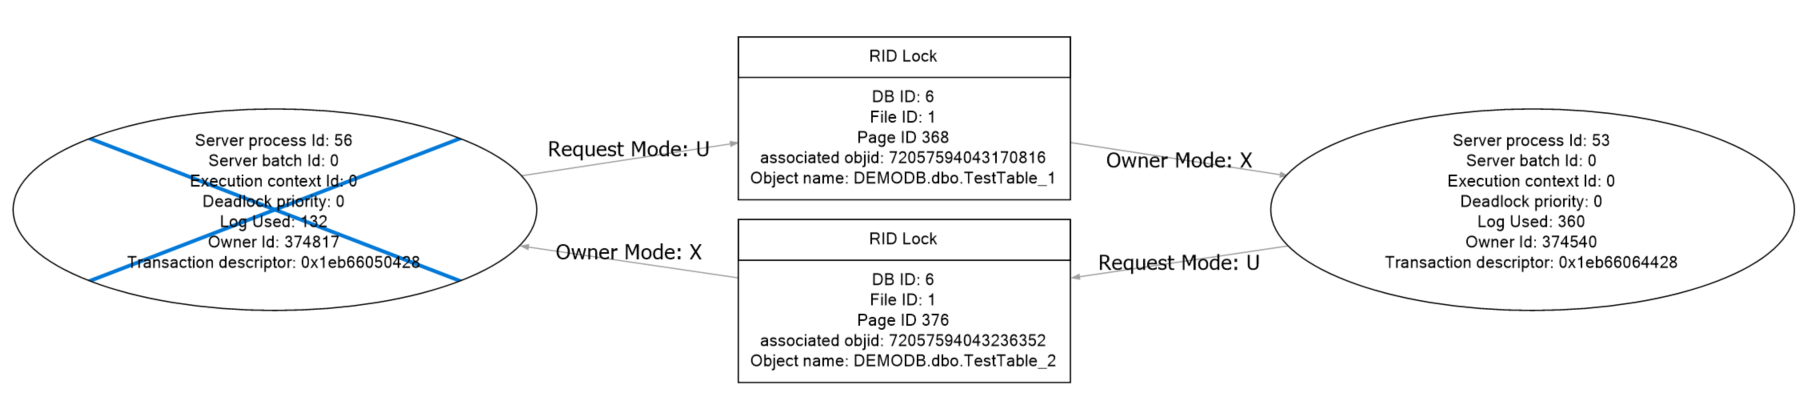
You can refer to the article, Understanding the SQL Server Deadlock Graph’s graphical representation for getting details from a deadlock graph.
Conclusion
In this article, we explored capturing deadlocks in AWS RDS SQL Server. It is necessary to capture, analyze and fix the deadlocks for RDS as well. Therefore, you should be familiar with the process to gather information in both on-premises and cloud-based instances. Once you have collected deadlocking processes, you can analyze your workload, T-SQL’s, indexes to minimize its impact.

I am the author of the book "DP-300 Administering Relational Database on Microsoft Azure". I published more than 650 technical articles on MSSQLTips, SQLShack, Quest, CodingSight, and SeveralNines.
I am the creator of one of the biggest free online collections of articles on a single topic, with his 50-part series on SQL Server Always On Availability Groups.
Based on my contribution to the SQL Server community, I have been recognized as the prestigious Best Author of the Year continuously in 2019, 2020, and 2021 (2nd Rank) at SQLShack and the MSSQLTIPS champions award in 2020.
Personal Blog: https://www.dbblogger.com
I am always interested in new challenges so if you need consulting help, reach me at rajendra.gupta16@gmail.com
View all posts by Rajendra Gupta
- Understanding PostgreSQL SUBSTRING function - September 21, 2024
- How to install PostgreSQL on Ubuntu - July 13, 2023
- How to use the CROSSTAB function in PostgreSQL - February 17, 2023