
In this article, we will learn how to analyze the performance of Power BI Desktop reports using the Performance Analyzer.
Introduction
Data reporting is a large area of data consumption practice. As the variety of data sources keep growing, so does the volume and variety of data. With the rapid adoption of the cloud, the trajectory of data from on-premises has moved towards the cloud. With tools like Power BI Desktop, Tableau Desktop, and others, users have the option to author reports locally and then publish them on the cloud or host it on their on-premises infrastructure as well. In summary, with the array of options available in the industry, data and reports have become very federated in terms of hosting, which in the pre-cloud times used to be mostly co-hosted in near proximity. Due to this federated nature of hosting, and the number of visual controls that fetch data from different sources of data, performance becomes a very important consideration to monitor as various factors can cause latency in report performance. When applications are hosted on a server and accessed from a client machine, if one wants to assess the latency or the page loading experience for an end-user component by component, reverse proxy tools like Fiddler are/were being used. A similar capability for a report designed is also required when one is designing the report to understand how the different actions on the report as well as data loads from report sources will affect report performance. Power BI Desktop is one of the most popular and fundamental report authoring tools in the Microsoft technology stack.
Analyzing performance of Power BI reports
In this exercise, we need to create a data source and design a report that sources data from this data source and using a feature of Power BI Desktop to analyze the performance of the report. To simulate a realistic example, we need to create a data source on the cloud. Azure Synapse is the data warehouse offering from Microsoft on Azure cloud and typically it hosts a large volume of data. We can use Synapse as the data source for our exercise. It is assumed that one has an Azure cloud account with the required privileges to operate on Azure Synapse and Azure SQL Server service. Assuming this account with the required privileges is in place, navigate to the Azure Synapse service dashboard and create a new instance of the Azure Synapse Analytics service. Azure Synapse has a serverless SQL pool by default. For our scenario, we need to use a dedicated SQL pool. Create a new dedicated SQL pool and populate it with sample data. For the sample data, we just need one table with few records in it which we can use to populate the Power BI report. As the focus of the article is performance analysis of the Power BI report, we would assume that this data source setup is already in place, and we will move forward with the report authoring in Power BI. While we are using Azure Synapse Analytics as the data source, one can use any type of data source support by Power BI. We are using Azure Synapse Analytics just to simulate a real-life scenario.
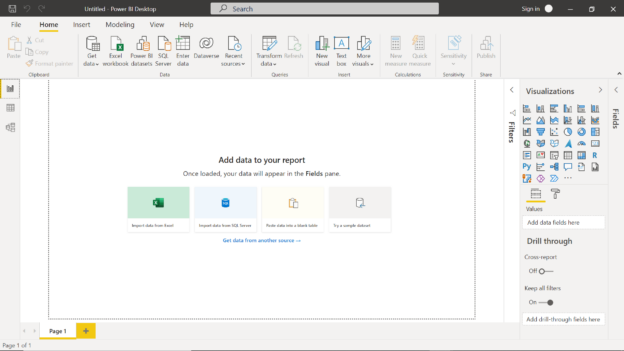
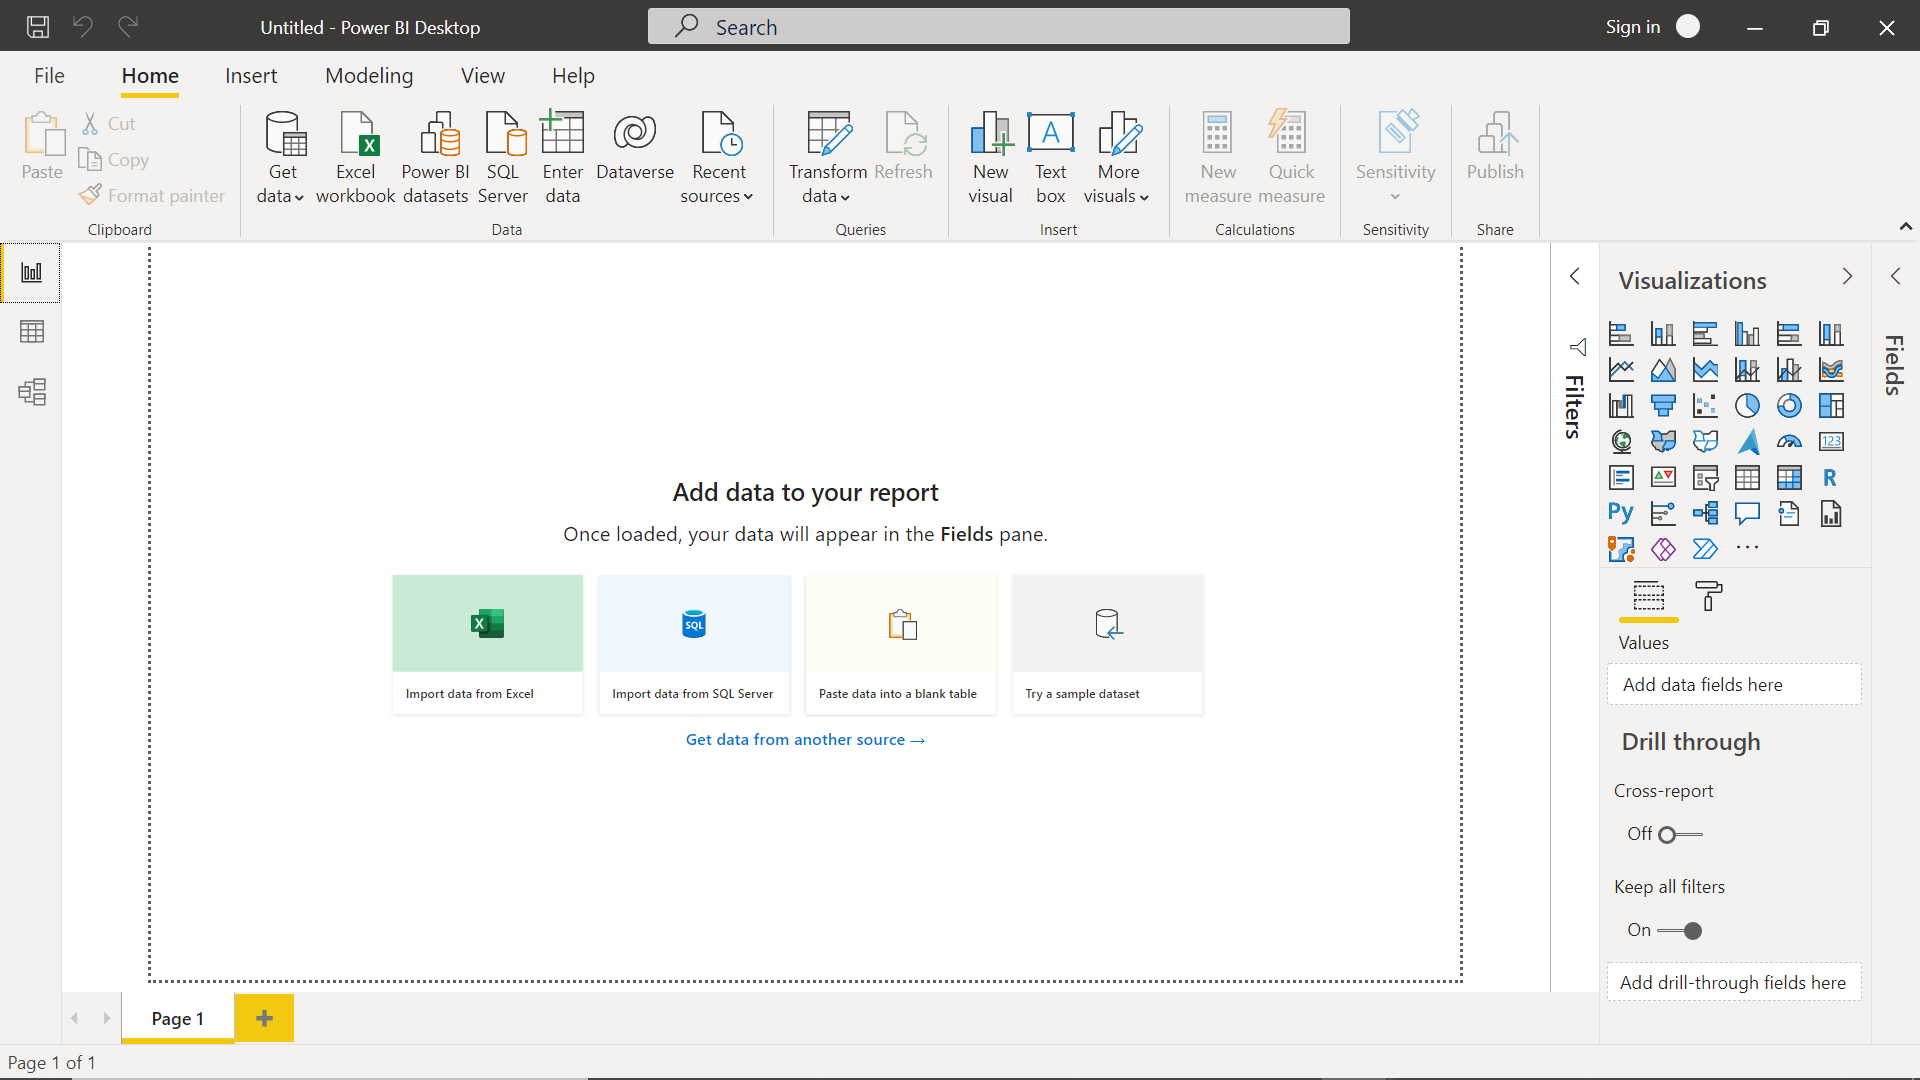
As we intend to author a Power BI report, it is assumed that the Power BI Desktop is already installed and launched on the development machine. The landing screen of the Power BI Desktop would look as shown below.
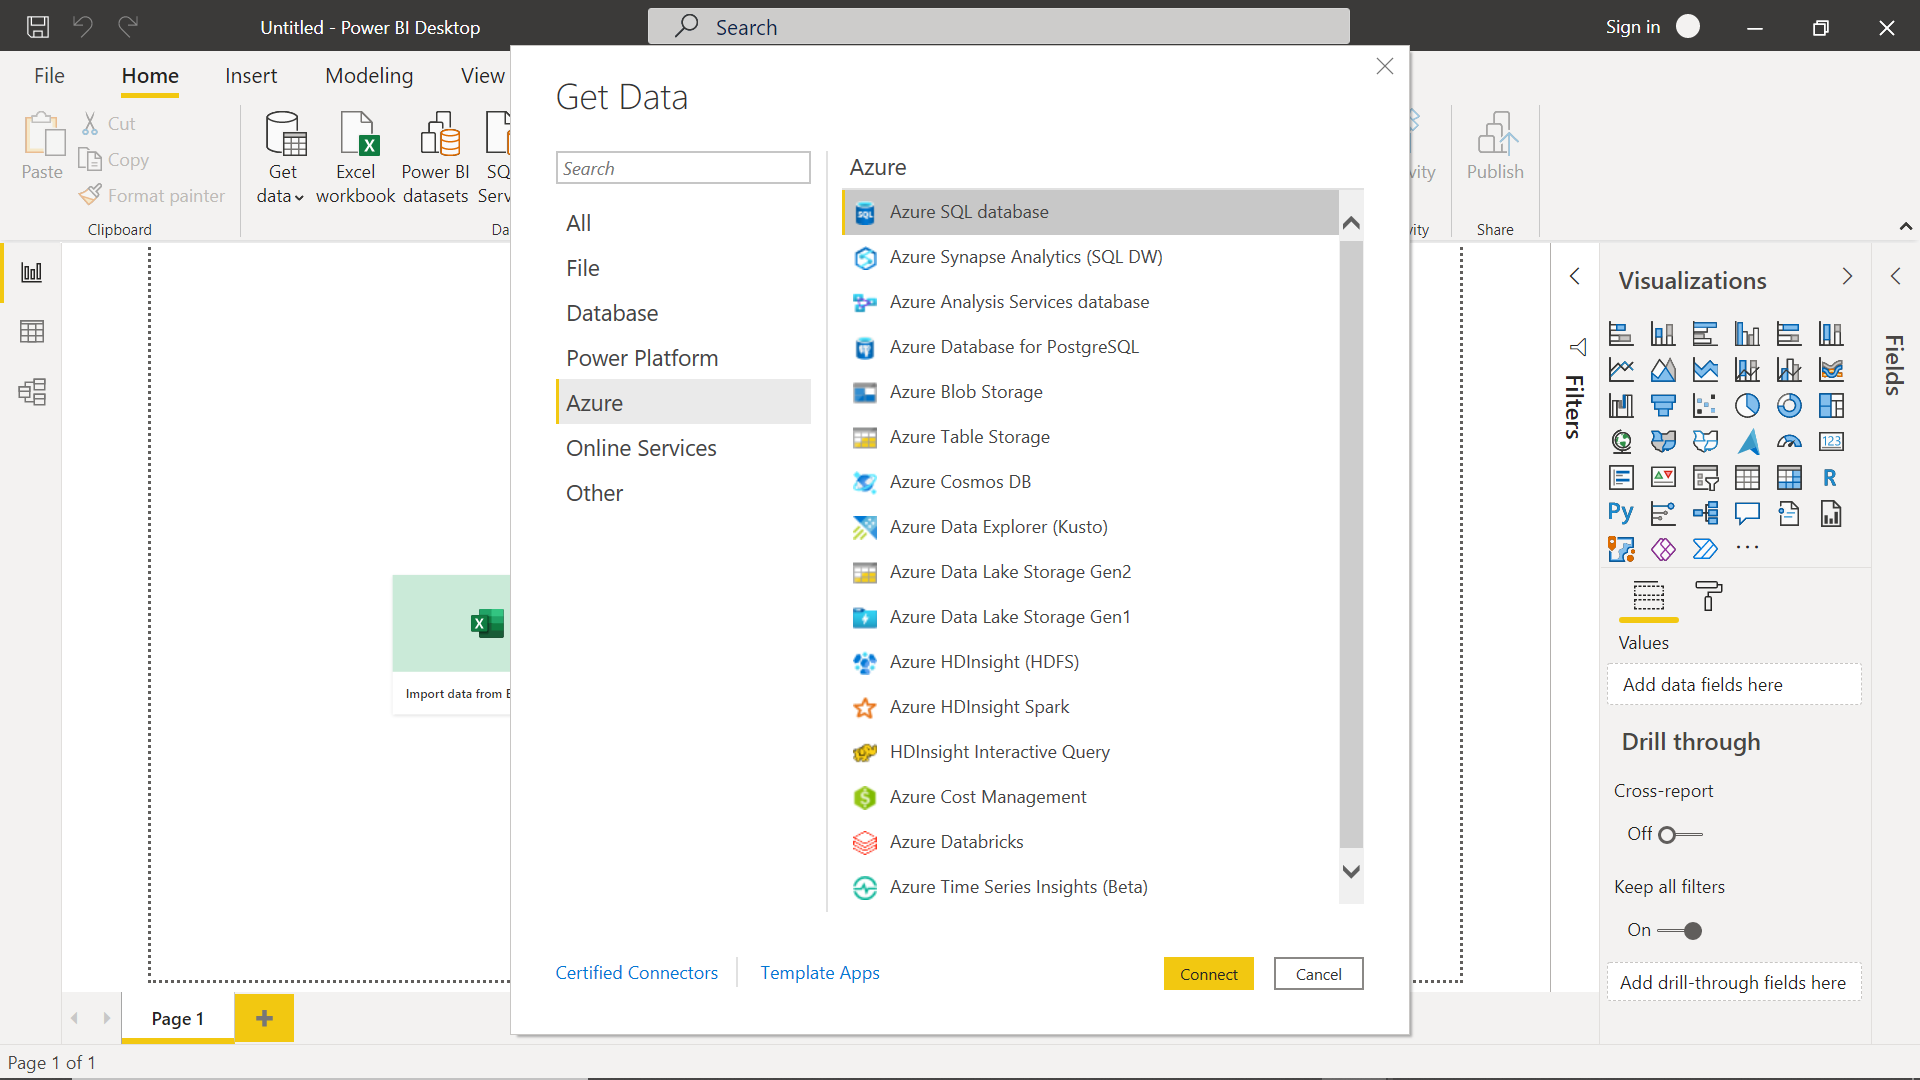
The first task at hand is to source data that we have hosted in the Azure Synapse Analytics service. Click on the Get Data menu to open the different data source options support by Power BI Desktop. Select the Azure Synapse Analytics option and click on the Connect button.
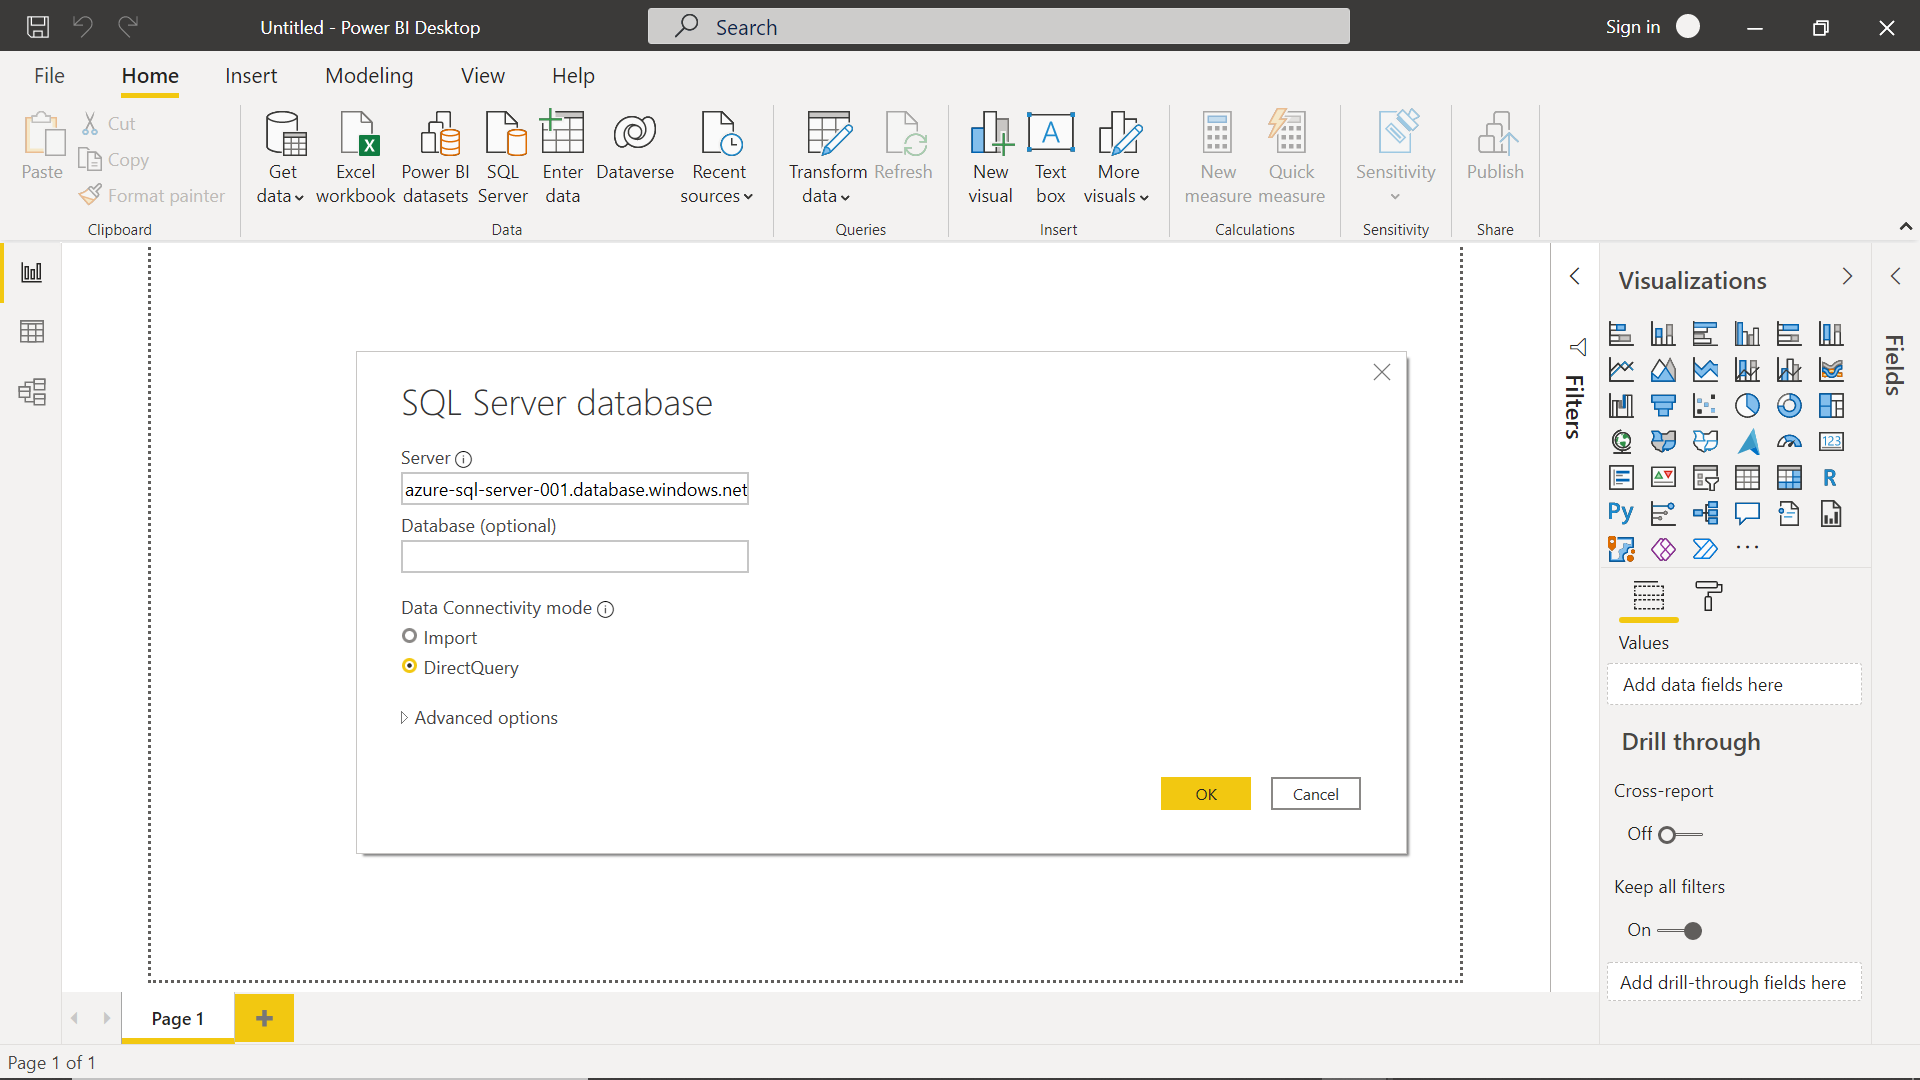
This would pop up a new modal window as shown below where we can provide the server endpoint. We can either use the default method of data connectivity, which is Import. Alternatively, we can also opt to select the DirectQuery mode which will query the actual data source every time instead of importing the data locally in the report. Select the desired option and click on the OK button.
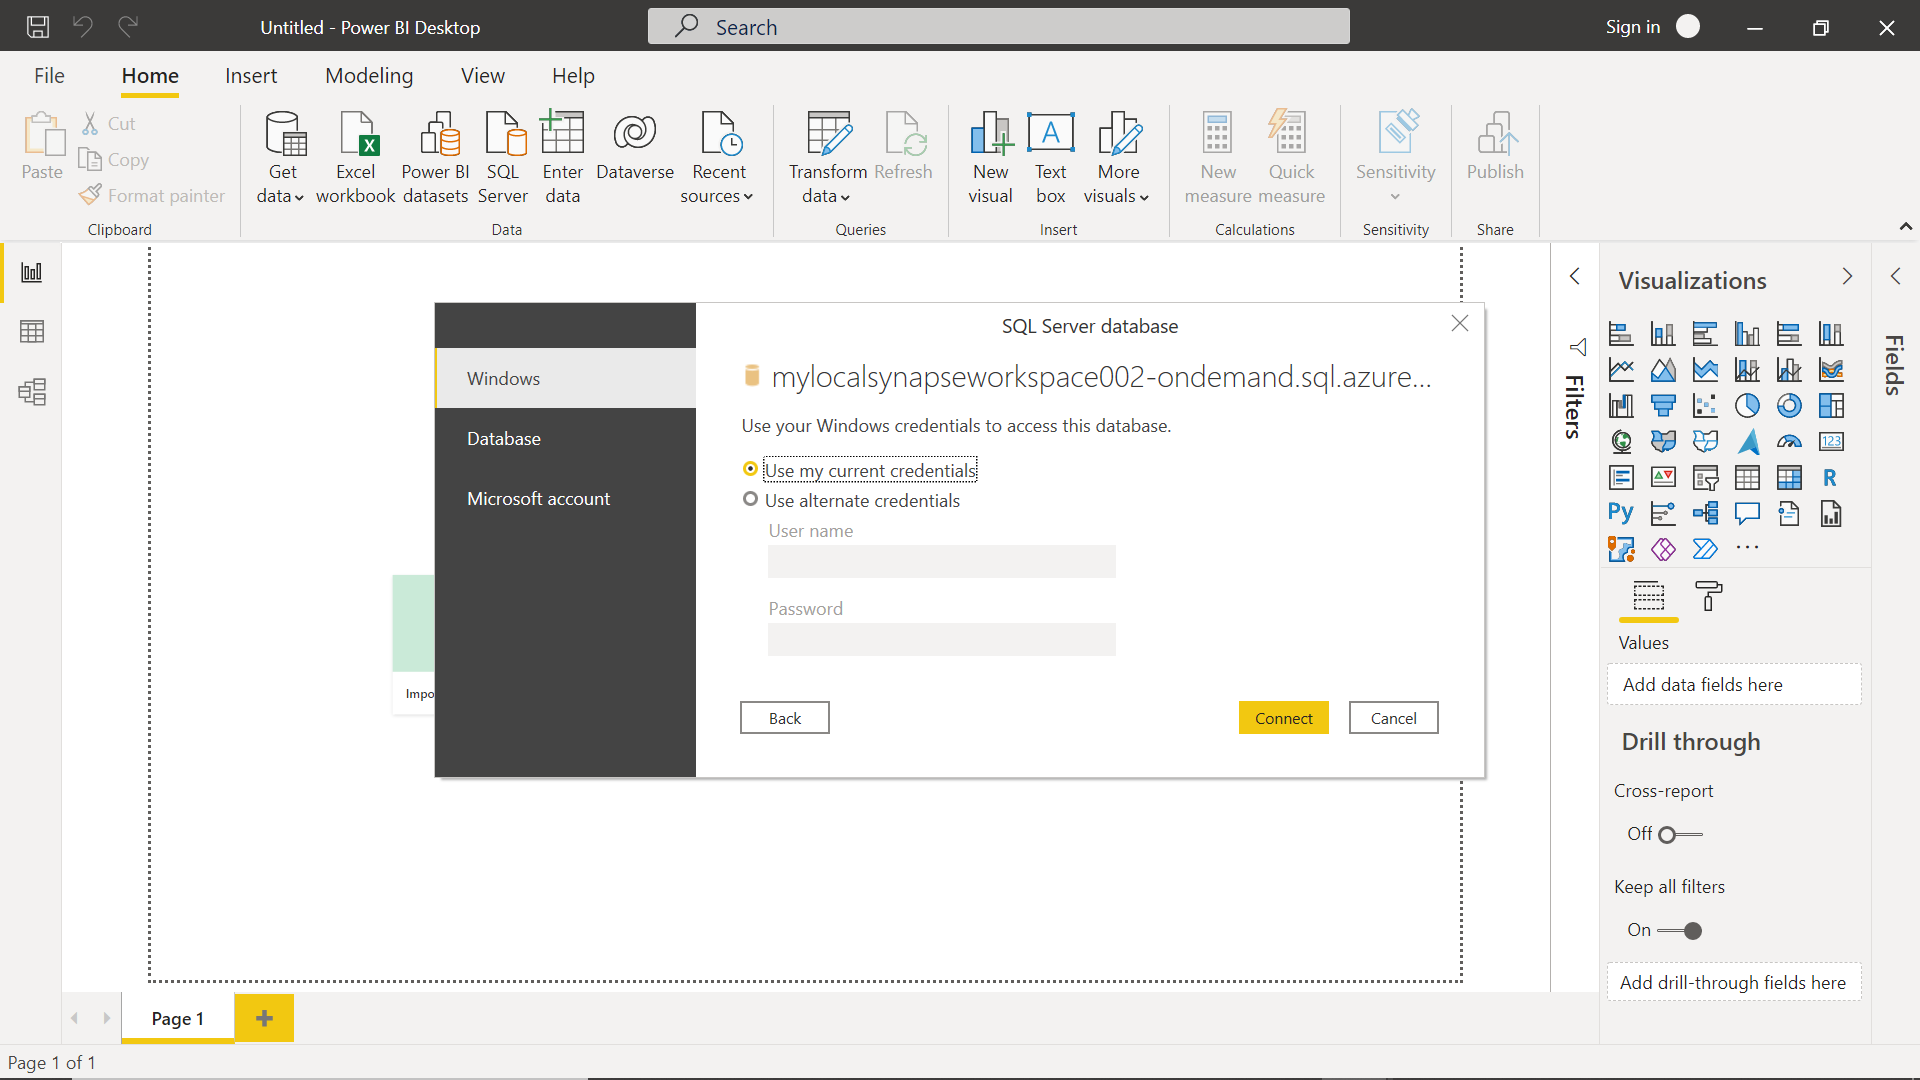
This will bring up the option to provide the credentials using which we intend to connect to the Azure Synapse Analytics instance. Provide the appropriate credentials and click on the Connect button.
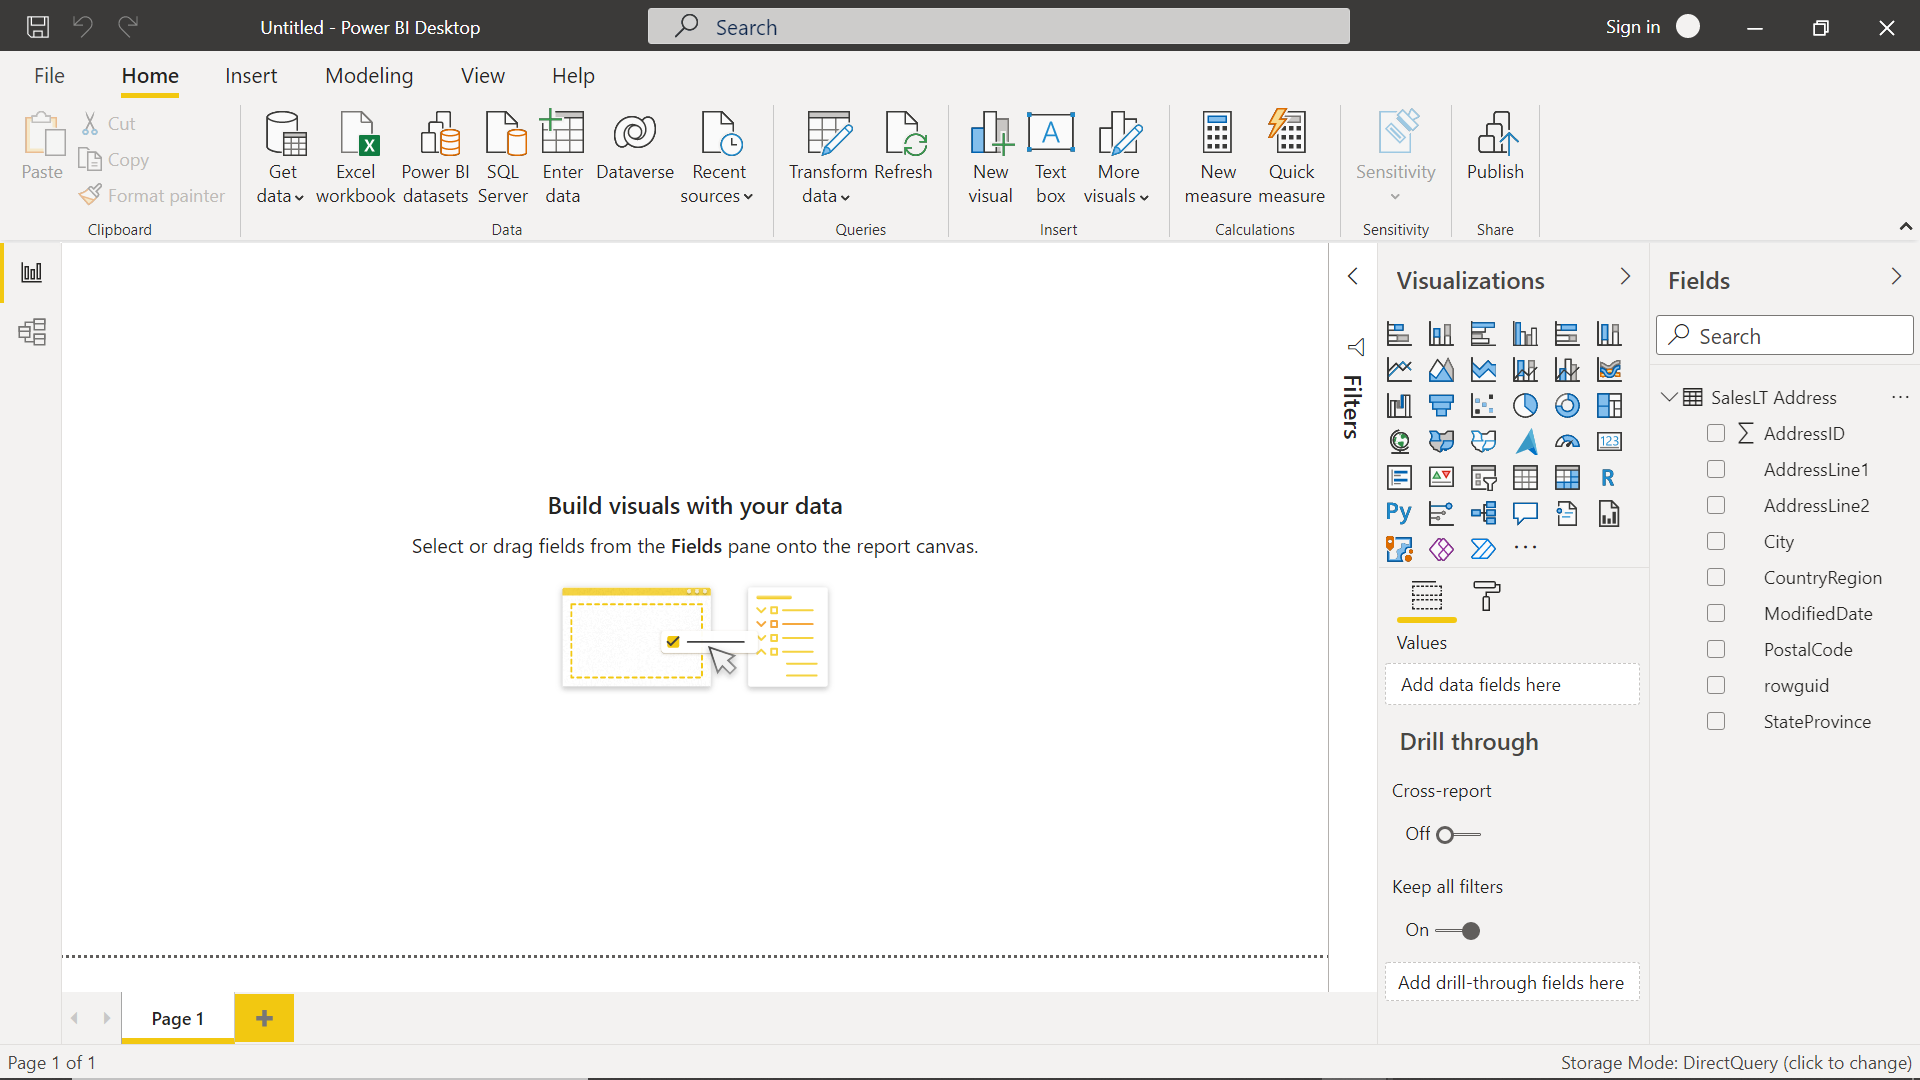
If the connectivity is successful, the data would get imported in the report as we have selected the Import option in this case. As seen below, the fields can be seen in the fields pane which we can use to create reports.
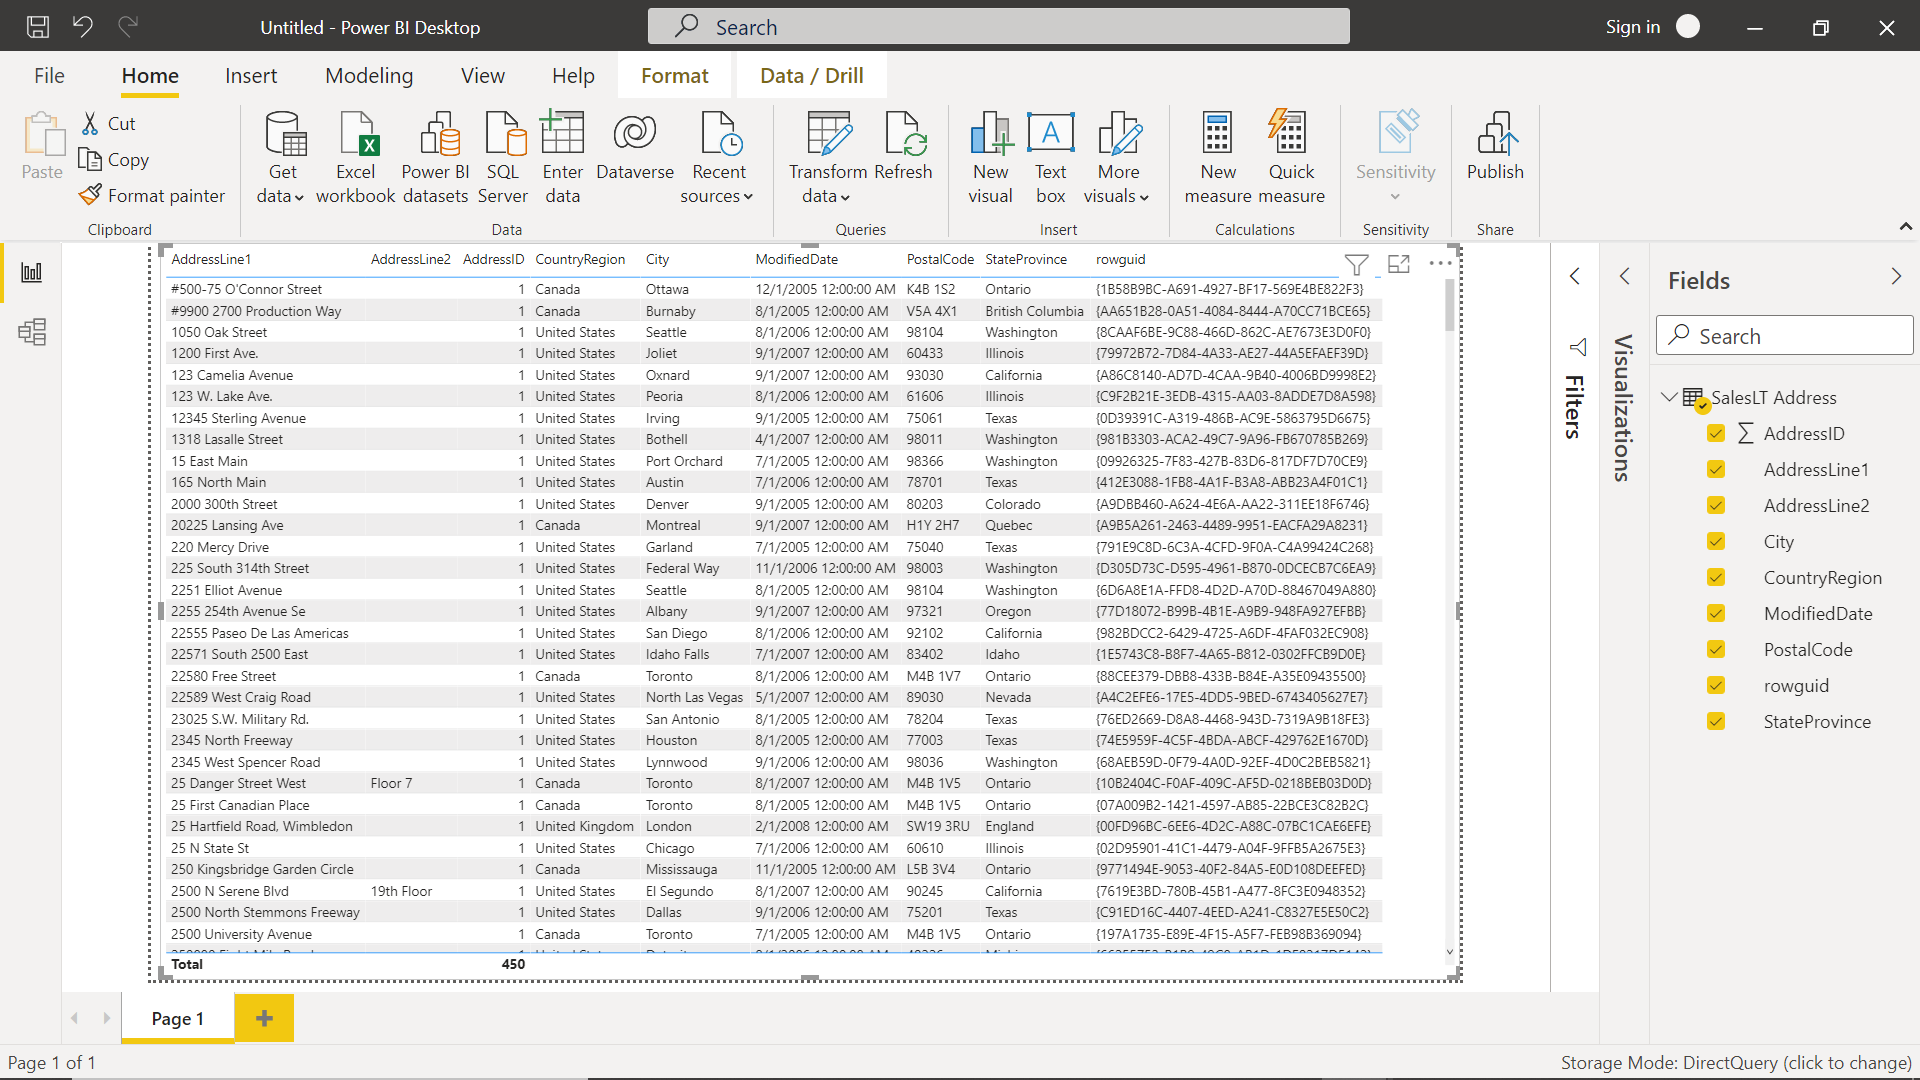
Here, we have source the Address table hosted on the dedicated SQL pool of the Azure Synapse Analytics service. We can simply report this data using a basic visualization like a data table. Click on the table control from the visualization pane, and it would add the table to the report layout. Select the table control on the report layout and select the fields that we intend to show in this data table. Once done, the table populated with the data would look as shown below.
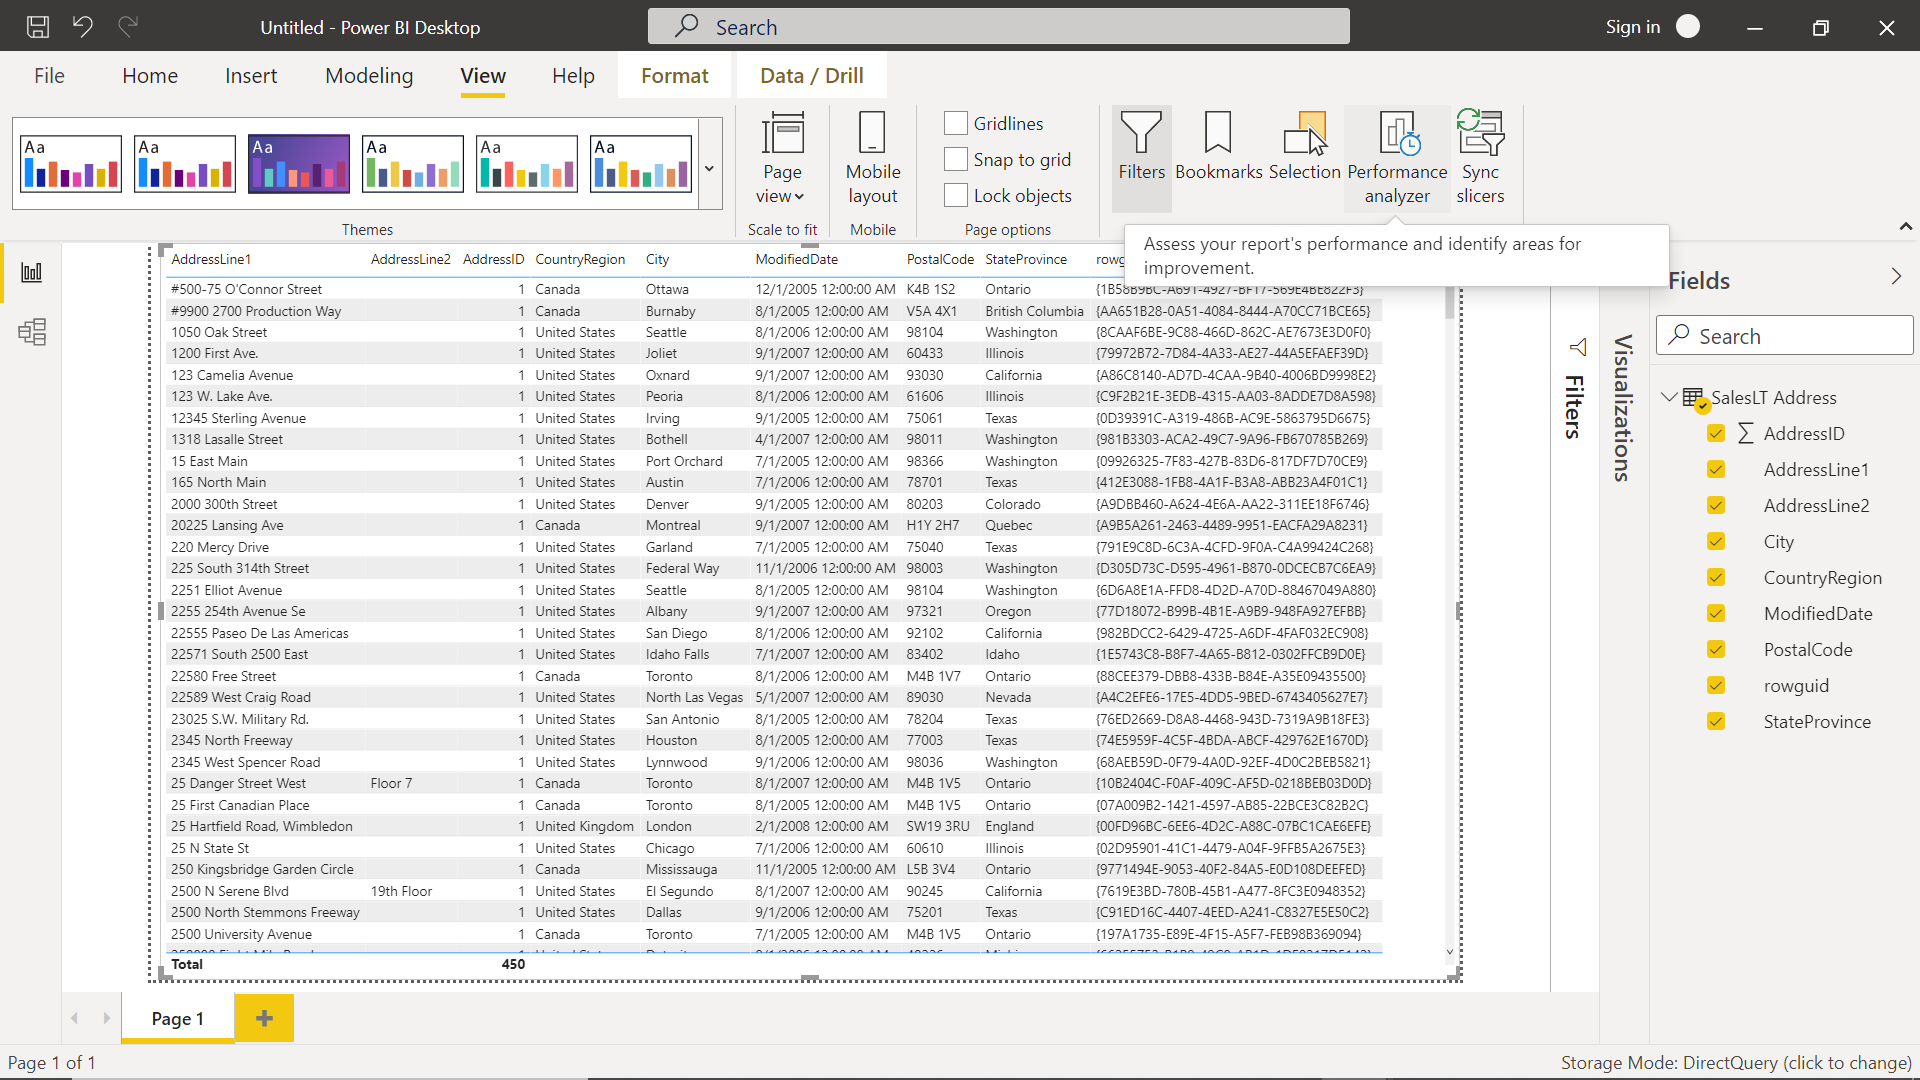
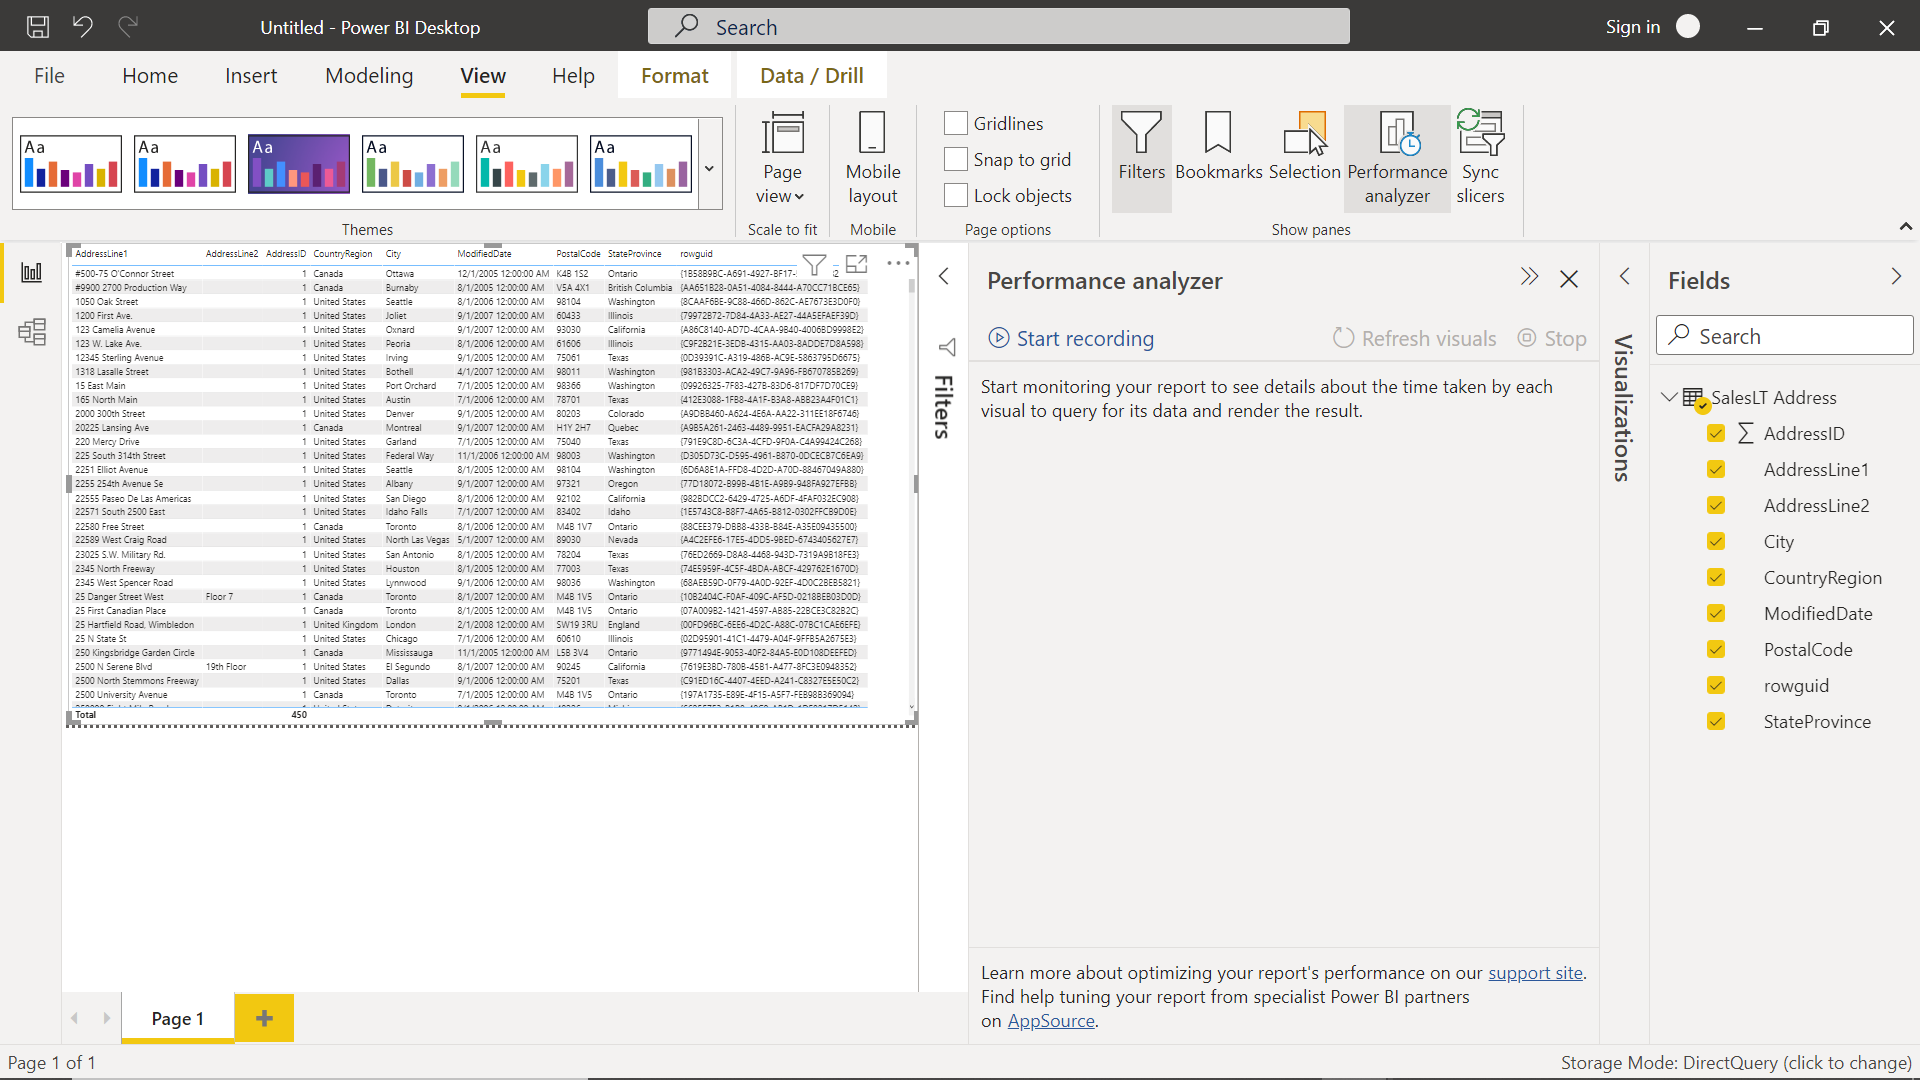
Now that we have sourced the data from the Azure Synapse Analytics instance and the same data is not bound to a data table on the report layout, it’s now time to analyze the performance of this report. We do not need to publish this report on the Azure Power BI service and use external tools to analyze the performance. Power BI Desktop provides an in-built mechanism to analyze the performance of the report. Click on the View menu item and select the Format tab as shown below, and we would be able to find the Performance Analyzer button as shown below. We can use this feature of Power BI Desktop to analyze the performance of Power BI Reports.
When we click on the Performance Analyzer button, it would open a new tab as shown below. We can click on the Start recording button to start recording all the events, logs, DAX queries and everything else that goes on when a report is loading including any actions performed on the report.
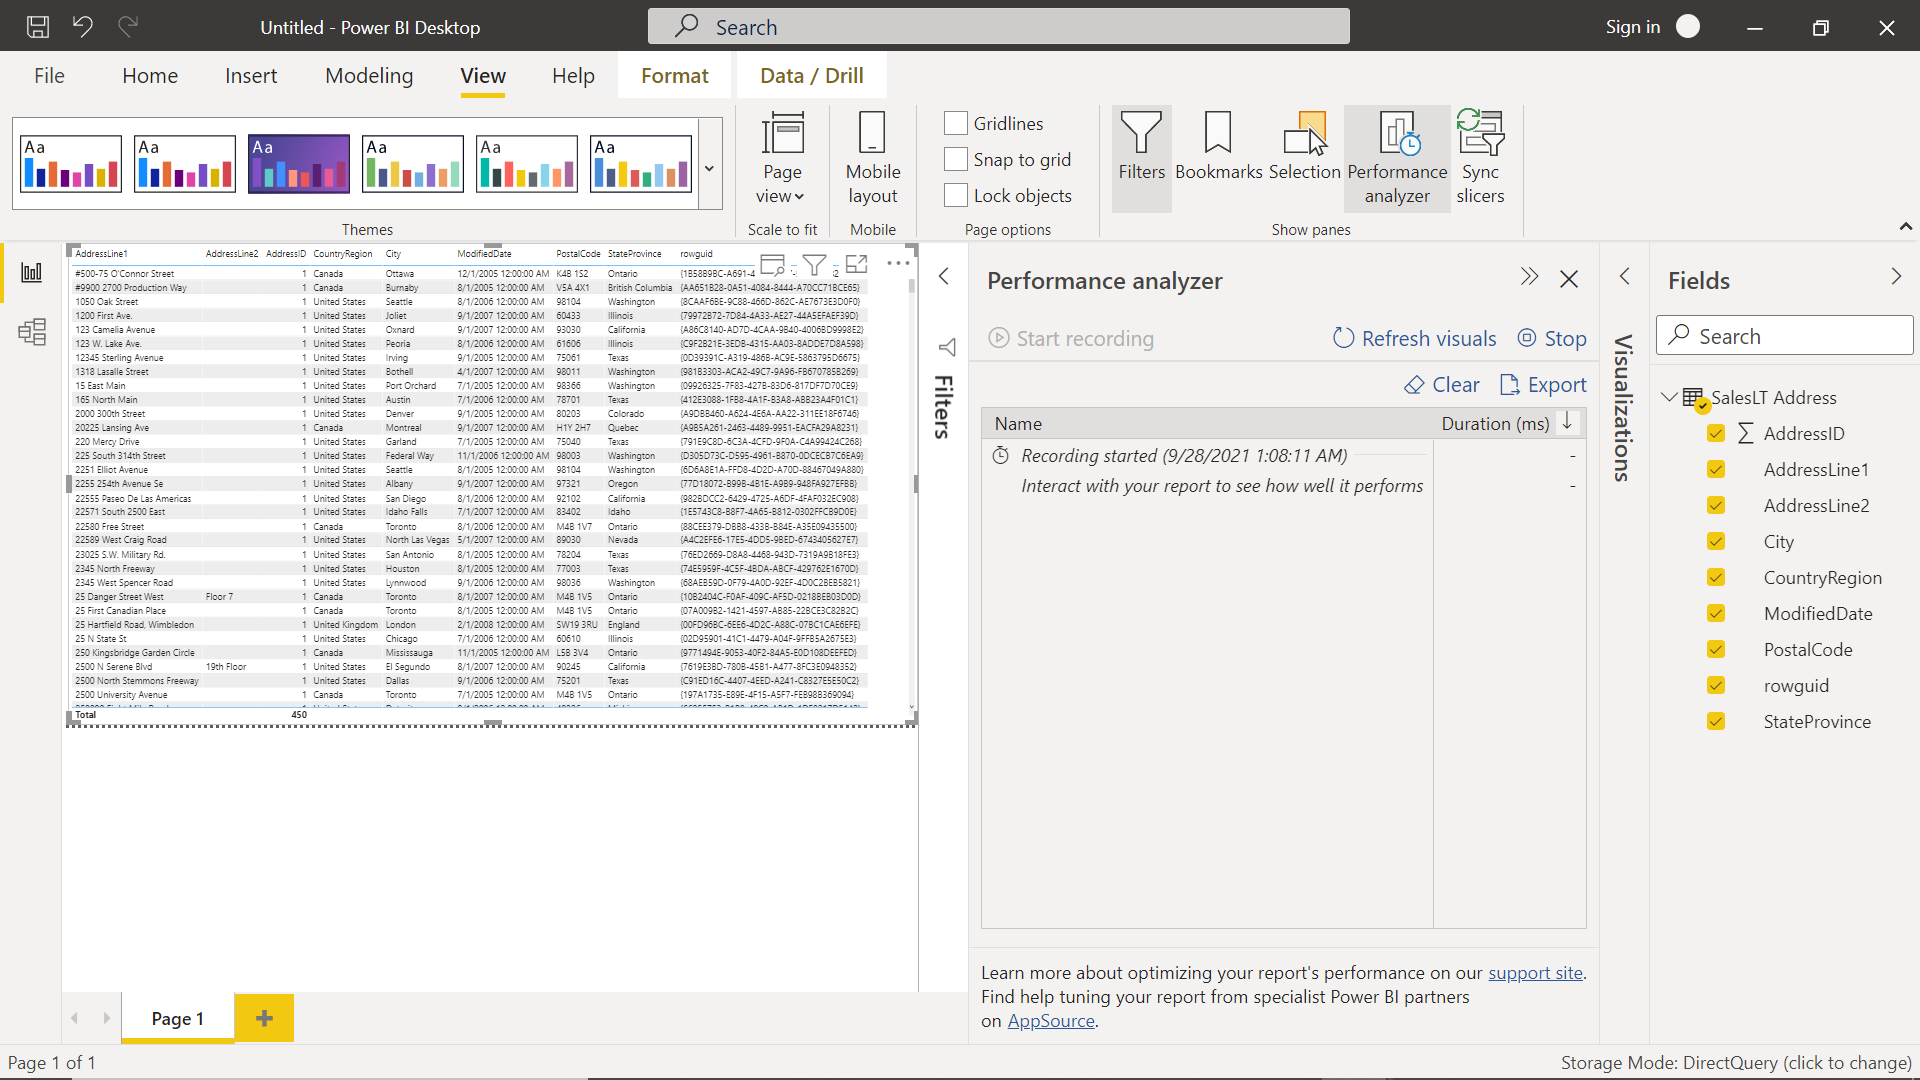
To test the performance of this report, click on the Start recording button, and then click on the Refresh visuals button. This would refresh the report resulting in repopulation of data in the visualizations.
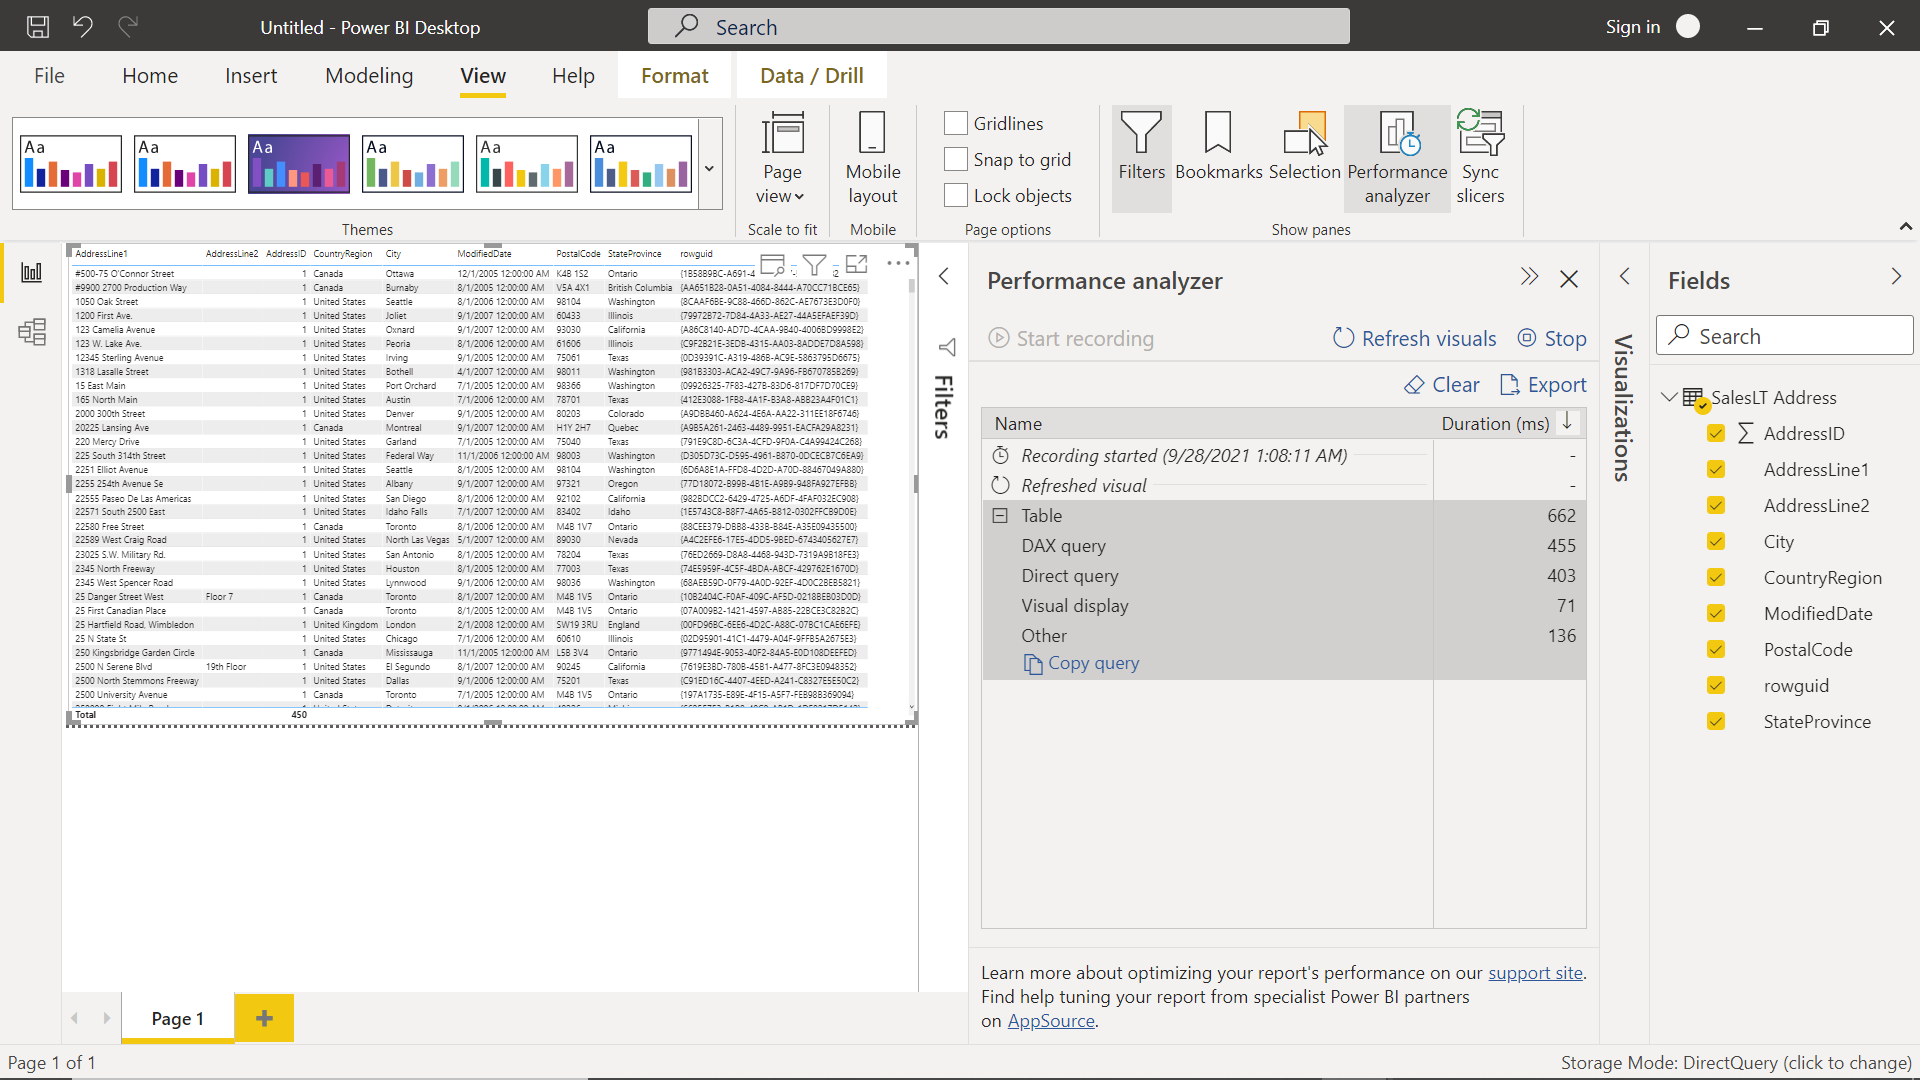
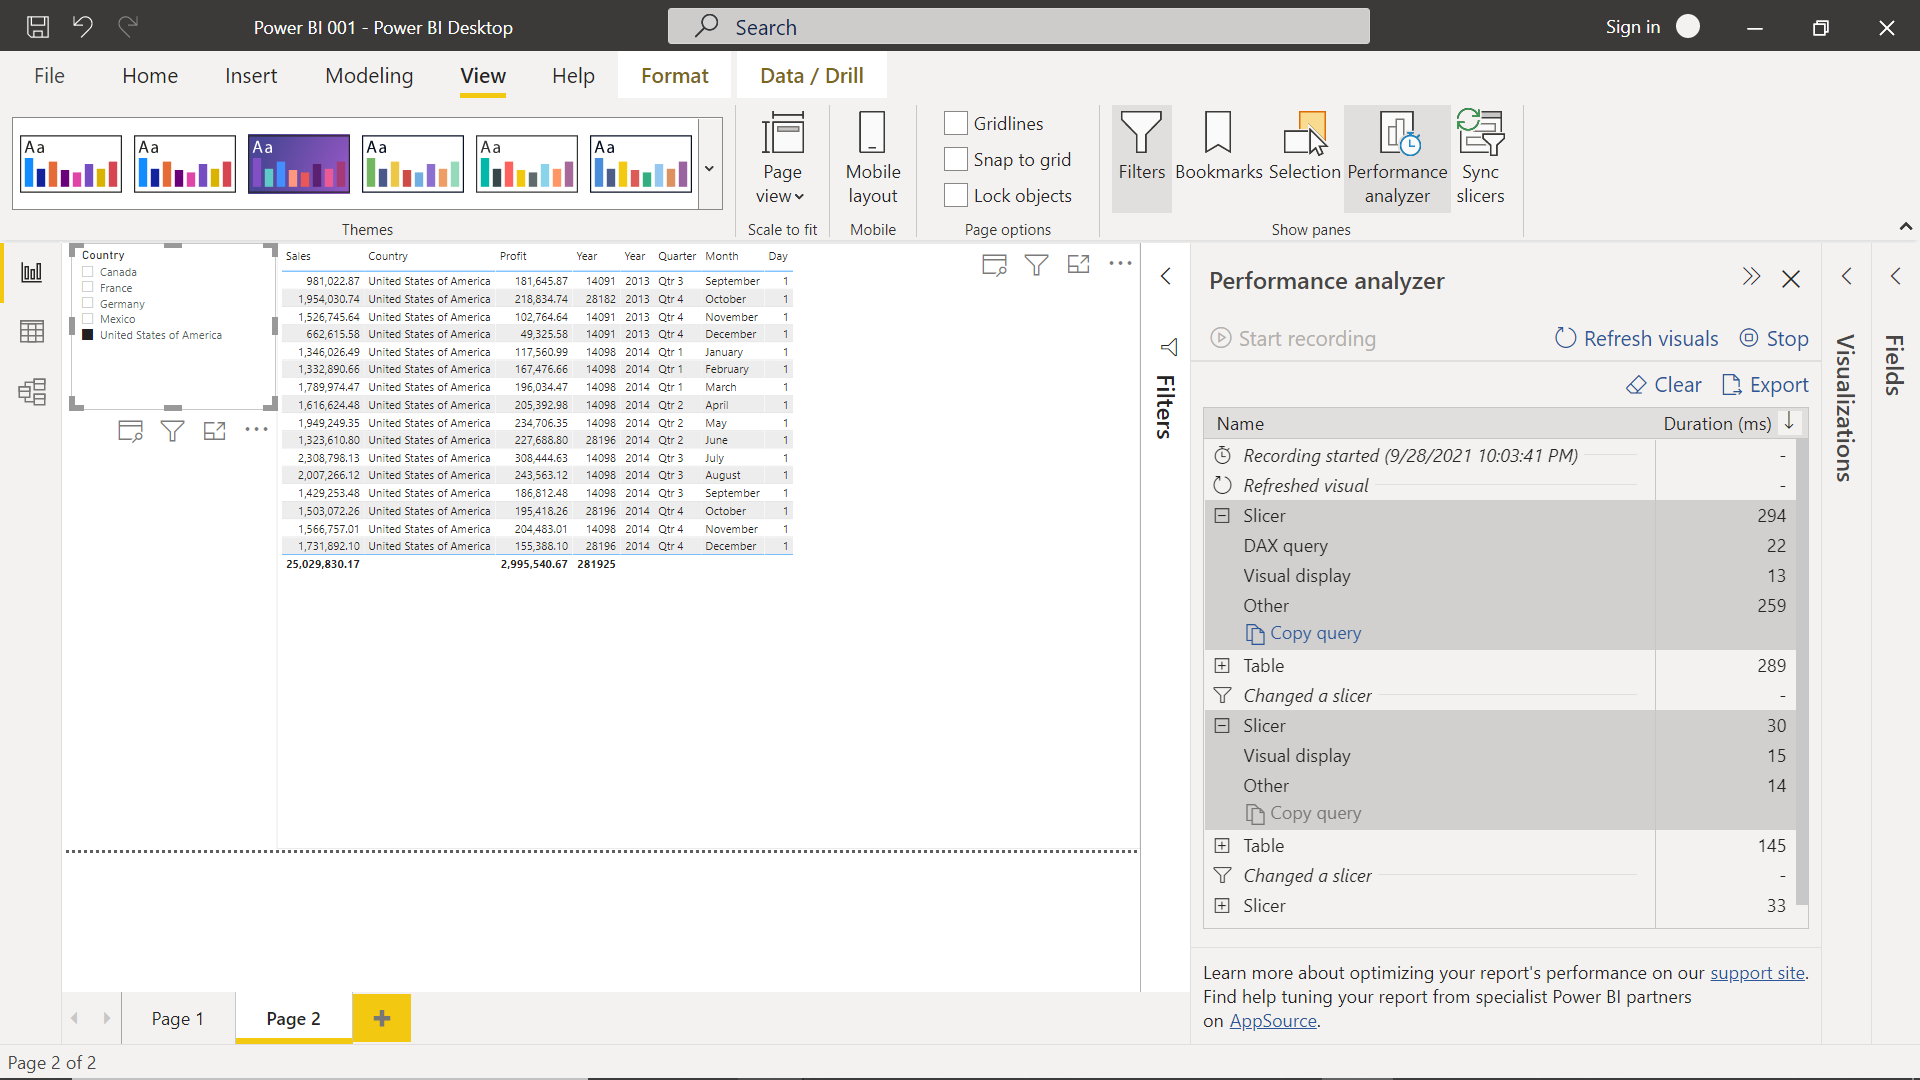
Once the report gets refreshed, the performance analyzer tab will record the event and add a node in the tab. Expand the tab, and it would show the list of items like DAX Query, Direct Query, Visual Display, and others. If we analyze the time consumed by these items, it’s easy to make out from the below that the DAX query took most of the time consumed in refreshing the report.
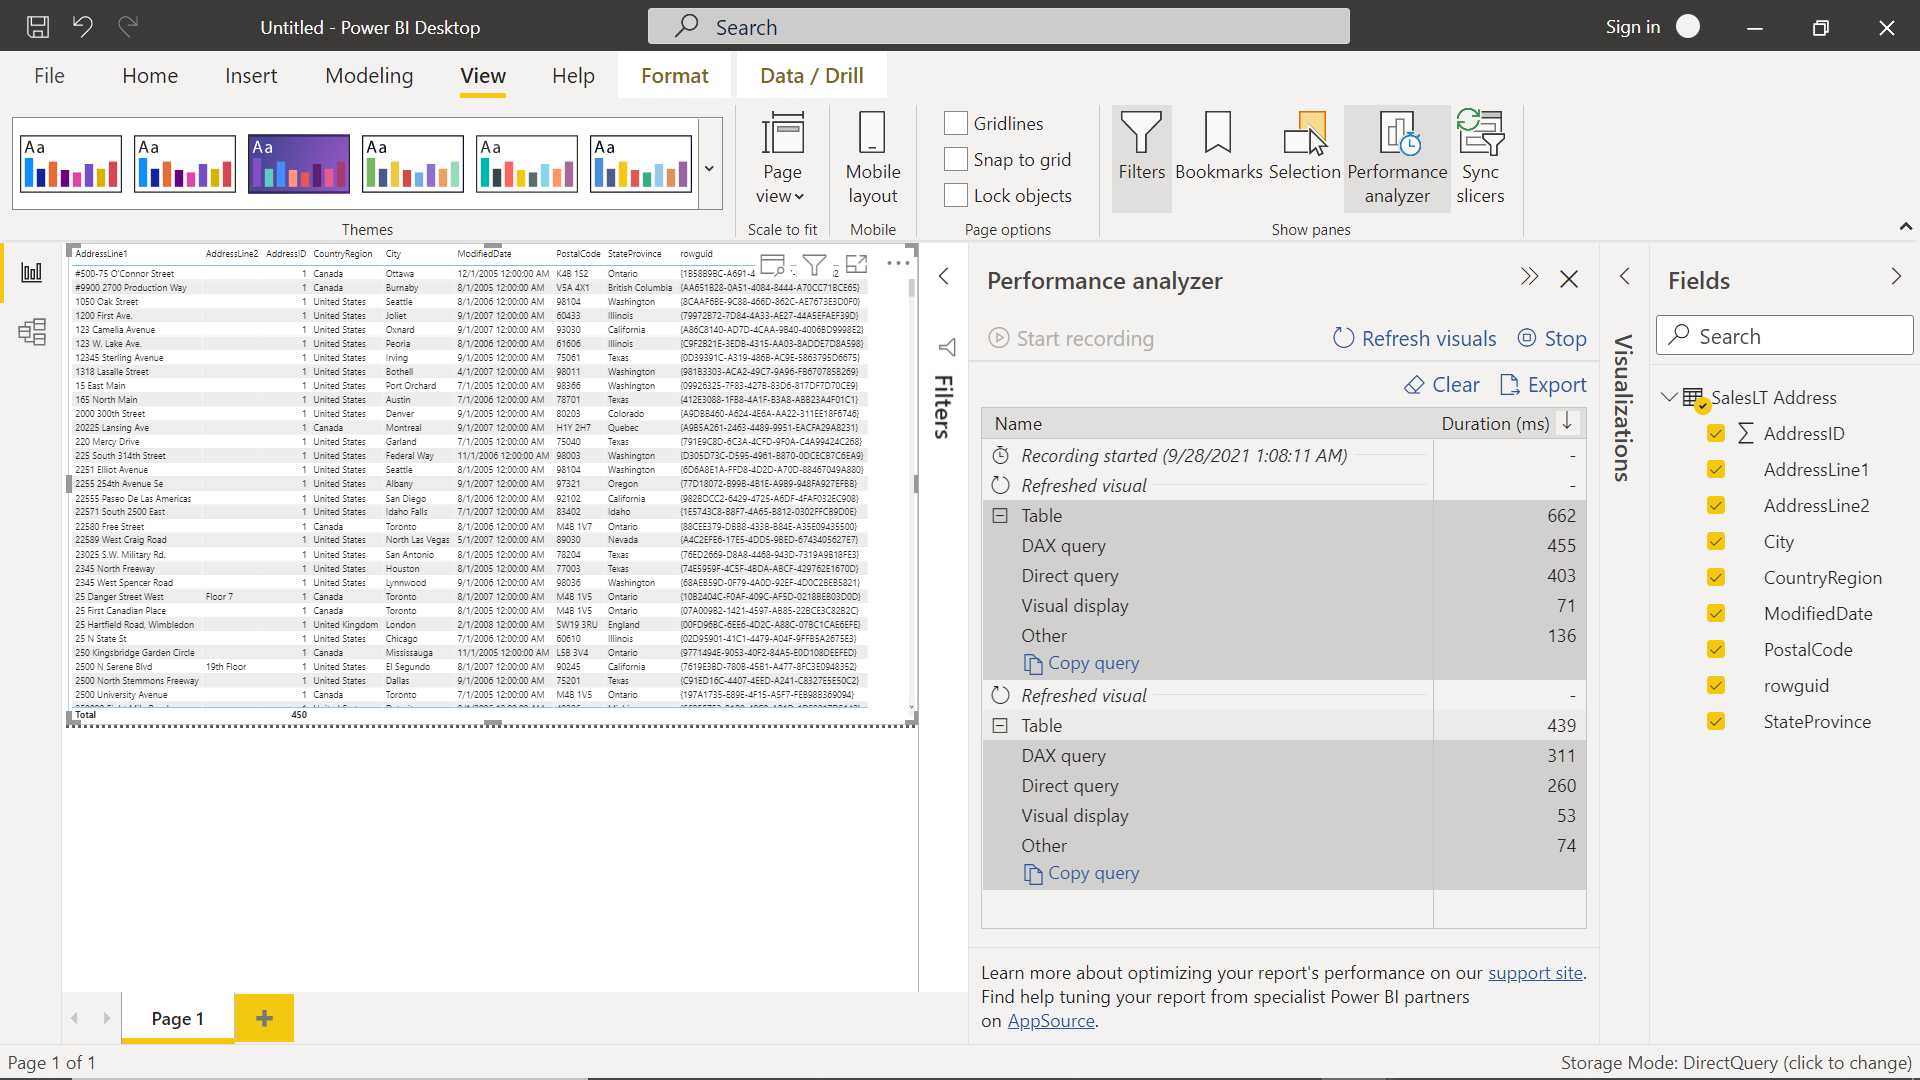
If we refresh the report again, it will add another node with the same items and the new values. We can easily make out that the report loaded faster the second time than the first time. The reason may be that the data is loading from a cache or local store. These kinds of insights are easy to derive using the logs collected by Performance Analyzer in Power BI Desktop Report. Once done, click on the Stop Recording button to stop collecting the performance logs.
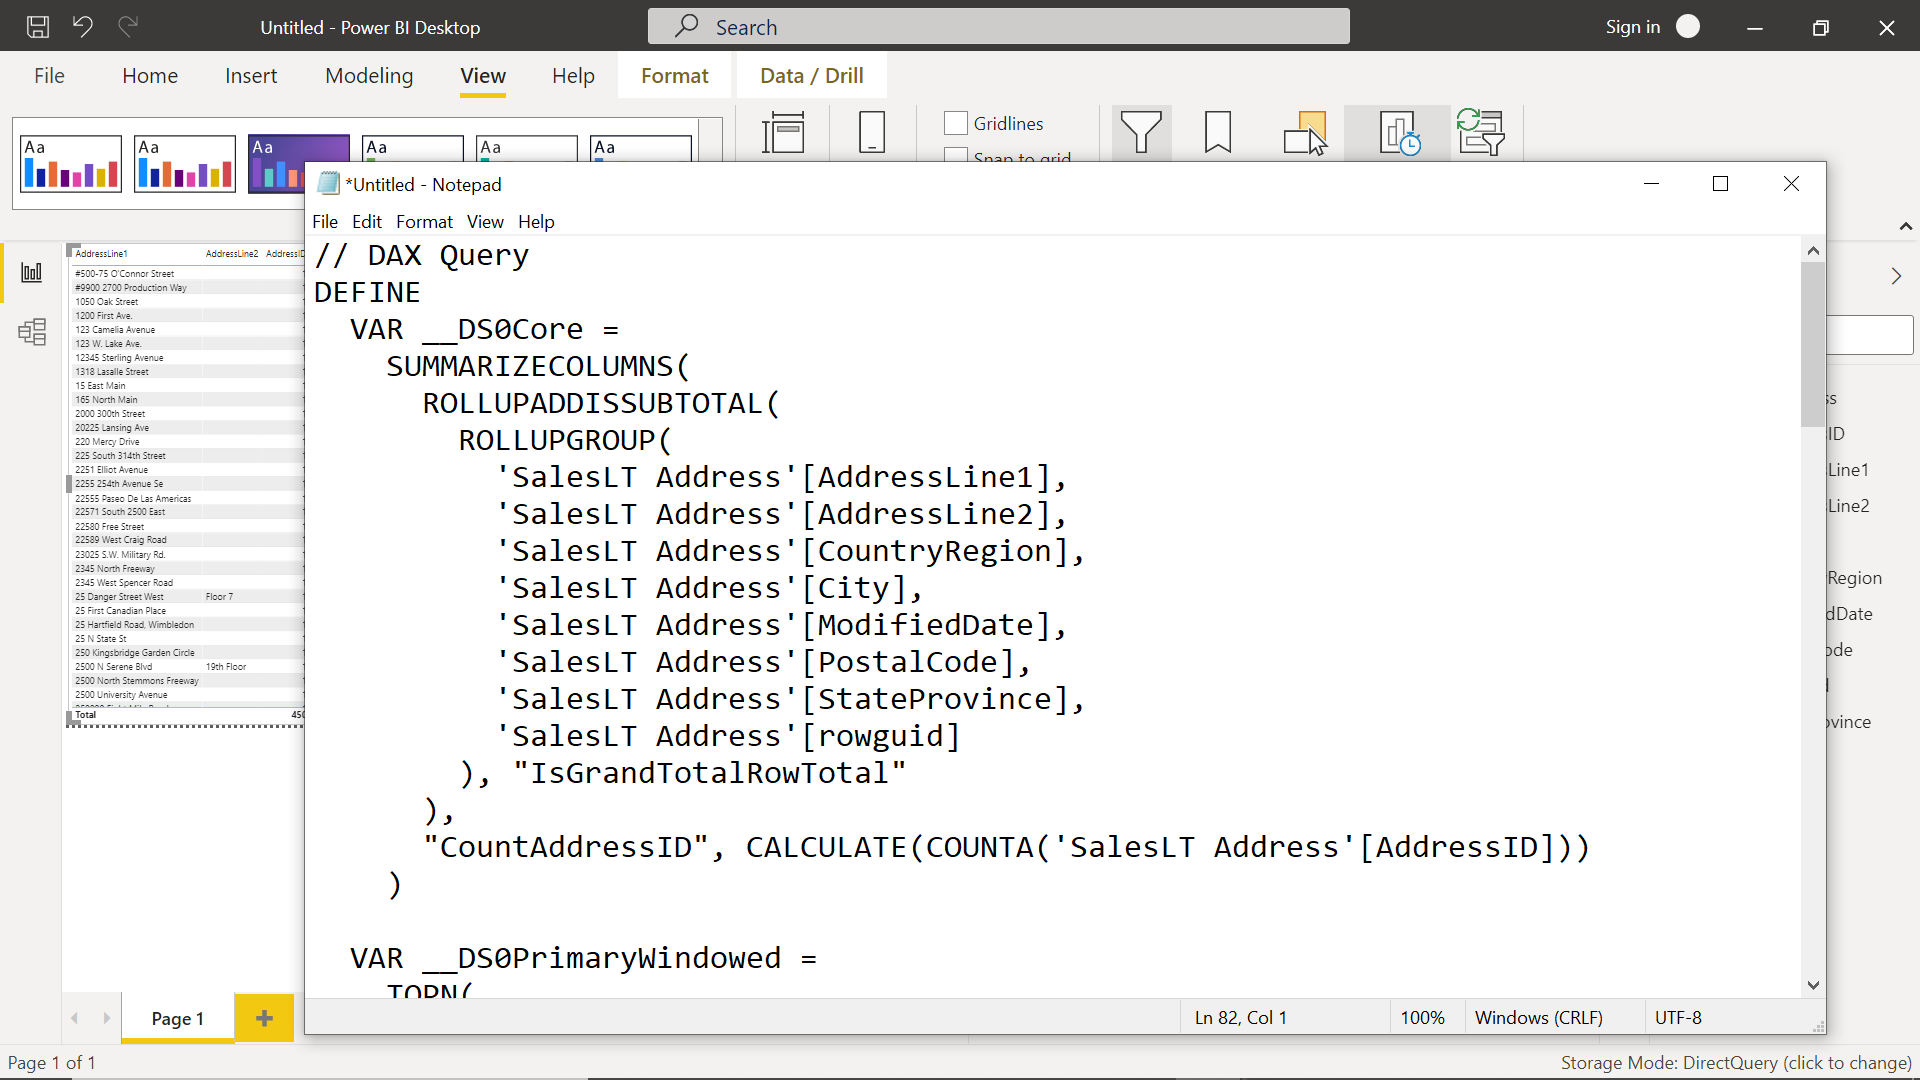
We can export the logs as well to a script file or copy the DAX query and paste it in a relevant place to view and analyze the same. Shown below is a sample DAX query for the report that we authored earlier.
For a report with more visual elements like slicer and visualizations, the performance log would also show actions like Changed a Slicer and similar other actions performed on the report along with performance metrics related to the corresponding action.
In this way, using Performance Analyzer in Power BI Desktop, one can perform a preliminary performance analysis of the report and derive actionable insights.
Conclusion
In this article, we learned the need to analyze the performance of Power BI Desktop reports. We created a data source with sample data on the cloud, thereafter we create a Power BI report and bound it with data from the data source. Finally, we analyzed the performance of this report using the Performance Analyzer feature.

She has a deep experience in designing data and analytics solutions and ensuring its stability, reliability, and performance. She is also certified in SQL Server and have passed certifications like 70-463: Implementing Data Warehouses with Microsoft SQL Server.
View all posts by Gauri Mahajan
- Oracle Substring function overview with examples - June 19, 2024
- Introduction to the SQL Standard Deviation function - April 21, 2023
- A quick overview of MySQL foreign key with examples - February 7, 2023