
In this article, we will learn the use of decomposition trees in Power BI and learn how to use it to analyze data using the visual as well as the AI built into this visual.
Introduction
A large volume and variety of data generally need data profiling to understand the nature of data. One of the aspects of data is hierarchy and inter-relationships within different attributes in data. Hierarchical data is often nested at multiple levels. To analyze the relationship between different attributes in a data that is hierarchical, drill-down and drill-through are two of the most common techniques that are employed for data exploration as well as use-cases like root cause analysis. While these techniques are standard and have been in the industry for quite a long time, figuring out these relationships and navigating hierarchical data can be a challenging task. Data Analysts or Business Analysts typically perform this analysis on the data before presenting it to the end-users. In certain cases, some domain or business users may be required to perform such analysis on the report itself. In that case, the task becomes even more challenging considering the limited data analysis capabilities offered by a reporting tool compared to a database and query languages like SQL. To help power users perform such analysis on a reporting tool, visualizations like decomposition trees can be used to decompose hierarchical data that is presented in an aggregated manner. The Decomposition tree can support both drill-down as well as drill-through use-cases when the user is provided the flexibility to choose the hierarchy or dimensions on-demand. In the Microsoft technology stack, Power BI is the key reporting tool for authoring reports and supports a wide variety of data sources. Power BI offers a category of visuals which are known as AI visuals. One such visual in this category is the Decomposition Tree.
Analyzing data with decomposition tree
It is assumed that one already has Power BI Desktop (latest release) installed on the development machine and is launched. The landing screen of the Power BI Desktop would look as shown below. Here we have sample data related to the supply chain already populated in the data model. One can use any hierarchical data in this exercise to evaluate the functionality and features offered by the decomposition tree in Power BI. Once the data is populated and the fields are visible in the fields section, we are ready to move to the next step in this exercise.
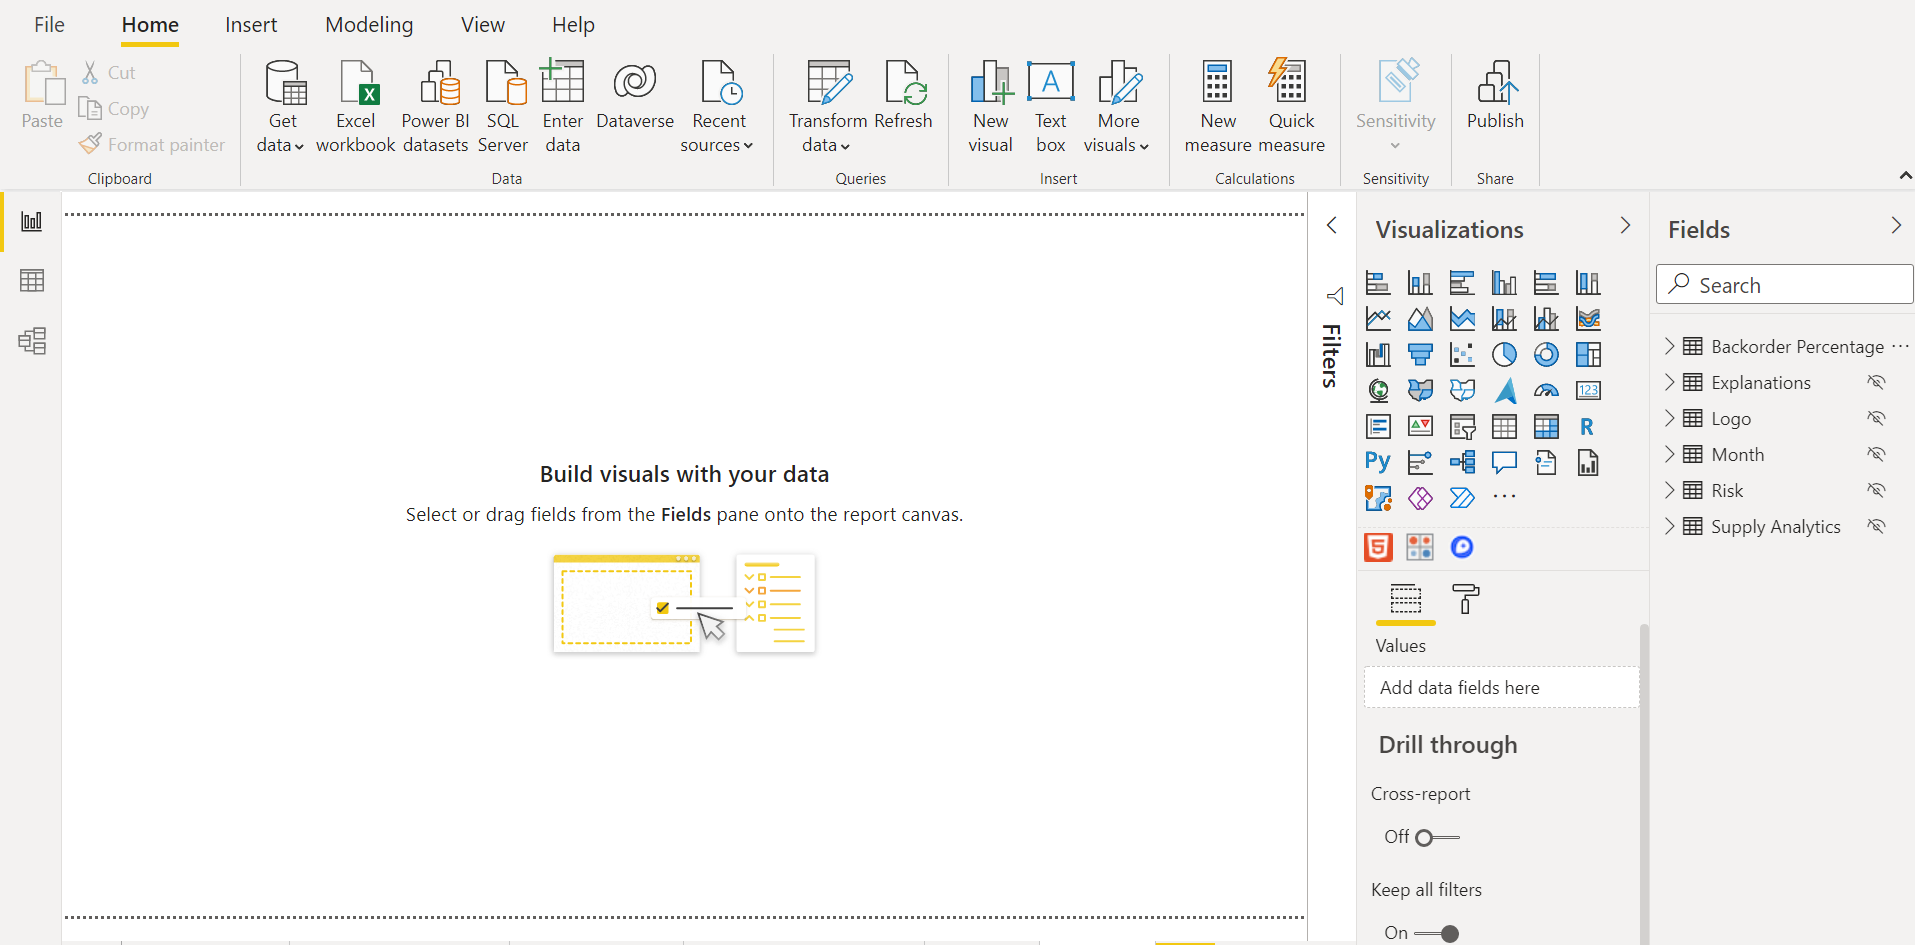
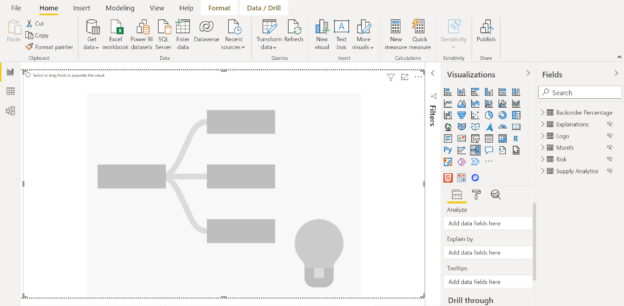
Assuming we have the data in the report, the first step is to add a decomposition tree to the report layout. Click on the decomposition tree icon and the control would get added to the layout. We can enlarge the size of the control to occupy the full-screen space of the report as shown below. Once the control gets added, click on the control to select it and the options related to the control can be seen under the visualization pane. The two mandatory properties that we need to bind with data fields are Explain by and Analyze property, as seen below. Analyze property requires a numeric field which is typically a measure or an aggregate value, and then Explain By property can be used to link it with different dimensions.

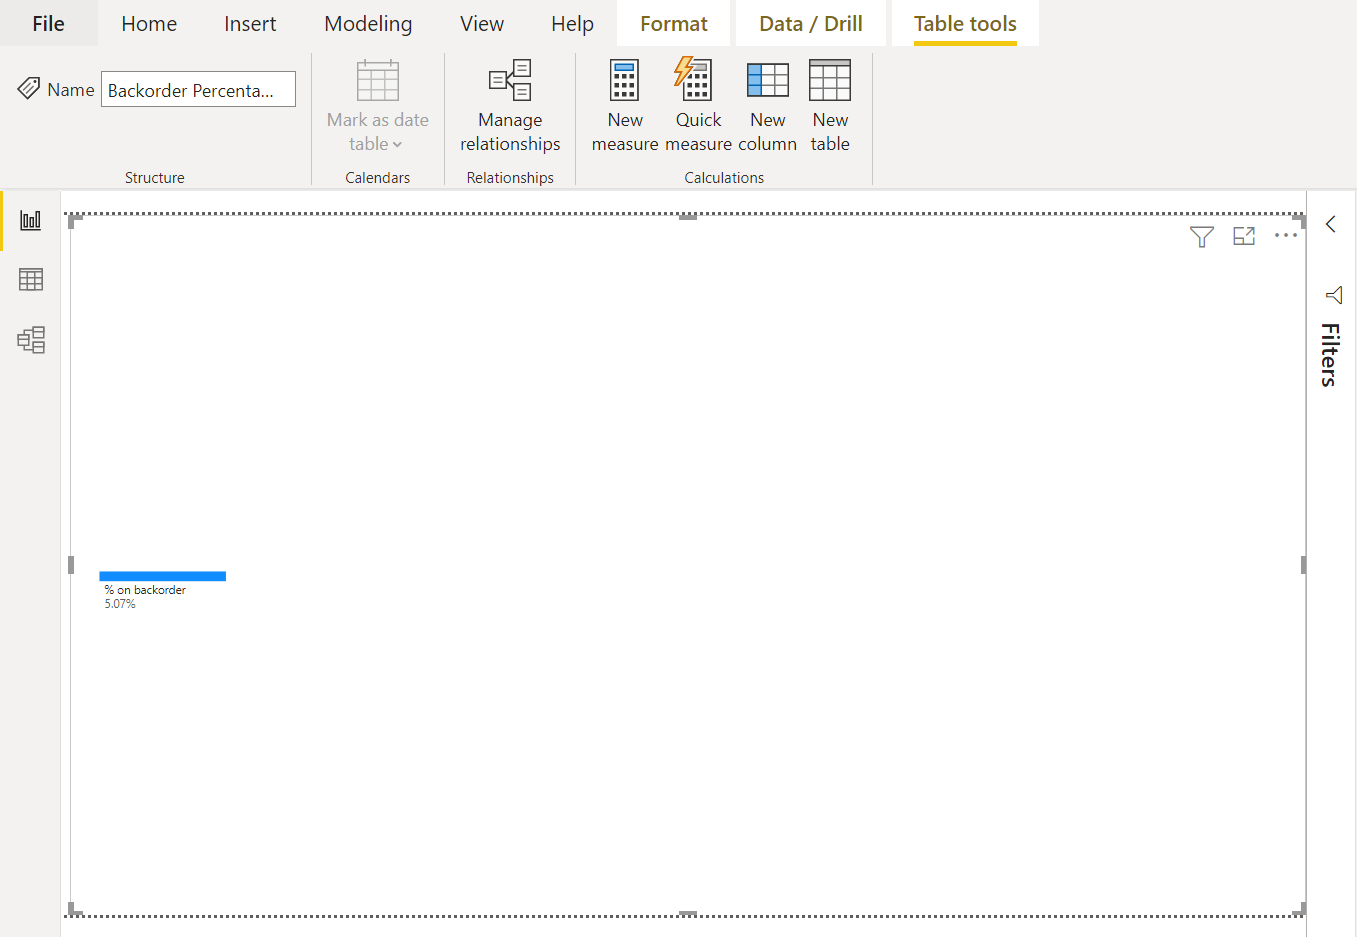
Select any measure, drag and drop it on the Analyze property and it would show up as node on the visual as shown below. It also shows the aggregated value of the field along with the name of the field being displayed.
The next step is to select one or more dimensions using which we intend to drill-down or analyze the data. Add at least one field to the Explain By property, and a + sign would be displayed next to the root node in the decomposition tree. Click on the + sign to expand the next level in the tree, and it would display a menu as shown below. The High Value menu option would find the field with the maximum value for the metric being analyzed and the Low Value menu option would find the field with the minimum value for the metric being analyzed. This is where the built-in Artificial Intelligence in the visualization gets utilized.
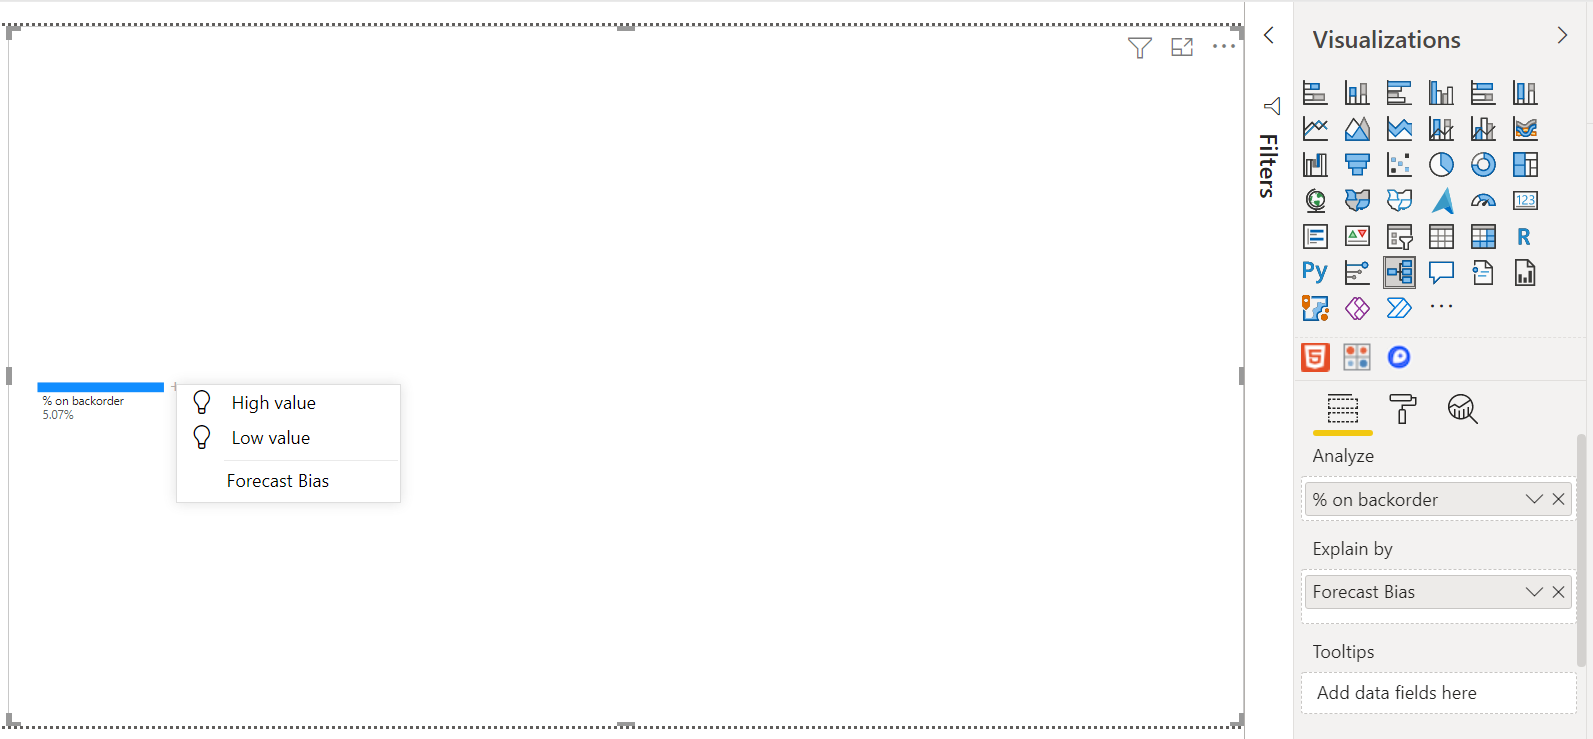
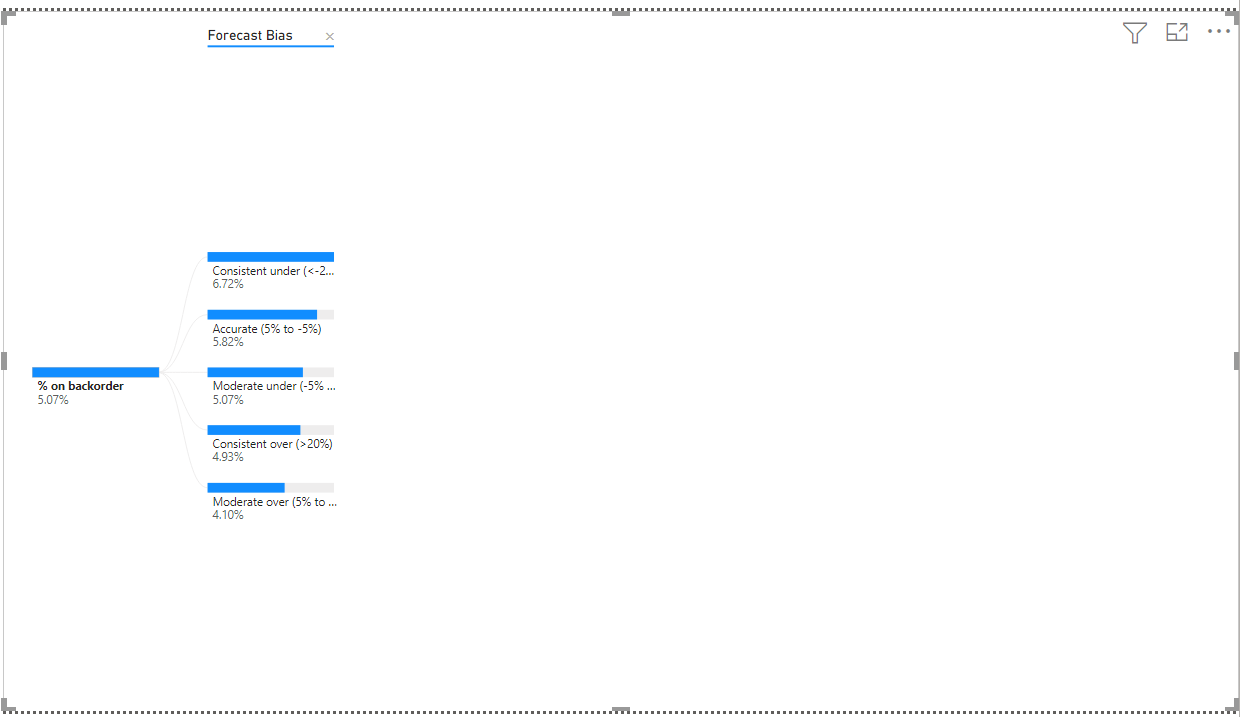
Click on the Forecast Bias field to analyze the values in the fields at the next level, and it would display the data at the next level as shown below. Here we are able to view different levels of forecasting bias being considered to predict backorder percentage.
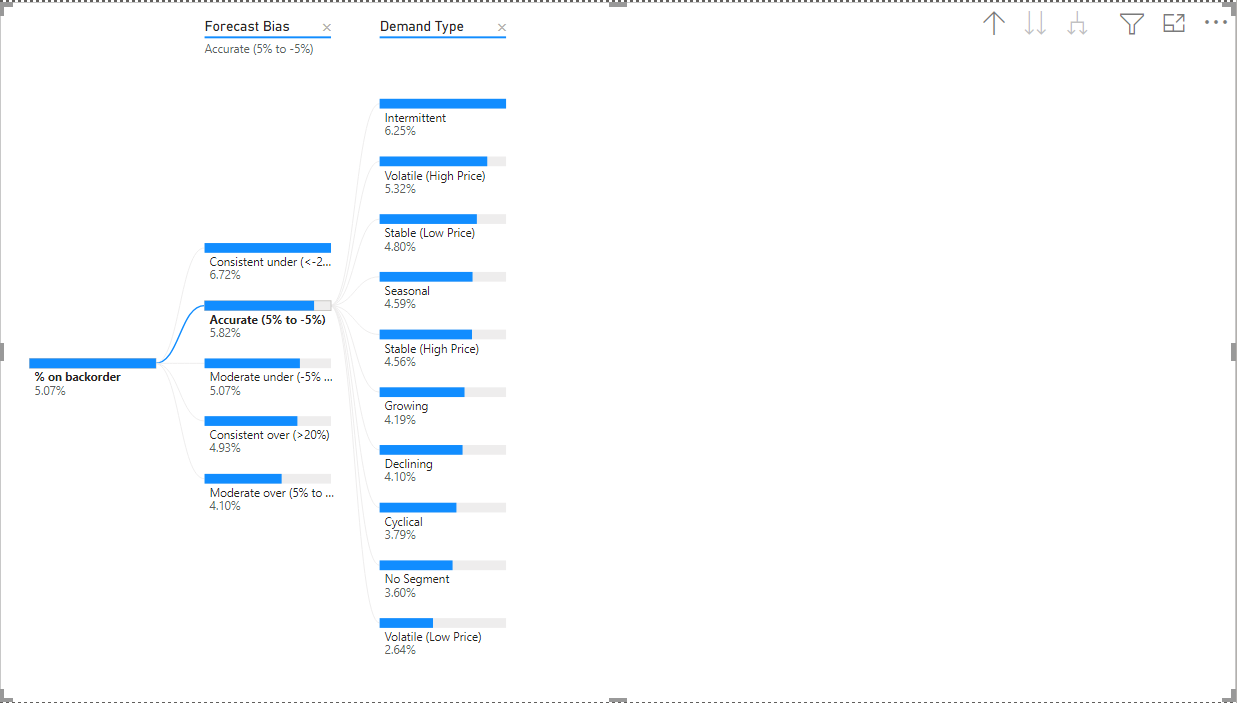
Let’s say that we intend to analyze the data for the forecast bias category Accurate by another dimension. Drag and drop the desired dimension under the previously select attribute in the Explain By property, and it would appear as shown below.
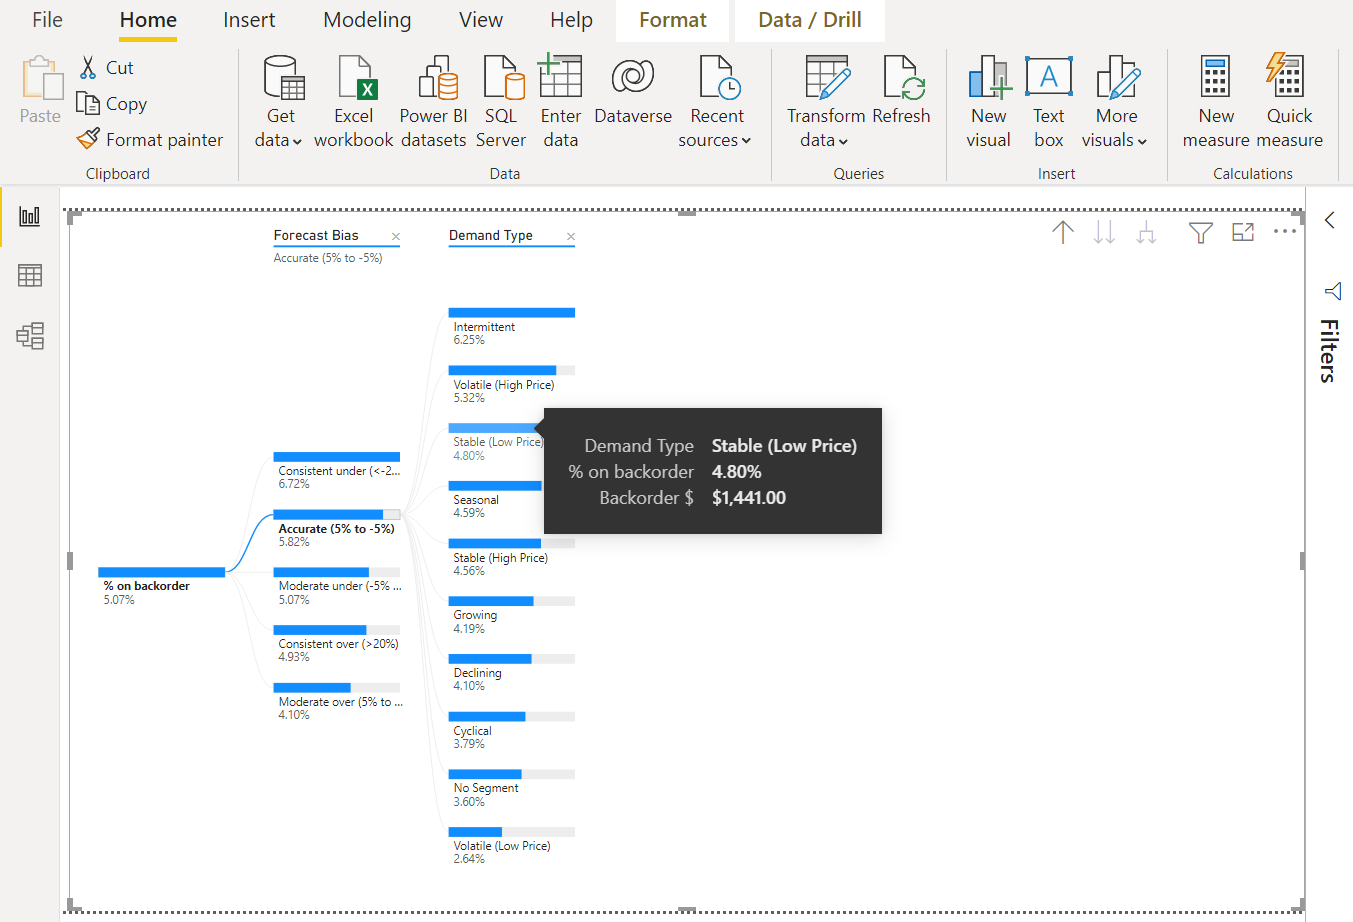
At times, one does not need to view the information on the screen as the screen space is very limited and some attributes may be needed only for an instant to gain more context on the data being analyzed. In such a situation, one can add fields to the tooltip property and the values will be shown in the tooltip. Here, we added a field named Backorder dollar to the tooltip property. Whenever we hover the mouse on any of the nodes in the tree, it will show the values of the node in the tooltip, along with the attribute we added as shown below.
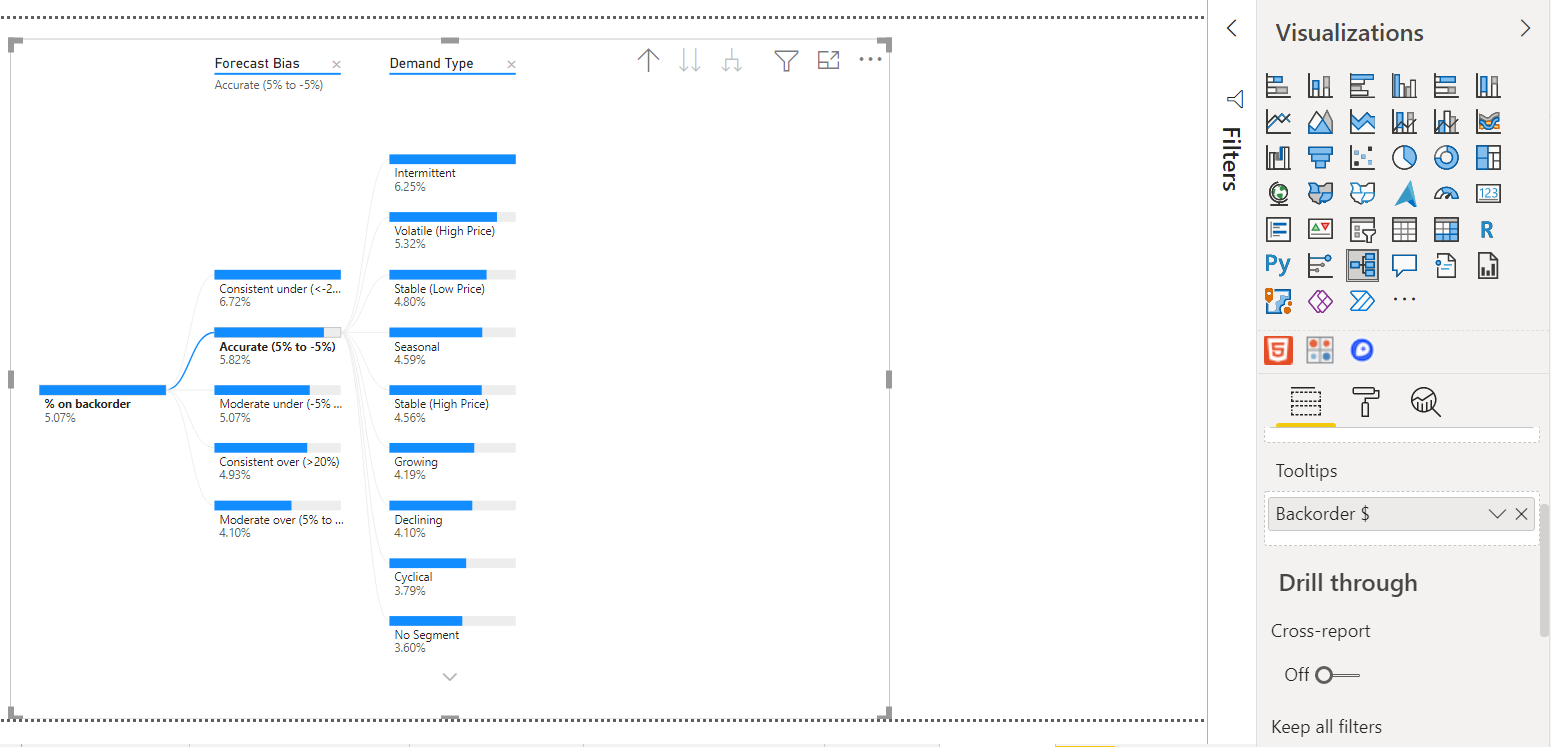
So far, we have been performing drill-down operations on the selected measure by different dimensions of interest. At times, we may want to enable drill-through as well for a different method of analysis. We can enable the same by using the properties in the drill-through section as shown below. Cross-report property enables us to use the report page as a target for other drill-through reports.
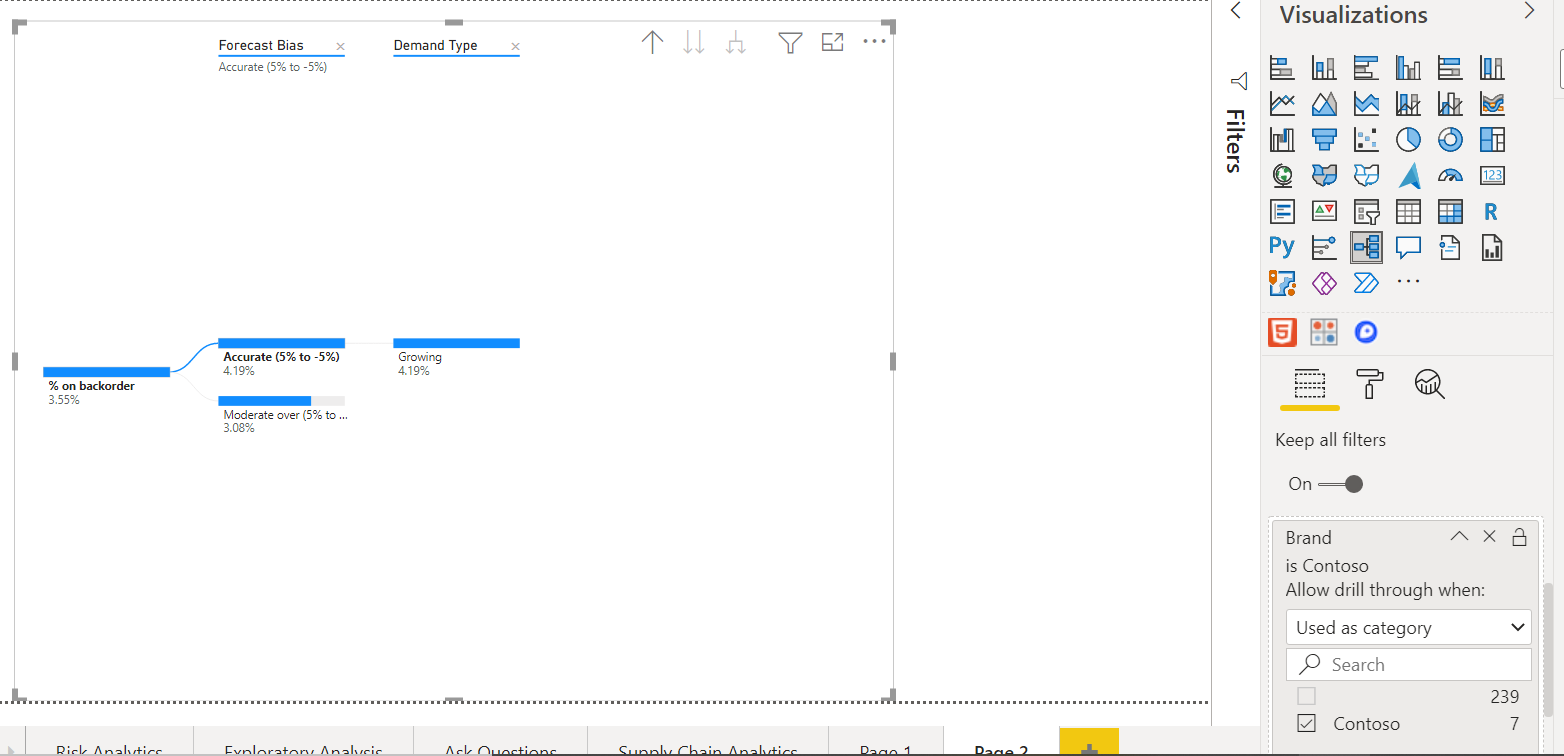
We can add drill-through fields by dragging and dropping them in the bottom-most area in the drill-through section. Let’s say we want to drill through the data shown in the decomposition tree by an attribute named Brand. When we drag and drop this attribute in the Drill Through section, we would be able to see the distinct values in this field. If we select one of the values in this field as shown below, the data would be scoped to the selected value as shown below.
While exploring the data and trying out different measures and dimensions in the decomposition tree, one may eventually find the hierarchy and dataset of interest using the drill-down approach and drill-through options. Saving and publishing the report is one way of preserving the analysis. Another option one may want to exercise is to export the data in a tabular format, so that it can be used elsewhere outside of the report as well. This can be easily accomplished in Power BI by clicking on the top-right corner of the report and exporting the data in the decomposition tree as shown below.
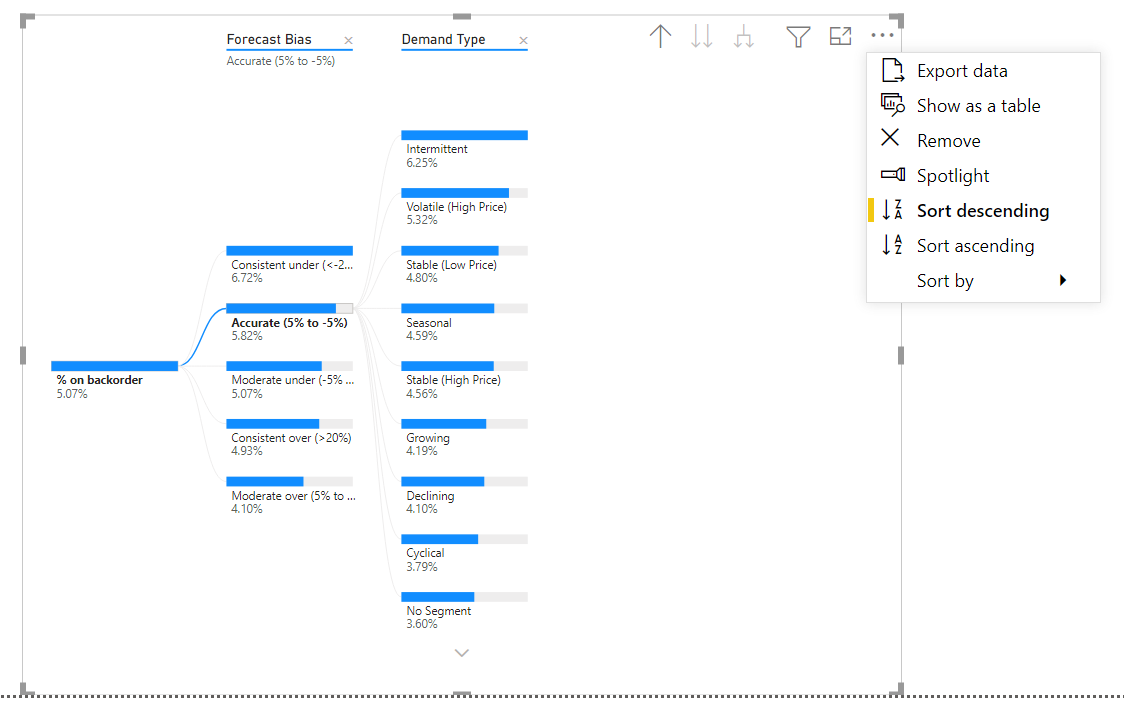
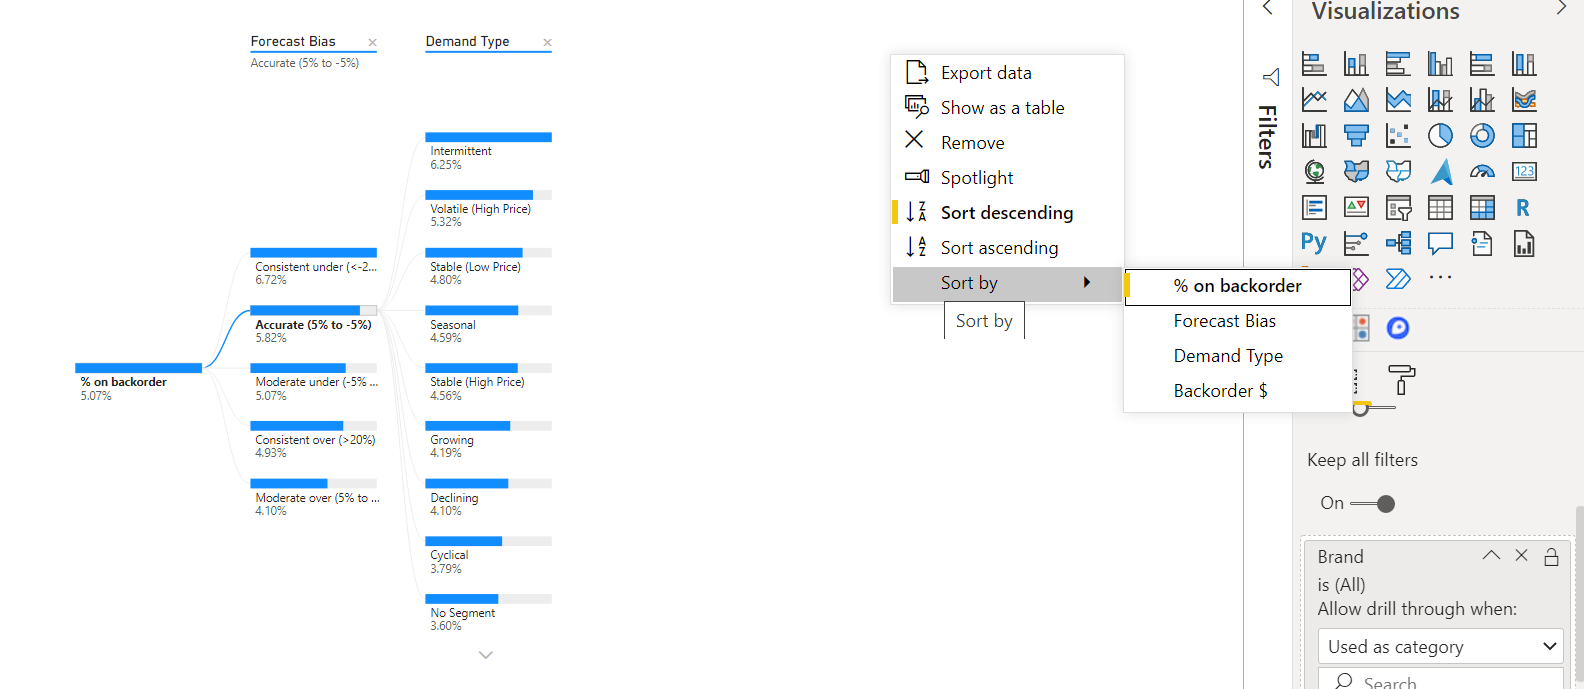
We can use the top and down arrows shown at each level of the hierarchy to scroll through the data. While this remains an option, one would typically want to sort the data in an ascending or descending order, or even by a different attribute. We can accomplish the same as well by using the sort options provided in the context menu of the visualization.
In this way, we can explore decomposition trees in Power BI to analyze data from various angles.
Conclusion
In this article, we learned the use of drill-down and drill-through techniques as well as the use of decomposition trees for this purpose. We learned how to use the decomposition tree in Power BI and explored the different options and features offered by this visualization in Power BI.

She has a deep experience in designing data and analytics solutions and ensuring its stability, reliability, and performance. She is also certified in SQL Server and have passed certifications like 70-463: Implementing Data Warehouses with Microsoft SQL Server.
View all posts by Gauri Mahajan
- Oracle Substring function overview with examples - June 19, 2024
- Introduction to the SQL Standard Deviation function - April 21, 2023
- A quick overview of MySQL foreign key with examples - February 7, 2023