
The performance of a database is the most challenging and critical part of database optimization. The challenge every DBA faces is to identify the most resource-intensive databases. This article talks about the natively available features that can accomplish the task of getting the required details of the entire database at a granular level.
Using the techniques and methods baked right into SQL, one can collect the aggregate information at the instance level. The instance level data sometimes might be helpful when you want to get an insight at a higher level. When we work with mission-critical systems, the breakdown at granular level and detailed information on CPU, Memory, and I/O is always helpful. There are few metrics that are important, and I’m going to discuss those shortly.
This article describes on how to measure the various performance characteristics of databases. Learn about how:
- In-lines T-SQL’s module for each performance metrics
- Details the use of SQL 2017 STRING_AGG string function
- Includes the usage of DMF sys.dm_db_log_info
- Display consolidated data using T-SQL
- and more …
What database metrics do I monitor?
SQL Server Performance monitoring revolves around many key areas
- CPU
- Memory
- Disk I/O
- Also, the factors such as user connections, database transaction rate, and data and log file settings
These factors give an overview of its impact on the performance of the application. This article is an effort to understand the general characteristics of databases; it gives an overview about the key factors used to classify the databases as critical, medium and low usage databases.
There are many tools available to track the database usage details, which are listed below:
- DMV’s
- SQL Profiler
- Counters
- Activity Monitor
- Windows Perfmon
- Third party tools
SQL Server bundles various monitoring options but there will be cases when you would want to turn to third party tools. The article outlines the details the using native SQL techniques to identify the most resource-intensive databases of an SQL instance. The following SQL’s are tested on SQL 2012-2017
Disk I/O Management
In a manner of speaking, disk I/O is primarily tracked at the OS level, using built-in counters. These metrics give a gist of what is happening at the disk level, such as the bandwidth used in the data bus. Querying system view sys.master_files and dynamic management function sys.dm_io_virtual_file_stats returns I/O statistics for the data and log files.
Let us now see how to aggregate some statistics into a single row for each database. XML and STUFF are used to generate the comma separated values in a single row. We also explore the same functionality using the STRING_AGG function in SQL Server 2017, to derive the same results with just a few lines of code.
Our performance metrics will include:
- Rank- defines the I/O usage rating of the Disk
- Num of Reads – This tells how many number of reads issued on the file
- Number of Writes – This talks about the number of writes made on the file
- Number of Bytes Reads – This is number of bytes read on this file
- Number of Bytes Written – This gives a value of total number of byes written to a file
Using the following script:
|
1 2 3 4 5 6 7 8 9 10 11 12 13 14 15 16 17 18 19 20 21 22 23 24 25 26 27 28 29 30 31 32 33 34 35 36 37 38 39 40 41 42 43 44 45 46 47 48 49 50 51 52 53 54 55 56 57 58 59 60 61 62 63 64 65 66 67 68 69 70 71 72 73 74 75 76 77 78 79 80 81 82 83 84 85 86 87 88 89 90 91 92 93 94 95 96 97 98 99 100 101 102 103 104 105 106 107 |
USE MASTER GO DECLARE @DML nvarchar(MAX) DECLARE @SQLShackIOStatistics TABLE ( [I/ORank] [int] NULL, [DBName] [nvarchar](128) NULL, [driveLetter] [nvarchar](1) NULL, [totalNumOfWrites] [bigint] NULL, [totalNumOfBytesWritten] [bigint] NULL, [totalNumOfReads] [bigint] NULL, totalNumOfBytesRead [bigint] NULL, [totalI/O(MB)] [decimal](12,2) NULL, [I/O(%)] [decimal](5, 2) NULL, [SizeOfFile] [decimal](10,2) NULL ) SET @DML=' WITH SQLShackIOStatistics AS ( select db_name(mf.database_id) as dbname, left(mf.physical_name, 1) as driveLetter, sum(vfs.num_of_writes) [totalNumOfWrites], sum(vfs.num_of_bytes_written) [totalNumOfBytesWritten], sum(vfs.num_of_reads) [totalNumOfReads], sum(vfs.num_of_bytes_read) [totalNumOfBytesRead], cast(SUM(num_of_bytes_read + num_of_bytes_written)/1024 AS DECIMAL(12, 2)) AS [TotIO(MB)], MAX(cast(vfs.size_on_disk_bytes/1024/1024.00 as decimal(10,2))) SizeMB from sys.master_files mf join sys.dm_io_virtual_file_stats(NULL, NULL) vfs on mf.database_id=vfs.database_id and mf.file_id=vfs.file_id GROUP BY mf.database_id,left(mf.physical_name, 1)) SELECT ROW_NUMBER() OVER(ORDER BY [TotIO(MB)] DESC) AS [I/ORank], [dbname], driveLetter, [totalNumOfWrites], totalNumOfBytesWritten, totalNumOfReads, totalNumOfBytesRead, [TotIO(MB)] AS [I/O(MB)], CAST([TotIO(MB)]/ SUM([TotIO(MB)]) OVER() * 100.0 AS DECIMAL(5,2)) AS [I/O(%)], SizeMB FROM SQLShackIOStatistics ORDER BY [I/ORank] OPTION (RECOMPILE) ' INSERT INTO @SQLShackIOStatistics EXEC sp_executesql @DML --SELECT * FROM @SQLShackIOStatistics select [DBName], [I/O Rank] = STUFF( (SELECT ',' + cast(s.[I/ORank] as varchar(3)) FROM @SQLShackIOStatistics s WHERE s.[DBName] = t.[DBName] FOR XML PATH('')),1,1,''), physicalName=STUFF( (SELECT ',' + s.driveLetter FROM @SQLShackIOStatistics s WHERE s.[DBName] = t.[DBName] FOR XML PATH('')),1,1,'') , FileSizeMB=STUFF( (SELECT ',' + cast(s.SizeOfFile as varchar(20)) FROM @SQLShackIOStatistics s WHERE s.[DBName] = t.[DBName] FOR XML PATH('')),1,1,'') , total_num_of_writes=STUFF( (SELECT ',' + cast(s.[totalNumOfWrites] as varchar(20)) FROM @SQLShackIOStatistics s WHERE s.[DBName] = t.[DBName] FOR XML PATH('')),1,1,''), total_num_of_bytes_written=STUFF( (SELECT ',' + cast(s.[totalNumOfBytesWritten] as varchar(20)) FROM @SQLShackIOStatistics s WHERE s.[DBName] = t.[DBName] FOR XML PATH('')),1,1,''), total_num_of_reads=STUFF( (SELECT ',' + cast(s.totalnumofreads as varchar(20)) FROM @SQLShackIOStatistics s WHERE s.[DBName] = t.[DBName] FOR XML PATH('')),1,1,''), total_num_of_Bytes_reads=STUFF( (SELECT ',' + cast(s.totalNumOfBytesRead as varchar(20)) FROM @SQLShackIOStatistics s WHERE s.[DBName] = t.[DBName] FOR XML PATH('')),1,1,''), [Total I/O (MB)]=STUFF( (SELECT ',' + cast(s.[TotalI/O(MB)] as varchar(20)) FROM @SQLShackIOStatistics s WHERE s.[DBName] = t.[DBName] FOR XML PATH('')),1,1,''), [I/O Percent]=STUFF( (SELECT ',' + cast(s.[I/O(%)] as varchar(20)) FROM @SQLShackIOStatistics s WHERE s.[DBName] = t.[DBName] FOR XML PATH('')),1,1,'') from @SQLShackIOStatistics t group by [DBName] |
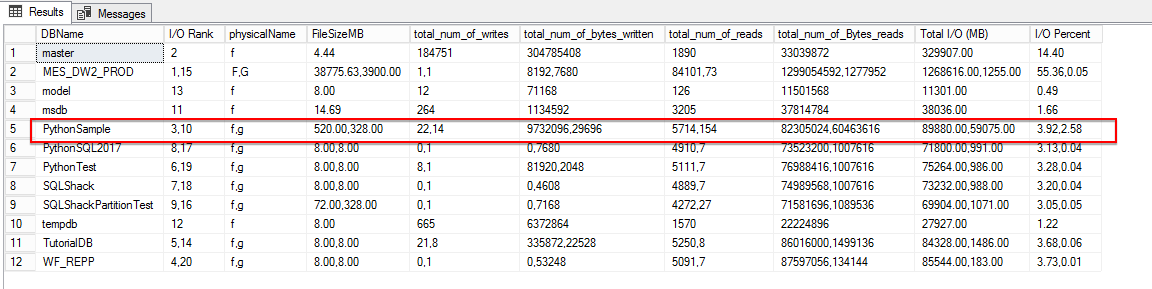
In the figure above, the multi-valued cells are supposed to be read in sequence. For instance, for the database, PythonSample, the I/O rank 3 is for the f drive. The data file size is 520 MB, Log file size is 328 MB, the total number of writes on the drive is 22, and the total number of bytes written is 9733096 and so on. Similarly, the G drive has an I/O rank of 10; total number of writes as 14, Total number of bytes written is 29696 etc.
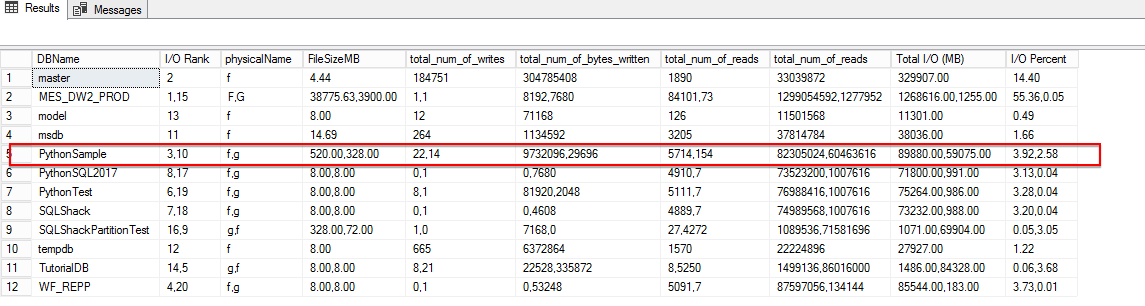
Using STRING_AGG
In the below figure, we can see that the query has displayed the same result with very few lines of SQL code using STRING_AGG.
|
1 2 3 4 5 6 7 8 9 10 11 12 13 14 |
select [DBName], STRING_AGG( [I/ORank],',') [I/O Rank], STRING_AGG(DriveLetter,',') physicalName, STRING_AGG(SizeOfFile,',') FileSizeMB, STRING_AGG(totalnumofwrites,',') total_num_of_writes, STRING_AGG(totalnumofbyteswritten,',') total_num_of_bytes_written, STRING_AGG(totalnumofreads,',') total_num_of_reads, STRING_AGG(totalNumOfBytesRead,',') total_num_of_reads, STRING_AGG([TotalI/O(MB)],',') [Total I/O (MB)], STRING_AGG([I/O(%)],',') WITHIN GROUP (ORDER BY [DBName] ASC) [I/O Percent] from @SQLShackIOStatistics group by [DBName] |
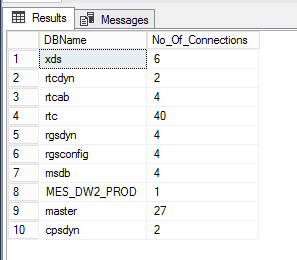
SQL user connections
Monitoring user connections in SQL Server can be done using several methods. This section queries the system view to get the user connections for each database.
|
1 2 3 4 5 6 7 8 9 10 11 12 13 14 15 16 17 18 19 20 21 22 |
USE MASTER GO DECLARE @DML nvarchar(MAX) DECLARE @SQLShackUserConn TABLE ( DBName [nvarchar](128) NULL, No_Of_Connections [int] NULL ) SET @DML=' SELECT DB_NAME(dbid) DBName,COUNT(*) No_Of_Connections FROM sys.sysprocesses --where kpid>0 group by DB_NAME(dbid) ORDER BY DB_NAME(dbid) DESC OPTION (RECOMPILE) ' INSERT INTO @SQLShackUserConn EXEC sp_executesql @DML select * from @SQLShackUserConn |
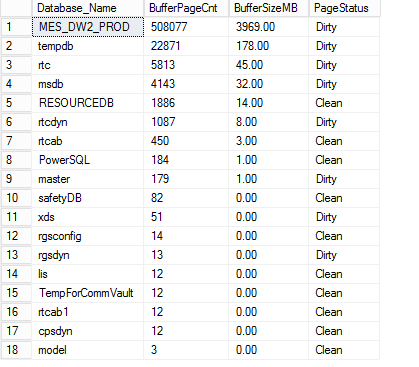
Buffer Pool Memory Management
There are a lot more system DMVs available to gather the information at very high level. The idea is to gather the details of the buffer pool management at the database level. The sys.dm_os_buffer_descriptors DMV has a row for each data page read into memory and cached. It is used to determine how the buffer pool is organized and used.
Note: the is_modified bit being 1 indicates that the page has been modified after it was read from the disk.
|
1 2 3 4 5 6 7 8 9 10 11 12 13 14 15 16 17 18 19 20 21 22 23 24 25 26 27 28 29 30 |
USE MASTER GO DECLARE @DML nvarchar(MAX) DECLARE @SQLShackCacheMemory TABLE( [Database_Name] [nvarchar](128) NULL, BufferPageCnt int, BufferSizeMB [decimal](10, 2) NULL, PageStatus varchar(10) ) SET @DML='SELECT DBName = CASE WHEN database_id = 32767 THEN ''RESOURCEDB'' ELSE DB_NAME(database_id) END, Bufferpage=count_BIG(*), BufferSizeMB = COUNT(1)/128, PageStatus = max(CASE WHEN is_modified = 1 THEN ''Dirty'' ELSE ''Clean'' END) FROM sys.dm_os_buffer_descriptors GROUP BY database_id ORDER BY 2 DESC' INSERT INTO @SQLShackCacheMemory EXEC sp_executesql @DML SELECT * FROM @SQLShackCacheMemory |
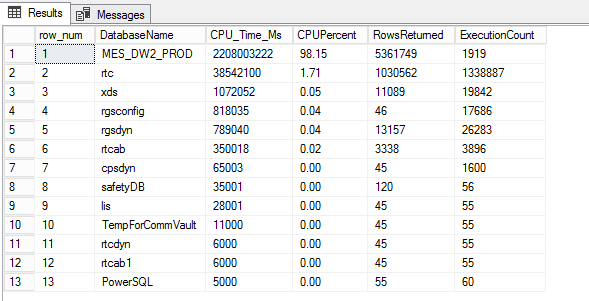
CPU – Identify workload
The use of dynamic management views to determine the CPU usage per database is a little tricky. One way to determine the CPU usage is to simply get an insight of the database usage depending on the number of queries that hit the database. It might not be the best way, but the idea is to identify the database where queries are using the most CPU time for execution.
|
1 2 3 4 5 6 7 8 9 10 11 12 13 14 15 16 17 18 19 20 21 22 23 24 25 26 27 28 29 30 31 32 33 34 35 36 37 38 |
DECLARE @DML nvarchar(MAX) DECLARE @SQLShackCPUStats TABLE ( [row_num] [bigint] NULL, [DatabaseName] [nvarchar](128) NULL, [CPU_Time_Ms] [bigint] NULL, [CPUPercent] [decimal](5, 2) NULL, [RowsReturned] bigint, ExecutionCount bigint ) SET @DML='WITH DBCPUStats AS (SELECT DatabaseID, DB_Name(DatabaseID) AS [DatabaseName], SUM(total_worker_time) AS [CPU_Time_Ms], SUM(execution_count) AS [ExecutionCount], SUM(total_rows) AS [RowsReturned] FROM sys.dm_exec_query_stats AS qs WITH (NOLOCK) CROSS APPLY (SELECT CONVERT(int, value) AS [DatabaseID] FROM sys.dm_exec_plan_attributes(qs.plan_handle) WHERE attribute = N''dbid'') AS F_DB GROUP BY DatabaseID) SELECT ROW_NUMBER() OVER(ORDER BY [CPU_Time_Ms] DESC) AS [row_num], DatabaseName, [CPU_Time_Ms], CAST([CPU_Time_Ms] * 1.0 / SUM([CPU_Time_Ms]) OVER() * 100.0 AS DECIMAL(5, 2)) AS [CPUPercent], [RowsReturned], [ExecutionCount] FROM DBCPUStats WHERE DatabaseID > 4 -- system databases AND DatabaseID <> 32767 -- ResourceDB ORDER BY row_num OPTION (RECOMPILE)' --How many Virtual Log Files or VLFs are present in your log file. INSERT INTO @SQLShackCPUStats EXEC sp_executesql @DML SELECT * FROM @SQLShackCPUStats |
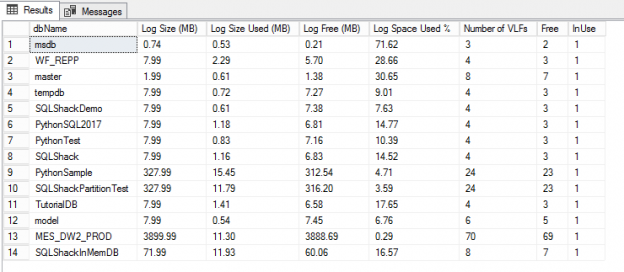
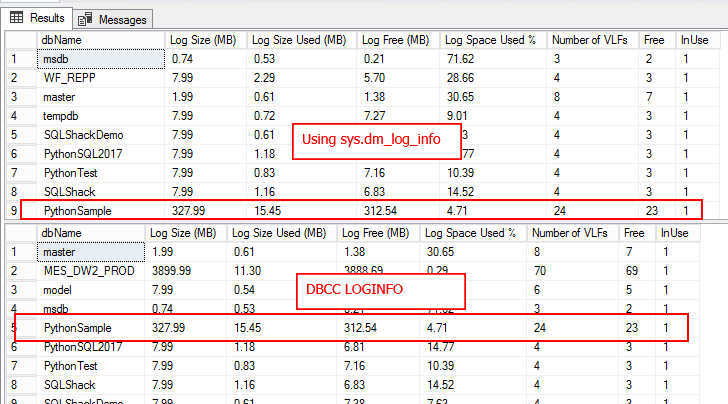
Manage VLFs
The right configuration of the transaction log is critical to database performance. The log writes all the transactions prior to committing them into the data file. In many cases, the transaction logs grow significantly. Managing and understanding how the transaction log is growing gives a good indication about system performance.
In SQL 2017, a new DMF, sys.dm_db_log_info is going to be replacing DBCC LOGINFO. This DMF gives a clear picture of the databases having high number of VLF’s along with many other useful columns.
|
1 2 3 4 5 6 7 8 9 10 11 12 13 14 15 16 17 18 19 20 21 22 23 24 25 26 |
WITH DatbaseVLF AS( SELECT DB_ID(dbs.[name]) AS DatabaseID, dbs.[name] AS dbName, CONVERT(DECIMAL(18,2), p2.cntr_value/1024.0) AS [Log Size (MB)], CONVERT(DECIMAL(18,2), p1.cntr_value/1024.0) AS [Log Size Used (MB)] FROM sys.databases AS dbs WITH (NOLOCK) INNER JOIN sys.dm_os_performance_counters AS p1 WITH (NOLOCK) ON dbs.name = p1.instance_name INNER JOIN sys.dm_os_performance_counters AS p2 WITH (NOLOCK) ON dbs.name = p2.instance_name WHERE p1.counter_name LIKE N'Log File(s) Used Size (KB)%' AND p2.counter_name LIKE N'Log File(s) Size (KB)%' AND p2.cntr_value > 0 ) SELECT [dbName], [Log Size (MB)], [Log Size Used (MB)], [Log Size (MB)]-[Log Size Used (MB)] [Log Free (MB)], cast([Log Size Used (MB)]/[Log Size (MB)]*100 as decimal(10,2)) [Log Space Used %], COUNT(b.database_id) AS [Number of VLFs] , sum(case when b.vlf_status = 0 then 1 else 0 end) as Free, sum(case when b.vlf_status != 0 then 1 else 0 end) as InUse FROM DatbaseVLF AS vlf CROSS APPLY sys.dm_db_log_info(vlf.DatabaseID) b GROUP BY dbName, [Log Size (MB)],[Log Size Used (MB)] |

Using DBCC LOGINFO
|
1 2 3 4 5 6 7 8 9 10 11 12 13 14 15 16 17 18 19 20 21 22 23 24 25 26 27 28 29 30 31 32 33 34 35 36 37 38 39 40 41 42 43 44 45 46 47 48 49 50 51 52 53 54 55 56 57 58 59 60 |
CREATE TABLE #VLFInfo( [RecoveryUnitId] int NULL, [FileId] [tinyint] NULL, [FileSize] [bigint] NULL, [StartOffset] [bigint] NULL, [FSeqNo] [int] NULL, [Status] [tinyint] NULL, [Parity] [tinyint] NULL, [CreateLSN] [numeric](25, 0) NULL ) ON [PRIMARY] CREATE TABLE #VLFCountResults(databasename sysname,fileid int, Free int, InUse int, VLFCount int) EXEC sp_MSforeachdb N'Use [?]; INSERT INTO #VLFInfo EXEC sp_executesql N''DBCC LOGINFO([?])'' ;with vlfUse as ( select max(db_name()) databasename,fileid, sum(case when status = 0 then 1 else 0 end) as Free, sum(case when status != 0 then 1 else 0 end) as InUse, count(*) cnt from #VLFInfo group by fileid ) INSERT INTO #VLFCountResults select * from vlfUse TRUNCATE TABLE #VLFInfo ' --select * from #VLFCountResults ;WITH DatbaseVLF AS( SELECT DB_ID(dbs.[name]) AS DatabaseID, dbs.[name] AS dbName, CONVERT(DECIMAL(18,2), p2.cntr_value/1024.0) AS [Log Size (MB)], CONVERT(DECIMAL(18,2), p1.cntr_value/1024.0) AS [Log Size Used (MB)] FROM sys.databases AS dbs WITH (NOLOCK) INNER JOIN sys.dm_os_performance_counters AS p1 WITH (NOLOCK) ON dbs.name = p1.instance_name INNER JOIN sys.dm_os_performance_counters AS p2 WITH (NOLOCK) ON dbs.name = p2.instance_name WHERE p1.counter_name LIKE N'Log File(s) Used Size (KB)%' AND p2.counter_name LIKE N'Log File(s) Size (KB)%' AND p2.cntr_value > 0 ) SELECT [dbName], [Log Size (MB)], [Log Size Used (MB)], [Log Size (MB)]-[Log Size Used (MB)] [Log Free (MB)], cast([Log Size Used (MB)]/[Log Size (MB)]*100 as decimal(10,2)) [Log Space Used %], max(VLFCount) AS [Number of VLFs] , max(Free) Free, Max(InUse) InUse FROM DatbaseVLF AS vlf INNER JOIN #VLFCountResults b on vlf.dbName=b.databasename GROUP BY dbName, [Log Size (MB)],[Log Size Used (MB)] DROP TABLE #VLFInfo; DROP TABLE #VLFCountResults |
T-SQL
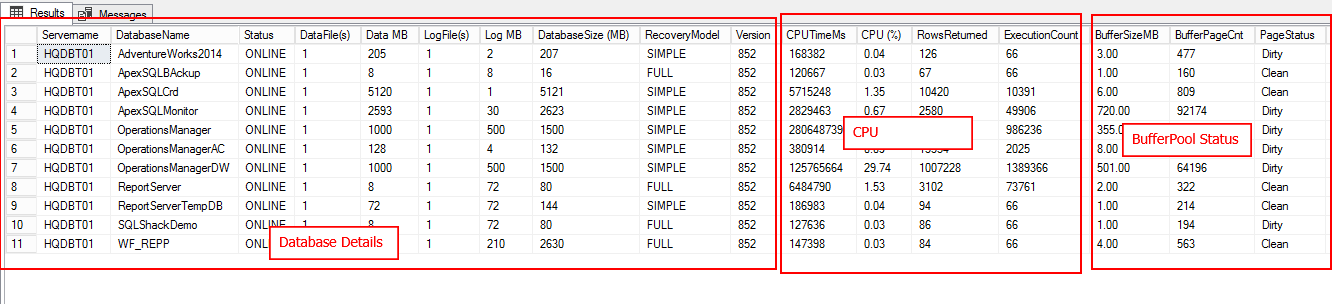
The following section deals with compiling all the above pieces into a single SQL statement. The consolidated statement can be found in Appendix A
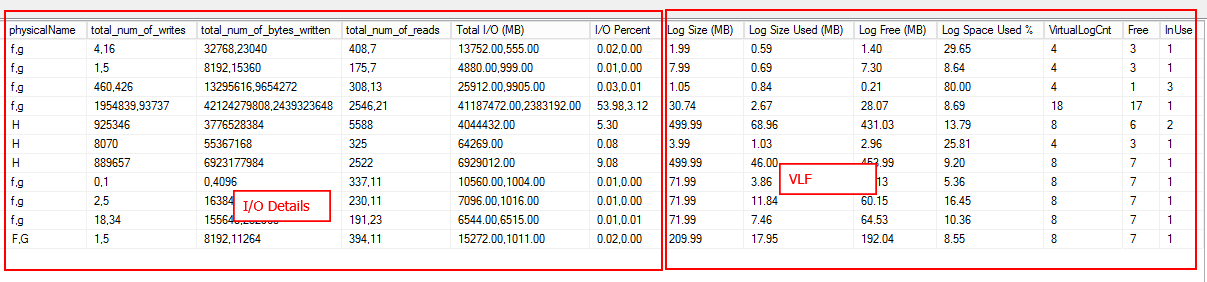
Due to the large number of columns, the output is divided into two figures which is shown below
First-Part of the output consists of:
- Database details
- CPU – Workload
- Buffer output
- User connections
Second-Part of the output includes:
- I/O
- VLF Info
Conclusion
This article provides an outline of metrics such as DB internals, CPU usage, Memory allocation, User connections, I/O usage and VLF’s. This gives a DBA an idea of the resource-intensive database to enable him/her to plan a better strategy to handle the most critical databases.
It also describes how transaction logs are being used, and what is being used so that one can start making decisions on how large the transaction log can or should be.
These scripts are not meant to be the ultimate ways to measure the performance of a system. Instead, they provide ways to quickly understand the general performance characteristics of your system, at a glance.
See also Top string functions in SQL Server 2017.
Appendix A
T-SQL Code
|
1 2 3 4 5 6 7 8 9 10 11 12 13 14 15 16 17 18 19 20 21 22 23 24 25 26 27 28 29 30 31 32 33 34 35 36 37 38 39 40 41 42 43 44 45 46 47 48 49 50 51 52 53 54 55 56 57 58 59 60 61 62 63 64 65 66 67 68 69 70 71 72 73 74 75 76 77 78 79 80 81 82 83 84 85 86 87 88 89 90 91 92 93 94 95 96 97 98 99 100 101 102 103 104 105 106 107 108 109 110 111 112 113 114 115 116 117 118 119 120 121 122 123 124 125 126 127 128 129 130 131 132 133 134 135 136 137 138 139 140 141 142 143 144 145 146 147 148 149 150 151 152 153 154 155 156 157 158 159 160 161 162 163 164 165 166 167 168 169 170 171 172 173 174 175 176 177 178 179 180 181 182 183 184 185 186 187 188 189 190 191 192 193 194 195 196 197 198 199 200 201 202 203 204 205 206 207 208 209 210 211 212 213 214 215 216 217 218 219 220 221 222 223 224 225 226 227 228 229 230 231 232 233 234 235 236 237 238 239 240 241 242 243 244 245 246 247 248 249 250 251 252 253 254 255 256 257 258 259 260 261 262 263 264 265 266 267 268 269 270 271 272 273 274 275 276 277 278 279 280 281 282 283 284 285 286 287 288 289 290 291 292 293 294 295 296 297 298 299 300 301 302 303 304 305 306 307 308 309 310 311 312 313 314 315 316 317 318 319 320 321 322 323 324 325 326 327 328 329 330 331 332 333 334 335 336 337 338 339 340 341 342 343 344 345 346 347 348 349 350 351 352 353 354 355 356 357 358 |
USE MASTER GO DECLARE @DML1 nvarchar(MAX), @DML2 nvarchar(MAX), @DML3 nvarchar(MAX), @DML4 nvarchar(MAX) DECLARE @SQLShackIOStatistics TABLE ( [I/ORank] [int] NULL, [DBName] [nvarchar](128) NULL, [driveLetter] [nvarchar](1) NULL, [totalNumOfWrites] [bigint] NULL, [totalNumOfBytesWritten] [bigint] NULL, [totalNumOfReads] [bigint] NULL, totalNumOfBytesRead [bigint] NULL, [totalI/O(MB)] [decimal](12,2) NULL, [I/O(%)] [decimal](5, 2) NULL, [SizeOfFile] [decimal](10,2) NULL ) SET @DML1=' WITH SQLShackIOStatistics AS ( select db_name(mf.database_id) as dbname, left(mf.physical_name, 1) as driveLetter, sum(vfs.num_of_writes) [totalNumOfWrites], sum(vfs.num_of_bytes_written) [totalNumOfBytesWritten], sum(vfs.num_of_reads) [totalNumOfReads], sum(vfs.num_of_bytes_read) [totalNumOfBytesRead], cast(SUM(num_of_bytes_read + num_of_bytes_written)/1024 AS DECIMAL(12, 2)) AS [TotIO(MB)], MAX(cast(vfs.size_on_disk_bytes/1024/1024.00 as decimal(10,2))) SizeMB from sys.master_files mf join sys.dm_io_virtual_file_stats(NULL, NULL) vfs on mf.database_id=vfs.database_id and mf.file_id=vfs.file_id GROUP BY mf.database_id,left(mf.physical_name, 1)) SELECT ROW_NUMBER() OVER(ORDER BY [TotIO(MB)] DESC) AS [I/ORank], [dbname], driveLetter, [totalNumOfWrites], totalNumOfBytesWritten, totalNumOfReads, totalNumOfBytesRead, [TotIO(MB)] AS [I/O(MB)], CAST([TotIO(MB)]/ SUM([TotIO(MB)]) OVER() * 100.0 AS DECIMAL(5,2)) AS [I/O(%)], SizeMB FROM SQLShackIOStatistics ORDER BY [I/ORank] OPTION (RECOMPILE) ' INSERT INTO @SQLShackIOStatistics EXEC sp_executesql @DML1 --SQL 2017 --select [Database Name], --STRING_AGG( [I/O Rank],',') [I/O Rank], --STRING_AGG(physicalName,',') physicalName, --STRING_AGG(total_num_of_writes,',') total_num_of_writes, --STRING_AGG(total_num_of_bytes_written,',') total_num_of_bytes_written, --STRING_AGG(total_num_of_reads,',') total_num_of_reads, --STRING_AGG([Total I/O (MB)],',') [Total I/O (MB)], --STRING_AGG([I/O Percent],',') WITHIN GROUP (ORDER BY [Database Name] ASC) [I/O Percent] --from @Aggregate_IO_Statistics --group by [Database Name] SELECT * FROM @SQLShackIOStatistics --User Connections DECLARE @SQLShackUserConn TABLE ( DBName [nvarchar](128) NULL, No_Of_Connections [int] NULL ) SET @DML2=' SELECT DB_NAME(dbid) DBName,COUNT(*) No_Of_Connections FROM sys.sysprocesses --where kpid>0 group by DB_NAME(dbid) ORDER BY DB_NAME(dbid) DESC OPTION (RECOMPILE) ' INSERT INTO @SQLShackUserConn EXEC sp_executesql @DML2 select * from @SQLShackUserConn --Memory DECLARE @SQLShackCacheMemory TABLE( [Database_Name] [nvarchar](128) NULL, BufferPageCnt int, BufferSizeMB [decimal](10, 2) NULL, PageStatus varchar(10) ) SET @DML3='SELECT DBName = CASE WHEN database_id = 32767 THEN ''RESOURCEDB'' ELSE DB_NAME(database_id) END, Bufferpage=count_BIG(*), BufferSizeMB = COUNT(1)/128, PageStatus = max(CASE WHEN is_modified = 1 THEN ''Dirty'' ELSE ''Clean'' END) FROM sys.dm_os_buffer_descriptors GROUP BY database_id ORDER BY 2 DESC' INSERT INTO @SQLShackCacheMemory EXEC sp_executesql @DML3 SELECT * FROM @SQLShackCacheMemory --SELECT * FROM @CacheMemoryDB --CPU DECLARE @SQLShackCPUStats TABLE ( [row_num] [bigint] NULL, [DatabaseName] [nvarchar](128) NULL, [CPU_Time_Ms] [bigint] NULL, [CPUPercent] [decimal](5, 2) NULL, [RowsReturned] bigint, ExecutionCount bigint ) SET @DML4='WITH DBCPUStats AS (SELECT DatabaseID, DB_Name(DatabaseID) AS [DatabaseName], SUM(total_worker_time) AS [CPU_Time_Ms], SUM(execution_count) AS [ExecutionCount], SUM(total_rows) AS [RowsReturned] FROM sys.dm_exec_query_stats AS qs WITH (NOLOCK) CROSS APPLY (SELECT CONVERT(int, value) AS [DatabaseID] FROM sys.dm_exec_plan_attributes(qs.plan_handle) WHERE attribute = N''dbid'') AS F_DB GROUP BY DatabaseID) SELECT ROW_NUMBER() OVER(ORDER BY [CPU_Time_Ms] DESC) AS [row_num], DatabaseName, [CPU_Time_Ms], CAST([CPU_Time_Ms] * 1.0 / SUM([CPU_Time_Ms]) OVER() * 100.0 AS DECIMAL(5, 2)) AS [CPUPercent], [RowsReturned], [ExecutionCount] FROM DBCPUStats WHERE DatabaseID > 4 -- system databases AND DatabaseID <> 32767 -- ResourceDB ORDER BY row_num OPTION (RECOMPILE)' --How many Virtual Log Files or VLFs are present in your log file. INSERT INTO @SQLShackCPUStats EXEC sp_executesql @DML4 SELECT * FROM @SQLShackCPUStats --VLF CREATE TABLE #VLFInfo( [RecoveryUnitId] int NULL, [FileId] [tinyint] NULL, [FileSize] [bigint] NULL, [StartOffset] [bigint] NULL, [FSeqNo] [int] NULL, [Status] [tinyint] NULL, [Parity] [tinyint] NULL, [CreateLSN] [numeric](25, 0) NULL ) ON [PRIMARY] CREATE TABLE #VLFCountResults(databasename sysname,fileid int, Free int, InUse int, VLFCount int) EXEC sp_MSforeachdb N'Use [?]; INSERT INTO #VLFInfo EXEC sp_executesql N''DBCC LOGINFO([?])'' ;with vlfUse as ( select max(db_name()) databasename,fileid, sum(case when status = 0 then 1 else 0 end) as Free, sum(case when status != 0 then 1 else 0 end) as InUse, count(*) cnt from #VLFInfo group by fileid ) INSERT INTO #VLFCountResults select * from vlfUse TRUNCATE TABLE #VLFInfo ' -- SQL 2017 --;WITH DatbaseVLF AS( --SELECT --DB_ID(dbs.[name]) AS DatabaseID, --dbs.[name] AS dbName, --CONVERT(DECIMAL(18,2), p2.cntr_value/1024.0) AS [Log Size (MB)], --CONVERT(DECIMAL(18,2), p1.cntr_value/1024.0) AS [Log Size Used (MB)] --FROM sys.databases AS dbs WITH (NOLOCK) --INNER JOIN sys.dm_os_performance_counters AS p1 WITH (NOLOCK) ON dbs.name = p1.instance_name --INNER JOIN sys.dm_os_performance_counters AS p2 WITH (NOLOCK) ON dbs.name = p2.instance_name --WHERE p1.counter_name LIKE N'Log File(s) Used Size (KB)%' --AND p2.counter_name LIKE N'Log File(s) Size (KB)%' --AND p2.cntr_value > 0 --) --SELECT [dbName], -- [Log Size (MB)], -- [Log Size Used (MB)], -- [Log Size (MB)]-[Log Size Used (MB)] [Log Free (MB)], -- cast([Log Size Used (MB)]/[Log Size (MB)]*100 as decimal(10,2)) [Log Space Used %], -- COUNT(b.database_id) AS [Number of VLFs] , -- sum(case when b.vlf_status = 0 then 1 else 0 end) as Free, -- sum(case when b.vlf_status != 0 then 1 else 0 end) as InUse --FROM DatbaseVLF AS vlf --CROSS APPLY sys.dm_db_log_info(vlf.DatabaseID) b --GROUP BY dbName, [Log Size (MB)],[Log Size Used (MB)] --select * from #VLFCountResults ;WITH DatbaseVLF AS( SELECT DB_ID(dbs.[name]) AS DatabaseID, dbs.[name] AS dbName, CONVERT(DECIMAL(18,2), p2.cntr_value/1024.0) AS [Log Size (MB)], CONVERT(DECIMAL(18,2), p1.cntr_value/1024.0) AS [Log Size Used (MB)] FROM sys.databases AS dbs WITH (NOLOCK) INNER JOIN sys.dm_os_performance_counters AS p1 WITH (NOLOCK) ON dbs.name = p1.instance_name INNER JOIN sys.dm_os_performance_counters AS p2 WITH (NOLOCK) ON dbs.name = p2.instance_name WHERE p1.counter_name LIKE N'Log File(s) Used Size (KB)%' AND p2.counter_name LIKE N'Log File(s) Size (KB)%' AND p2.cntr_value > 0 ) SELECT db.Servername, cs.DatabaseName DatabaseName, db.Status, db.DataFiles [DataFile(s)], db.[Data MB], db.LogFiles [LogFile(s)], db.[Log MB], db.TotalSizeMB [DatabaseSize (MB)], db.RecoveryModel, db.Version, isnull(cs.CPU_Time_Ms,0) CPUTimeMs, isnull(cs.CPUPercent,0) [CPU (%)], cs.RowsReturned, cs.ExecutionCount, isnull(cm.BufferSizeMB ,0) BufferSizeMB, cm.BufferPageCnt , cm.PageStatus, isnull(uc.No_Of_connections,0) NumberOfConnections, AIS.physicalName, AIS.total_num_of_writes, AIS.total_num_of_bytes_written, AIS.total_num_of_reads, AIS.[Total I/O (MB)], AIS.[I/O Percent], VR.[Log Size (MB)], VR.[Log Size Used (MB)], VR.[Log Free (MB)], VR.[Log Space Used %], VR.[Number of VLFs] VirtualLogCnt, VR.Free, VR.InUse FROM @SQLShackCPUStats cs left join @SQLShackCacheMemory CM on cm.Database_Name=cs.DatabaseName left join @SQLShackUserConn uc on uc.dbname=cs.DatabaseName left join ( SELECT [dbName], [Log Size (MB)], [Log Size Used (MB)], [Log Size (MB)]-[Log Size Used (MB)] [Log Free (MB)], cast([Log Size Used (MB)]/[Log Size (MB)]*100 as decimal(10,2)) [Log Space Used %], max(VLFCount) AS [Number of VLFs] , max(Free) Free, Max(InUse) InUse FROM DatbaseVLF AS vlf INNER JOIN #VLFCountResults b on vlf.dbName=b.databasename GROUP BY dbName, [Log Size (MB)],[Log Size Used (MB)] ) VR on VR.[dbName]=cs.DatabaseName left join ( select [DBName], [I/O Rank] = STUFF( (SELECT ',' + cast(s.[I/ORank] as varchar(3)) FROM @SQLShackIOStatistics s WHERE s.[DBName] = t.[DBName] FOR XML PATH('')),1,1,''), physicalName=STUFF( (SELECT ',' + s.driveLetter FROM @SQLShackIOStatistics s WHERE s.[DBName] = t.[DBName] FOR XML PATH('')),1,1,'') , FileSizeMB=STUFF( (SELECT ',' + cast(s.SizeOfFile as varchar(20)) FROM @SQLShackIOStatistics s WHERE s.[DBName] = t.[DBName] FOR XML PATH('')),1,1,'') , total_num_of_writes=STUFF( (SELECT ',' + cast(s.[totalNumOfWrites] as varchar(20)) FROM @SQLShackIOStatistics s WHERE s.[DBName] = t.[DBName] FOR XML PATH('')),1,1,''), total_num_of_bytes_written=STUFF( (SELECT ',' + cast(s.[totalNumOfBytesWritten] as varchar(20)) FROM @SQLShackIOStatistics s WHERE s.[DBName] = t.[DBName] FOR XML PATH('')),1,1,''), total_num_of_reads=STUFF( (SELECT ',' + cast(s.totalnumofreads as varchar(20)) FROM @SQLShackIOStatistics s WHERE s.[DBName] = t.[DBName] FOR XML PATH('')),1,1,''), total_num_of_Bytes_reads=STUFF( (SELECT ',' + cast(s.totalNumOfBytesRead as varchar(20)) FROM @SQLShackIOStatistics s WHERE s.[DBName] = t.[DBName] FOR XML PATH('')),1,1,''), [Total I/O (MB)]=STUFF( (SELECT ',' + cast(s.[TotalI/O(MB)] as varchar(20)) FROM @SQLShackIOStatistics s WHERE s.[DBName] = t.[DBName] FOR XML PATH('')),1,1,''), [I/O Percent]=STUFF( (SELECT ',' + cast(s.[I/O(%)] as varchar(20)) FROM @SQLShackIOStatistics s WHERE s.[DBName] = t.[DBName] FOR XML PATH('')),1,1,'') from @SQLShackIOStatistics t group by [DBName] )AIS on AIS.DBName=cs.DatabaseName inner join ( SELECT @@SERVERNAME Servername, CONVERT(VARCHAR(25), DB.name) AS dbName, CONVERT(VARCHAR(10), DATABASEPROPERTYEX(name, 'status')) AS [Status], (SELECT COUNT(1) FROM sysaltfiles WHERE DB_NAME(dbid) = DB.name AND groupid !=0 ) AS DataFiles, (SELECT SUM((size*8)/1024) FROM sysaltfiles WHERE DB_NAME(dbid) = DB.name AND groupid!=0) AS [Data MB], (SELECT COUNT(1) FROM sysaltfiles WHERE DB_NAME(dbid) = DB.name AND groupid=0) AS LogFiles, (SELECT SUM((size*8)/1024) FROM sysaltfiles WHERE DB_NAME(dbid) = DB.name AND groupid=0) AS [Log MB], (SELECT SUM((size*8)/1024) FROM sysaltfiles WHERE DB_NAME(dbid) = DB.name AND groupid!=0)+(SELECT SUM((size*8)/1024) FROM sysaltfiles WHERE DB_NAME(dbid) = DB.name AND groupid=0) TotalSizeMB, convert(sysname,DatabasePropertyEx(name,'Recovery')) RecoveryModel , convert(sysname,DatabasePropertyEx(name,'Version')) Version FROM sys.databases DB ) DB on DB.dbName=cs.DatabaseName --order by io.[I/O Percent],cs.CPUPercent,cm.[Cached Size (MB)]desc DROP TABLE #VLFInfo; DROP TABLE #VLFCountResults; |

My specialty lies in designing & implementing High availability solutions and cross-platform DB Migration. The technologies currently working on are SQL Server, PowerShell, Oracle and MongoDB.
View all posts by Prashanth Jayaram
- Stairway to SQL essentials - April 7, 2021
- A quick overview of database audit in SQL - January 28, 2021
- How to set up Azure Data Sync between Azure SQL databases and on-premises SQL Server - January 20, 2021