

This article gives fundamental insights into which 5 reasons can cause to drop off the query performances in SQL Server.
Introduction
While a database person is working on an ordinary business day, they may receive a mail or call complaining about query performance. The sentence is usually “My application or report suddenly started working slowly but there was no problem yesterday”. Now let’s see how to approach such problems. In fact, numerous factors may lead to degrading query performance. For instance, we can count the following reasons which are the first things that come into our minds:
- Outdated statistics
- Parameter sniffing
- Tempdb settings
- Insufficient disk I/O performance
- Globally applied trace flags
- Database or database server setting
- Fragmented indexes
- Client application session settings changings
- Schema changings in the queried tables
- Insufficient memory and CPU resource
- Virtual machine settings
- Lock and deadlock problems
- SQL Server version bugs
In the next sections of the article, we will talk about the first five reasons from the above list.
Outdated (stale) statistics
Statistics are one of the main factors that may affect query performance because it stores analytical information about the distribution of table column values. This statistical data is used by the optimizer to estimate how many rows will return when a query is executed. Based on this estimation, the optimizer calculates the resource (CPU, Memory, etc.) requirement of a query. In some cases, the statistics can become stale because of the lots of data modification even the Auto Update Statistics option is enabled. Inaccurate statistics information will cause incorrect estimations so the optimizer may generate inefficient query plans. When a difference is noticed between the estimated and actual rows in an actual execution plan of a query, we may suspect that the statistics are out of date. Now, let’s make a little test. At first, we will execute the following query to create our sample table and populate it with some data in the Adventureworks database.
|
1 2 3 4 5 6 7 8 9 10 11 12 13 14 15 16 17 18 19 20 21 22 23 24 |
DROP TABLE IF EXISTS Test_Table GO CREATE TABLE Test_Table( Id int PRIMARY KEY IDENTITY(1,1) NOT NULL, UnitPrice money NULL, CarrierTrackingNumber varchar(100) NULL) GO INSERT INTO Test_Table (UnitPrice,CarrierTrackingNumber) SELECT TOP 2 UnitPrice,CarrierTrackingNumber FROM Sales.SalesOrderDetail GO SELECT UnitPrice,CarrierTrackingNumber FROM Test_Table WHERE UnitPrice BETWEEN 5 and 2020 GO UPDATE STATISTICS Test_Table WITH FULLSCAN, NORECOMPUTE; GO INSERT INTO Test_Table (UnitPrice,CarrierTrackingNumber) SELECT UnitPrice,CarrierTrackingNumber FROM Sales.SalesOrderDetail GO DBCC FREEPROCCACHE GO |
As a second step, we will enable the actual execution plan and execute the following query.
|
1 2 3 4 5 |
SELECT UnitPrice,CarrierTrackingNumber FROM Test_Table WHERE UnitPrice BETWEEN 5 AND 2020 ORDER BY CarrierTrackingNumber DESC |
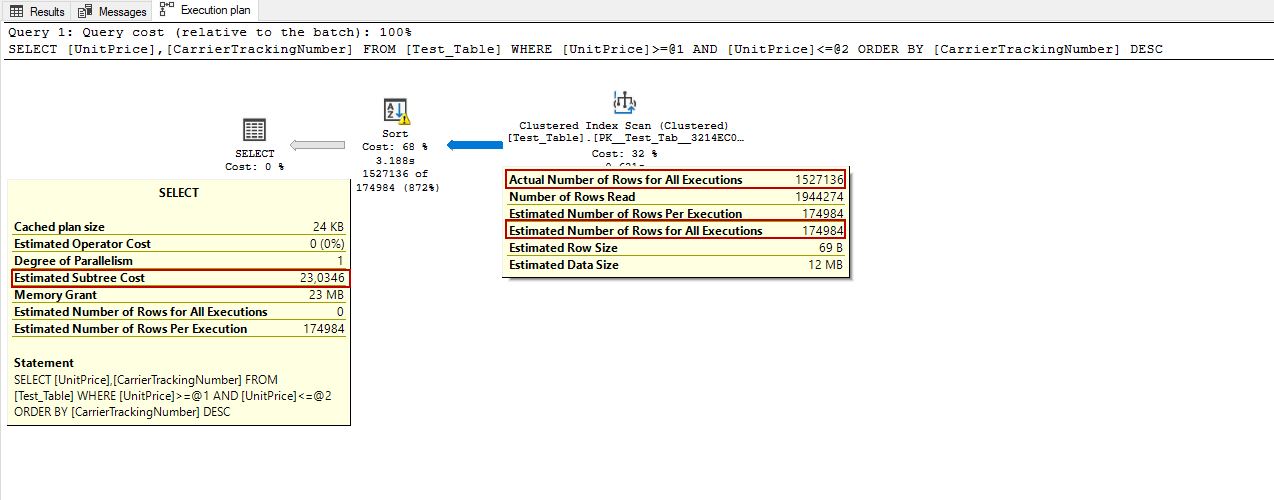
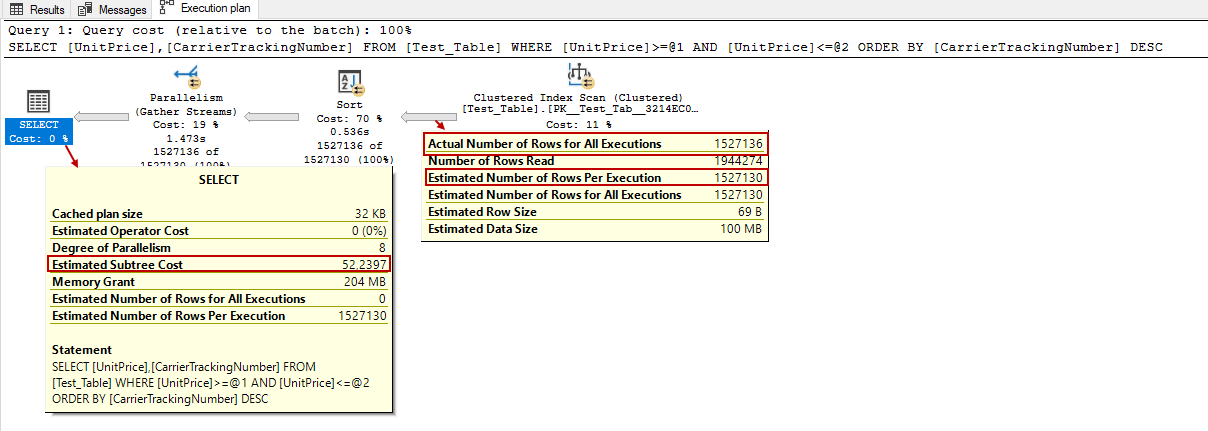
When we hover over the mouse over the arrow between the index scan and sort operator, the actual and estimated number of the rows appear in a pop-up window. For our example, there is a dramatic difference between the estimated and actual number of rows and this difference leads to making a wrong estimation by the optimizer. As a result of this wrong estimation, the query is granted less memory than is actually required to perform the sort operation so the sort ends up spilling to disk. Consequently, this example shows us how an outdated statistic affects query performance negatively, and also, the miss estimated row number misguide the optimizer calculation of the Estimated Subtree Cost. After the update of the statistics, the Estimated Subtree Cost will change and the estimated and actual number of rows will show the very closest numbers.
|
1 2 3 4 5 6 7 8 9 10 11 |
UPDATE STATISTICS Test_Table WITH FULLSCAN, NORECOMPUTE; GO DBCC FREEPROCCACHE GO SELECT UnitPrice,CarrierTrackingNumber FROM Test_Table WHERE UnitPrice between 5 and 2020 ORDER BY CarrierTrackingNumber DESC |
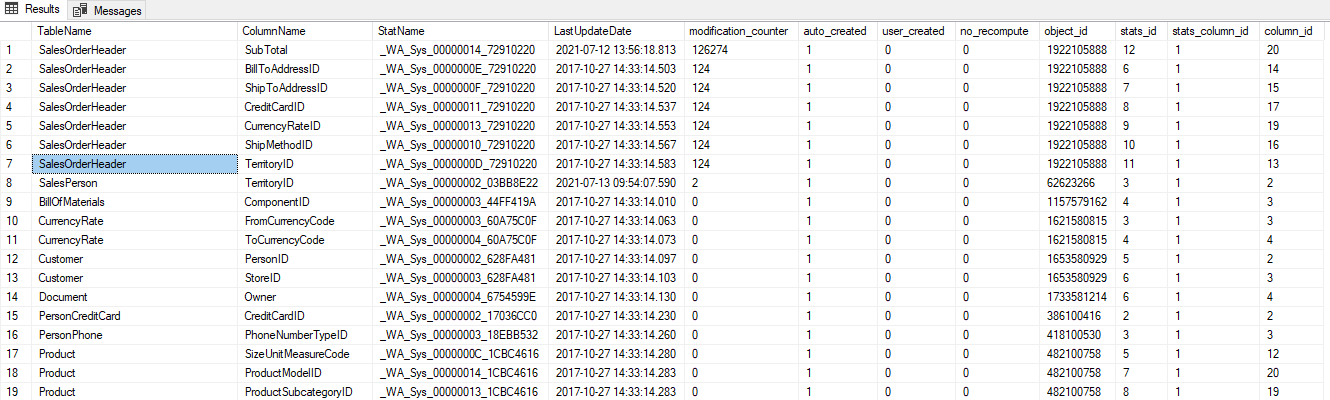
Enabling the Auto Update Statistics option allows to maintain statistics by the SQL Server automatically but checking the status of the statistics minimizes performance problems that can be occurred because of the outdated statistics. The following query returns the modification counter and last update time of the statistics in a database. So that, we can detect outdated statistics.
|
1 2 3 4 5 6 7 8 9 10 11 12 13 14 15 16 17 18 19 20 21 22 23 24 25 26 27 28 |
SELECT DISTINCT OBJECT_NAME(stasts.[object_id]) AS TableName, c.name AS ColumnName, stasts.name AS StatName, STATS_DATE(stasts.[object_id], stasts.stats_id) AS LastUpdateDate, dsp.modification_counter, stasts.auto_created, stasts.user_created, stasts.no_recompute, stasts.[object_id], stasts.stats_id, statscol.stats_column_id, statscol.column_id FROM sys.stats stasts JOIN sys.stats_columns statscol ON statscol.[object_id] = stasts.[object_id] AND statscol.stats_id = stasts.stats_id JOIN sys.columns c ON c.[object_id] = statscol.[object_id] AND c.column_id = statscol.column_id JOIN sys.partitions partion ON partion.[object_id] = stasts.[object_id] JOIN sys.objects objectlist ON partion.[object_id] = objectlist.[object_id] CROSS APPLY sys.dm_db_stats_properties(statscol.[object_id], stasts.stats_id) AS dsp WHERE OBJECTPROPERTY(stasts.OBJECT_ID, 'IsUserTable') = 1 AND (stasts.auto_created = 1 OR stasts.user_created = 1) ORDER BY modification_counter DESC, STATS_DATE(stasts.[object_id], stasts.stats_id) ASC |
Parameter sniffing
Stored procedures are used extensively by the database developers and database administrator because of the following 2 advantages:
- Allows encapsulating the T-SQL scripts thus it provides the reusability
- Improves the query performance by using cached execution plans for the different parameters
When the stored procedures are executed with a parameter or parameters, the optimizer generates an optimum execution plan according to the passed parameters and will cache this plan for the next execution of the stored procedure. However, parameter sniffing causes an issue when the cached execution plan does not show an effective performance for given input parameters during any execution of the procedure. The main symptom of parameter sniffing is that the query performance is very poor in the application, but when we execute the same procedure in SQL Server Management Studio (SSMS), it shows satisfying performance.
You can refer to the article, SQL Server 2016 Parameter Sniffing for more details.
We can apply the following suggestions to fix the parameter sniffing problems:
- Using the OPTIMIZE FOR query hint
- Using the WITH RECOMPILE hint
- Using OPTION (RECOMPILE) hint
- Converting the stored procedure to use dynamic SQL
- Disabling Parameter Sniffing option at the database level
- Using local variables in the stored procedure
Tempdb
Tempdb is a shared system database and it is used by the various database activities and objects to store temporary data therefore it plays a critical role in the query performances. Because of this performance factor of the tempdb, we can consider applying the following practices to improve the performance of the tempdb database
- Create multiple tempdb data files according to the server CPU core
- Use a fast dedicated disk for the tempdb database files
- Consider using trace flags 1117 and 1118 for the earlier version of the SQL Server 2016
- Monitor the tempdb growings and latch contention problems
- Consider enabling Memory-Optimized TempDB Metadata feature for the SQL Server 2019 versions
Insufficient disk I/O performance
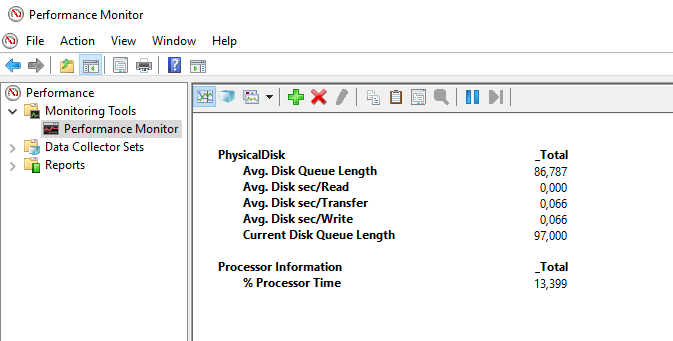
The I/O subsystem performance directly affects the query performance because when SQL Server takes a query request it reads data from the storage systems if the data is not located in the buffer pool. At the same time, the transaction log files,tempdb, and backup activities can generate significant I/O traffic on the storage subsystems. One of the main symptoms of the poor I/O performance is to monitor the PAGEIOLATCH, WRITELOG and ASYNC_IO_COMPLETION wait types in the SQL Server. At this point, we can start an investigation to measure Avg Disk Sec/Transfer.
Avg Disk Sec/Transfer indicates the latency time when the write and read activities are done. If this value shows more than 25 ms, we can suspect the I/O performance of our disk subsystem.
Diskspd is another tool that can help to identify disk I/O problems. With the help of the Diskspd, we can test our disk system performance capacities.
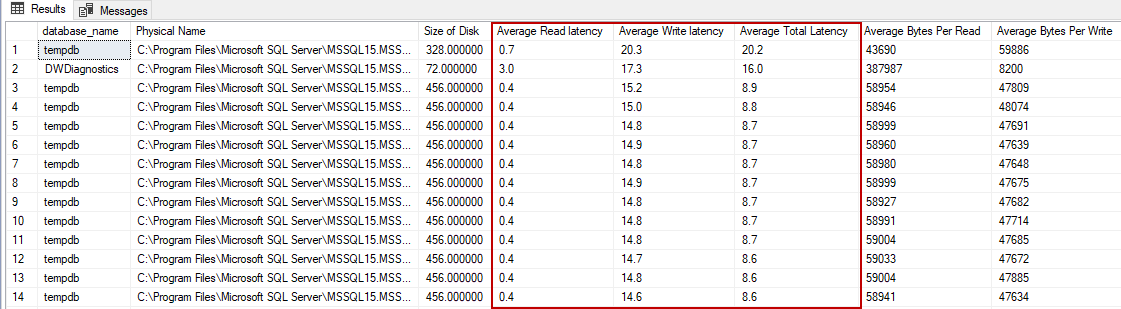
As the last tool to monitor the SQL Server I/O problems, we can use the sys.dm_io_virtual_file_stats view. Using this view, we can obtain information about the latencies for all database files. Through the following query, we can return the average read and write latencies about the database files.
|
1 2 3 4 5 6 7 8 9 10 11 12 13 14 15 |
SELECT DB_NAME(vfs.database_id) AS database_name ,physical_name AS [Physical Name], size_on_disk_bytes / 1024 / 1024. AS [Size of Disk] , CAST(io_stall_read_ms/(1.0 + num_of_reads) AS NUMERIC(10,1)) AS [Average Read latency] , CAST(io_stall_write_ms/(1.0 + num_of_writes) AS NUMERIC(10,1)) AS [Average Write latency] , CAST((io_stall_read_ms + io_stall_write_ms) /(1.0 + num_of_reads + num_of_writes) AS NUMERIC(10,1)) AS [Average Total Latency], num_of_bytes_read / NULLIF(num_of_reads, 0) AS [Average Bytes Per Read], num_of_bytes_written / NULLIF(num_of_writes, 0) AS [Average Bytes Per Write] FROM sys.dm_io_virtual_file_stats(NULL, NULL) AS vfs JOIN sys.master_files AS mf ON vfs.database_id = mf.database_id AND vfs.file_id = mf.file_id ORDER BY [Average Total Latency] DESC |
Globally applied trace flags
Trace flags are used to change a particular behavior of the SQL Server and can be applied globally, session-level, and query level.
Tip: Some trace flags might be undocumented by Microsoft for this reason before using these trace flags we need to consider all impacts on the server workload.
In terms of query performance, some trace flags change the query optimizer default characteristic and this situation may impact the query performance negatively or positively. For example trace flag 253 prevents ad-hoc query plans to stay in the query plan cache so every executed ad-hoc query will be compiled again. In the following query, we will enable this trace flag globally and execute the query.
|
1 2 3 4 5 6 7 8 9 |
DBCC TRACEON(253,-1) GO SELECT TOP 100 UnitPrice,CarrierTrackingNumber FROM Test_Table WHERE UnitPrice between 5 and 2020 ORDER BY CarrierTrackingNumber DESC GO DBCC TRACEOFF(253,-1) |
When we analyze this query execution plan, the trace flag attribute shows which trace flag is applied at which level. At the same time, the IsTheCompileTime sub-attribute shows true, which means that a trace flag is enabled during the compilation of the query.
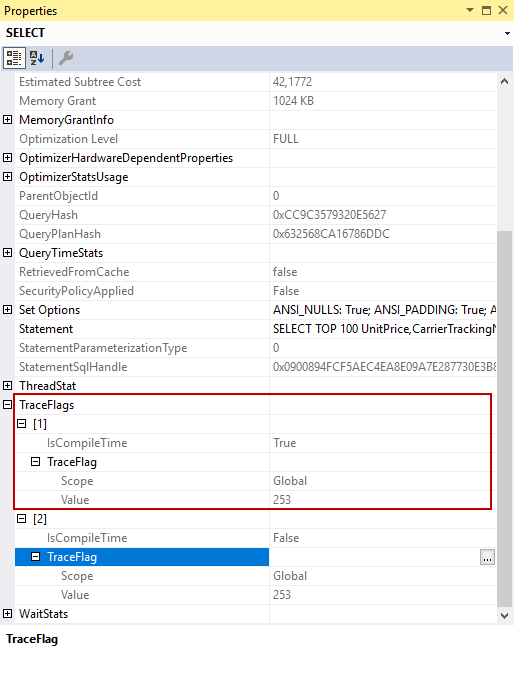
At the same time, this ad-hoc query will not be stored in the query plan cache and it is re-compiled in it is every execution.
Summary
Overcoming the query performance issues can be complicated and confusing, thus we need to evaluate all clues and then consider which reason can cause the problem.

Most of his career has been focused on SQL Server Database Administration and Development. His current interests are in database administration and Business Intelligence. You can find him on LinkedIn.
View all posts by Esat Erkec
- SQL Performance Tuning tips for newbies - April 15, 2024
- SQL Unit Testing reference guide for beginners - August 11, 2023
- SQL Cheat Sheet for Newbies - February 21, 2023