
sys.dm_os_performance_counters
sys.dm_os_performance_counters is a system Dynamic Management View (DMV) that returns one row for each SQL Server performance counter. It’s useful for obtaining information about current performance counter values. These counter values are also shown in Windows Performance Monitor, besides other operating system countersThe permission needed to query this view is VIEW SERVER STATE
However, the values the view returns can be confusing and misleading if not properly interpreted, as they can significantly vary from the values considered as normal for your SQL Server. That’s why it’s necessary to understand all the columns the view returns, especially the counter type
The columns returned by the view are:
- object_name – this is the counter category name – Memory Node, Exec Statistics, Broker TO Statistics, Query Execution, Latches, Memory Manager, and more
- counter_name – Target Server Memory (KB), Buffer cache hit ratio, Free list stalls/sec, etc.
- instance_name – the counter instance name, usually this is the database name
- cntr_value – cumulative for counters where the unit is a second. This means that sampling is required in order to calculate the counter value per one second
- cntr_type – specified the type of counter, based on its value the current value is calculated
What information does the sys.dm_os_performance_counters view provide?
If you’re using the view for the first time, to find the SQL Server performance counters that can be tracked, run:
|
1 2 3 4 |
SELECT DISTINCT [object_name] FROM sys.dm_os_performance_counters |
There are 33 different counter categories monitored in SQL Server 2012. All object names start with MSSQL$
Some counters are repeated in different categories, e.g. Cache Hit Ratio appears in the Plan Cache, Cursor Manager by Type, and Catalog Metadata categories. Also, some of the counters have multiple instances – e.g. Log File(S) Used Size (KB) has an instance for each database on the SQL Server instance
In total there are 405 different counters
|
1 2 3 4 |
SELECT DISTINCT [counter_name] FROM sys.dm_os_performance_counters |
The information that is usually overlooked, but that requires attention is the cntr_types column. It defines the type of the counter and thus the method that should be used to calculate the current counter value. If the counter type is misinterpreted, the values will be incorrectly calculated, or taken as is, without any calculation, which will result in having a wrong picture about SQL Server performance
The cntr_types column can have five different values
PERF_COUNTER_LARGE_RAWCOUNT
The cntr_types column value for the PERF_COUNTER_LARGE_RAWCOUNT counter type is 65792. These counters show the last observed, not the average value. It’s usually used to monitor object counts
This means that if you’re monitoring a counter type 65792, the value you get in the counter_value column when you query the view is the current value of the counter and no additional calculation is required
To find out the current values for the Buffer Manager Page life expectancy, execute:
|
1 2 3 4 5 6 |
SELECT * FROM sys.dm_os_performance_counters WHERE counter_name = 'Page Life expectancy' AND object_name LIKE '%buffer manager%'; |

The Page life expectancy is 47, no additional calculation is needed
Counters of this type are: General Statistics User connections, Buffer Manager Page life expectancy and Database pages, Databases – Data and Log file size (KB), Log file used size (KB), Percent Log used, Memory Manager – Free Memory (KB), and more
PERF_LARGE_RAW_BASE
The cntr_types column value for the PERF_LARGE_RAW_BASE counter type is 1073939712. These counters collect the last observed value
This counter value is used as the denominator for further calculation. The counters of this type are only used to calculate other counters available via the view
All counters that belong to this counter type have the word base in their names, so it’s a clear indication that this is not a counter that provides useful info, it’s just a base value for further calculations
|
1 2 3 4 5 |
SELECT * FROM sys.dm_os_performance_counters WHERE counter_name = 'Buffer cache hit ratio base' |

These counters are: Buffer Cache Hit Ratio Base, Log Cache Hit Ratio Base, Average Latch Wait Time Base, Cache Hit Ratio Base, CPU usage % base, and more
PERF_AVERAGE_BULK
The cntr_types column value for the PERF_AVERAGE_BULK counter type is 1073874176. The cntr_value column value is cumulative. To calculate the current value of the counter, you have to monitor the PERF_AVERAGE_BULK and its corresponding PERF_LARGE_RAW_BASE counter, take two samples of each at the same time, and use these values for the calculation
The formula for the current metric value is:
- (A2-A1)/(B2-B1)
- Where
- A1 and A2 are the values of the monitored PERF_AVERAGE_BULK counter taken at sample times T1 and T2
B1 and B2 are the values of the monitored PERF_LARGE_RAW_BASE counter taken at sample times T1 and T2
In this example, we’ll use Average Wait Time (ms) and Average Wait Time Base values. You can use any two counters one of the 1073939712 type and the other 1073874176, that have identical names except for the word base: Update conflict ratio base and Update conflict ratio, Avg. Time to Write Batch Base and Avg. Time to Write Batch (ms) , Avg. Time Between Batches Base and Avg. Time Between Batches (ms), etc.
|
1 2 3 4 5 6 |
SELECT * FROM sys.dm_os_performance_counters WHERE counter_name LIKE '%Average Wait Time%' AND instance_name = 'database' |
The values taken at T1

The values taken at T2
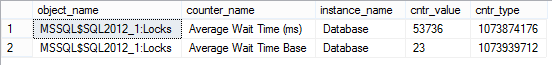
Average Wait Time (ms) for the interval between these two measurements is:
(53736 ms -52939 ms)/(23-18) = 797 ms / 5 = 159.4 ms
Counters of this type are: Average Wait Time (ms), Average Latch Wait Time (ms), Update conflict ratio, Avg. Length of Batched Writes, Avg. Time to Write Batch (ms), Avg. Time Between Batches (ms), and more
PERF_LARGE_RAW_FRACTION
The cntr_types column value for the PERF_LARGE_RAW_FRACTION counter type is 537003264. These counters show a ratio, i.e. fraction between two values – the PERF_LARGE_RAW_FRACTION counter and its corresponding PERF_LARGE_RAW_BASE counter value
Again, additional calculation is needed to find out the value that can be used for monitoring and troubleshooting performance issues. The ratio is presented in percents
|
1 2 3 4 5 |
SELECT * FROM sys.dm_os_performance_counters WHERE counter_name = 'Buffer cache hit ratio' |

Buffer Cache Hit Ratio shows how SQL Server utilizes buffer cache and it is the ratio of the data pages found and read from the SQL Server buffer cache and all data page requests. The recommended values are higher than 90%. The maximal possible value is 100% – when SQL Server reads all pages from the buffer cache and none from disk
Knowing the counter definition and possible values can help if you’re not sure what the counter type is, or to check whether the calculated value falls into a possible value range. For this example, the counter shows that Buffer Cache Hit Ratio is 2,135%, which is not possible
To calculate Buffer Cache Hit Ratio, we’ll use the counter value of the Buffer Cache Hit Ratio counter and the Buffer Cache Hit Ratio Base value show in in the example for the PERF_LARGE_RAW_BASE counter type above
- Buffer Cache Hit Ratio % = 100 * Buffer Manager\Buffer Cache Hit Ratio / Buffer Manager\Buffer Cache Hit Ratio Base
- = 100 * 2,135 / 3,573
- = 59.75%
The counters of this type are: Buffer Cache Hit Ratio, Log Cache Hit Ratio, Worktables From Cache Ratio, Cache Hit Ratio, CPU usage %, and Rem Req Cache Hit Ratio
PERF_COUNTER_BULK_COUNT
The cntr_types column value for the PERF_COUNTER_BULK_COUNT counter type is 272696576. The value these counters show is cumulative, it’s accumulated values since the last SQL Server instance restart, so to get their real value sampling is required, the same as for the PERF_AVERAGE_BULK counter type
However, here is important to know how long the sample period is. Otherwise, you would not be able to calculate the value per second. Usually a 5-minute period is used
To calculate per second rate, calculate the difference between two sample values and divide it by the number of seconds between the samples
The formula for the current metric value is
- A2-A1)/(T2-T1)
- Where
- A1 and A2 are the values of the monitored PERF_COUNTER_BULK_COUNT counter taken at sample times T1 and T2
- T1 and T2 are the times when the sample values are taken
There are several methods to do this. The first one uses the DELAY T-SQL statement, where the time between sampling is defined. In this example, it is 10 seconds
|
1 2 3 4 5 6 7 8 9 10 11 12 13 |
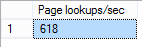
DECLARE @PageLookups1 BIGINT; SELECT @PageLookups1 = cntr_value FROM sys.dm_os_performance_counters WHERE counter_name = 'Page lookups/sec'; WAITFOR DELAY '00:00:10'; SELECT (cntr_value - @PageLookups1) / 10 AS 'Page lookups/sec' FROM sys.dm_os_performance_counters WHERE counter_name = 'Page lookups/sec'; |
Another method is to use get the ms_ticks value (number of milliseconds since the machine was started) from the sys.dm_os_sys_info Dynamic Management View at the same time when the counter values are taken
|
1 2 3 4 5 6 7 8 |
SELECT ms_ticks FROM sys.dm_os_sys_info; SELECT * FROM sys.dm_os_performance_counters WHERE counter_name = 'Page lookups/sec'; |
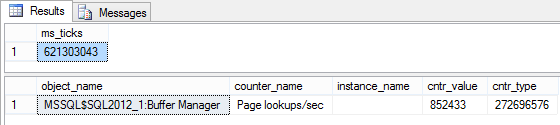
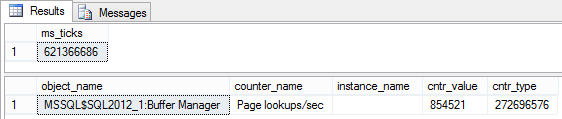
Based on the values obtained, the Page lookups/sec value is calculated as:
- Page lookups/sec = (854,521 – 852,433)/(621,366,686-621,303,043) = 2,088 / 63,643 ms
- = 2,088/63 sec = 32.1 /sec
The Getdate () statement and any other method for determining time difference can be used
The counters are: Page lookups/sec, Free list stalls/sec, Lazy writes/sec, Page reads/sec, Page writes/sec, Logins/sec, and more
The view is easy to use with almost none coding knowledge. It’s available in all SQL Server editions and gives the results instantly. With additional coding, you can periodically query the view and store captured data in repository table(s). You can use this info later for various analyses and creating a custom monitoring solution. Keep in mind that the time needed for creating a custom monitoring solution may be more expensive than a third party tool
Ty to be able to use the view for SQL Server performance monitoring and troubleshooting, it is necessary to understand the existing counter types, what each type represents, and how to calculate the current value. Otherwise, the counter values returned can be misleading and useless. As shown in this article, there are five different counter types, some of which require sampling and calculation. Other disadvantages of using this view for performance monitoring are that no graphical presentation of the performance parameters and continuous monitoring solutions are available out-of-the-box

She has been working with SQL Server since 2005 and has experience with SQL 2000 through SQL 2014.
Her favorite SQL Server topics are SQL Server disaster recovery, auditing, and performance monitoring.
View all posts by Milena "Millie" Petrovic
- Using custom reports to improve performance reporting in SQL Server 2014 – running and modifying the reports - September 12, 2014
- Using custom reports to improve performance reporting in SQL Server 2014 – the basics - September 8, 2014
- Performance Dashboard Reports in SQL Server 2014 - July 29, 2014