
The Problem
Checking the many SQL Servers health conditions is one of the DBA basic tasks. Monitoring many servers and databases, day after day can be a very tedious job. There are many aspects to look for when checking the server performance figures. Such aspects include among others: CPU, Read and Write Disk counters, Various memory counters and locks performance counters. The DBA needs a tool that checks the most important counters and output a report that states whether the server is considered to be healthy or not. For every aspect, a counter is chosen to represent it to be included in the overall report.
I have chosen here Buffer cache hit ratio counter for memory category, % user time for CPU category, Avg. Disk Sec/Read and Avg. Disk Sec/Write for the Disk category and Avg. Wait Time (ms) for the Locks category. There are many other, good and helpful categories that can be used but I have selected these after referencing many documentation sources.
The suggested solution
The suggested solution for checking the server’s health conditions is to construct a Multi Statement table valued function that will show, in one glance, a comprehensive “Look over” on the most important counters values on the server and show the Resulting result set to the DBA. Each counter is analyzed inside the function according to books, online documentation, best knowledge, and given a good or bad status. If all aspects are ‘Good’ the server status is ‘Healthy’, else then a ‘Sick’ status is given.
Here is my suggestion for list of the most important counters
The counters table consists of category, counter name, description, and good values
Range, bad value ranges
| Category | Counter Name | Description | Good range values | Bad range values |
| Memory/Buffer Manager | Buffer cache hit ratio |
The buffer cache hit ratio counter represents an indication of the percentage of data pages that exists in SQL Server’s memory and without forcing the Server to get them from the disk. The closer this number is to 100 percent, the better. The common threshold considered for this counter is around 90%. A lower hit ratio value than 90% indicates clearly a memory problem and is a clear indication that memory should be extended/added to the SQL Server RAM. | >= 90% | < 90% |
CPU/ Processor | % user time | The % user time counter in the CPU / Processor category stands for the percentage of the processor non-idle time spent on executing the SQL user processes The recommendation value for THE Processor: % user time is below 70% There are some SQL experts state that 80% should be the threshold for CPU problems instead if 70 %. This counter is also called CPU Usage % in some SQL versions | =< 70% | > 70% |
Disk | Avg. Disk Sec/Read | The Avg. Disk Sec/ Read counter stands for the measure of disk latency representing the average time, in milliseconds. For each read to disk where > 20 is considered being poor, <20 is considered being good/fair, <12 is considered to be better and <8 is considered the best | =< 20MS | > 20MS |
Disk | Avg. Disk Sec/Write | The Avg. Disk Sec/Write counter stands for a measure of disk latency representing the average time, in milliseconds, for each write to disk, where non-cached writes > 20 is considered being poor, <20 is considered being fair, <12 is considered better, <8 is considered the best level This counter differs significantly from the cached writes counter where > 4 is considered poor, <4 is considered fair, <2 better, <1 is the considered the best. For OLTP databases, the lower this number the better, especially for disks holding the Transaction log. | =< 20MS | > 20MS |
Locks | Avg Wait Time (in ms) | The average wait time, in milliseconds, for each lock request that had to wait. An average wait time longer than 500ms may indicate excessive blocking. This value should generally correlate to the ‘Lock Waits/sec’ counter | =< 500MS | > 500MS |
Here is the user defined multi-statement table valued function T-SQL code:
|
1 2 3 4 5 6 7 8 9 10 11 12 13 14 15 16 17 18 19 20 21 22 23 24 25 26 27 28 29 30 31 32 33 34 35 36 37 38 39 40 41 42 43 44 45 46 47 48 49 50 51 52 53 54 55 56 57 58 59 |
Create FUNCTION getSQLServerHealthState () RETURNS @SQLServerHealthState table ( counter_name Varchar(100), counter_value decimal (7,2), verdict varchar(10) ) AS BEGIN /* Memory cache hit ratio counter */ INSERT INTO @SQLServerHealthState select counter_name , avg(cntr_value),iif (avg(cntr_value) >= 90 ,'good', 'bad') as verdict from sys.dm_os_performance_counters where counter_name = 'Buffer cache hit ratio' group by counter_name /* CPU usage counter */ INSERT INTO @SQLServerHealthState select counter_name , avg(cntr_value), iif (avg(cntr_value) <= 70 , 'good', 'bad') as verdict from sys.dm_os_performance_counters where counter_name = 'CPU Usage %' group by counter_name /* Locks counter */ INSERT INTO @SQLServerHealthState select counter_name,avg(cntr_value) , iif (avg(cntr_value) <= 500 , 'good' , 'bad') as verdict from sys.dm_os_performance_counters where counter_name = 'Lock Wait Time (ms)' group by counter_name /* Disk Read */ INSERT INTO @SQLServerHealthState select counter_name , avg(cntr_value),iif (avg(cntr_value) <= 20 , 'good' , 'bad') as verdict from sys.dm_os_performance_counters where counter_name = 'Disk Read IO/sec' group by counter_name /* Disk write */ INSERT INTO @SQLServerHealthState select counter_name , avg(cntr_value),iif (avg(cntr_value) <= 20 , 'good' , 'bad') as verdict from sys.dm_os_performance_counters where counter_name = 'Disk Write IO/sec' group by counter_name insert into @SQLServerHealthState select 'SERVER STATE', NULL , (SELECT IIF (COUNT(*) = 5 ,'Healty' , 'Sick') from @SQLServerHealthState where verdict = 'good') RETURN END GO |
Note: create and compile the function in the master database
Explanation for the code:
I called my multi statement, table valued function getSQLServerHealthState, it gets no parameters and outputs, as the result set a table with the selected five counters, their values and the verdict: good or bad value.
The functions query the sys.dm_os_performance_counters dynamic view. It assumes that there exists more than one counter with the same name corresponding to various SQL instances.
Because there can be several values for each counter, a AVG group function is used in order to get the mean value for each counter for all of the servers activity on each counter.
An IIF function gets the verdict by operating directly on the result value of the AVG function.
For each counter, the rule from documentation is applied.
At the end, a summary line is added. If all rows are set to ‘good’ then healthy status is given, else a Sick status is given
The function was successfully tested on my server which is SQL Server 2014 express edition.
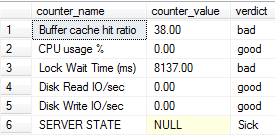
Here is an example for the function’s execution done on my server:
|
1 2 3 4 5 |
Use master Go SELECT * from dbo.getSQLServerHealthState() |
A code improvement suggestion for the function:
A suggested improvement for the code will be to put all the threshold values in a Dedicated table and access it with a scalar function. Then use this function inside the Multi-statement table function.
Thus, changing the threshold values will not force code changes inside the function Definition.
Code improvement steps:
Create the threshold table in master database:
CREATE TABLE dbo.thresholds ( counter_key VARCHAR(32) ,threshold_value INT ) GO INSERT INTO dbo.thresholds ( counter_key ,threshold_value ) VALUES ( ‘Buffer cache hit ratio’ ,90 ) ,( ‘CPU Usage %’ ,70 ) ,( ‘Lock Wait Time (ms)’ ,500 ) ,( ‘Disk Read IO/sec’ ,20 ) ,( ‘Disk Write IO/sec’ ,20 ) GO
The next step is to Create a scalar function called GetThresholdValue in order to access the threshold values from the table, since it is an inner use scalar function, no errors are assumed, so not error handling is coded in the function’s definition.
123456789101112131415161718CREATE FUNCTION GetThresholdValue (@key VARCHAR(32))RETURNS INTASBEGIN-- Declare the return variableDECLARE @Result INT-- T-SQL statements to compute the return value hereSELECT @Result = threshold_valueFROM dbo.thresholdsWHERE counter_key = @key-- Return the result of the functionRETURN @ResultENDGO- Finally, modify the getSQLServerHealthState function so that it will use the inner scalar function instead of “hard coding” the threshold values.
Here is the modified and improved T-SQL code for the function:
|
1 2 3 4 5 6 7 8 9 10 11 12 13 14 15 16 17 18 19 20 21 22 23 24 25 26 27 28 29 30 31 32 33 34 35 36 37 38 39 40 41 42 43 44 45 46 47 48 49 50 51 52 53 54 55 56 57 58 59 |
alter FUNCTION [dbo].[getSQLServerHealthState] () RETURNS @SQLServerHealthState table (counter_name Varchar(100), counter_value decimal (7,2), verdict varchar(10)) AS BEGIN /* Memory cache hit ratio counter */ INSERT INTO @SQLServerHealthState select counter_name , avg(cntr_value) , iif (avg(cntr_value) >= dbo.GetThresholdValue ( 'Buffer cache hit ratio'), 'good' , 'bad') as verdict from sys.dm_os_performance_counters where counter_name = 'Buffer cache hit ratio' group by counter_name /* CPU usage counter */ INSERT INTO @SQLServerHealthState select counter_name , avg(cntr_value) , iif (avg(cntr_value) <= dbo.GetThresholdValue ( 'CPU Usage %') , 'good' , 'bad') as verdict from sys.dm_os_performance_counters where counter_name = 'CPU Usage %' group by counter_name /* Locks counter */ INSERT INTO @SQLServerHealthState select counter_name , avg(cntr_value) , iif (avg(cntr_value) <= dbo.GetThresholdValue ( 'Lock Wait Time (ms)') , 'good' , 'bad') as verdict from sys.dm_os_performance_counters where counter_name = 'Lock Wait Time (ms)' group by counter_name /* Disk Read */ INSERT INTO @SQLServerHealthState select counter_name , avg(cntr_value) , iif (avg(cntr_value) <= dbo.GetThresholdValue ( 'Disk Read IO/sec' ) , 'good' , 'bad') as verdict from sys.dm_os_performance_counters where counter_name = 'Disk Read IO/sec' group by counter_name /* Disk write */ INSERT INTO @SQLServerHealthState select counter_name , avg(cntr_value) , iif (avg(cntr_value) <= dbo.GetThresholdValue ( 'Disk Write IO/sec') , 'good' , 'bad') as verdict from sys.dm_os_performance_counters where counter_name = 'Disk Write IO/sec' group by counter_name insert into @SQLServerHealthState select 'SERVER STATE', NULL , (SELECT IIF (COUNT(*) = 5 ,'Healty' , 'Sick') from @SQLServerHealthState where verdict = 'good') RETURN END GO |

View all posts by Eli Leiba
- Creating a stored procedure to fix orphaned database users - January 25, 2016
- Creating a gap in sequences – TSQL Stored Procedure advisor - January 6, 2016
- Construct a special multi-statement table function for checking SQL Server’s health - December 24, 2015