
Introduction
In this new chapter, we will show how to use the Microsoft Portal to monitor the Virtual Machines with SQL Server Installed. We will show how to do it with the current Portal and the New Microsoft Azure Portal. We will check how to monitor performance, watch the logs, review the settings and change them.
Requirements
I am assuming that you already have a VM with SQL Server in Azure installed.
- An Azure subscription.
- A VM Machine in Azure with SQL Server already installed (check my article about Azure VMs).
Getting started
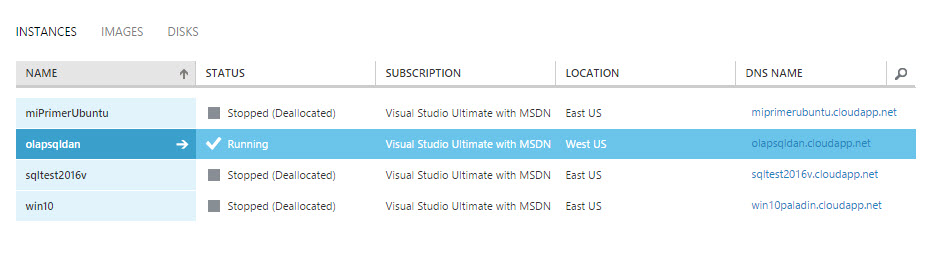
In the Microsoft Portal, go to the Virtual Machine section and click on the VM with SQL Server installed.

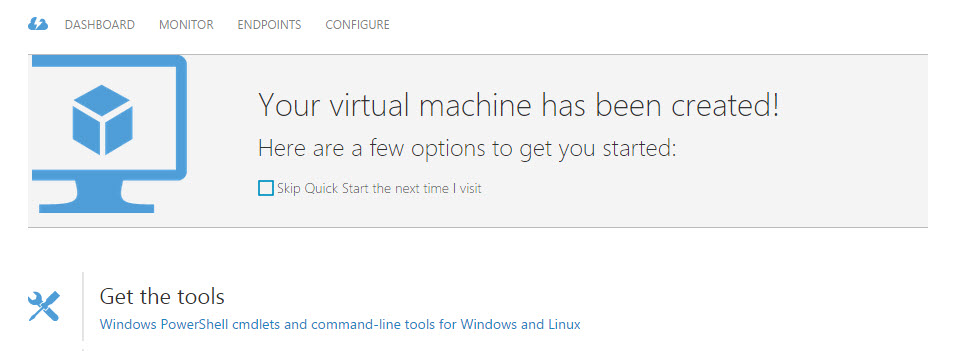
Figure 1. The VMs in the Azure Portal You have the options to install Windows PowerShell for Windows and Linux. For more information about PowerShell in Azure, you can read our Article about PowerShell in Azure
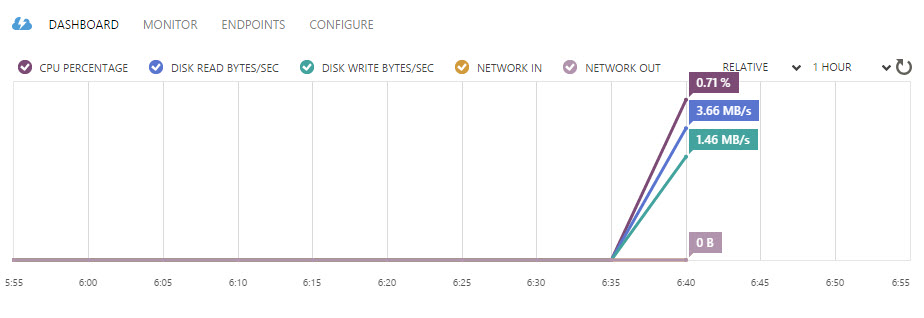
Figure 2. The initial page in the portal of the VMs The Monitor section allows you to monitor:
- The CPU Percentage which shows the CPU utilization per percentage. The use is usally intensive, but if the value if too high (more than 80% very frequently), it means that a machine with more CPUs is required or maybe a Load Balancing is required
- The Disk read/write bytes/second helps us to measure the disk activity related. If there is too much disk activity, it is recommended to distribute the information in other disks. Usually, the number of disks in Azure is high. In SQL Server, you can distribute your Data files in different disks to improve performance. This value is in MB per second
- The Network IN and OUT shows the Network input and output in Bytes
You can see the maximum value, the minimum value and the average value of these metrics
Figure 3. The VMs performance
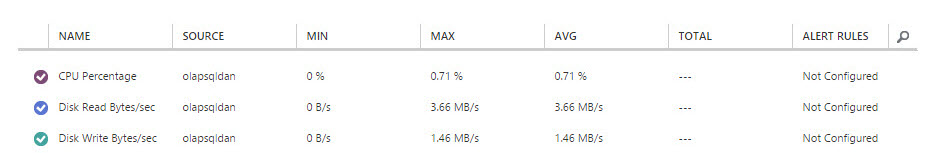
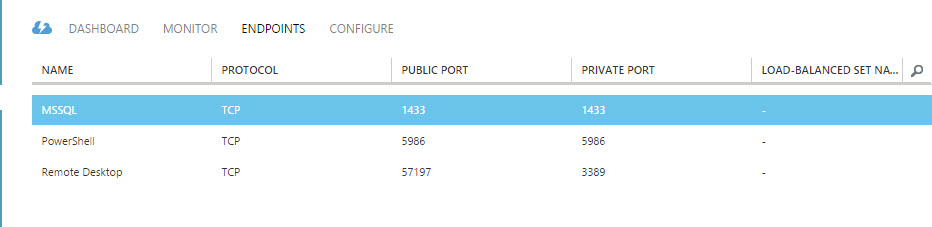
Figure 4. The Azure VM max, min and average performance In the ENDPOINTS section, you can find the Endpoints, the ports used, the public and private ports. The Endpoints allow us to communicate with other Machines outside the Cloud. For that you enable the ports specifying the public and private ports
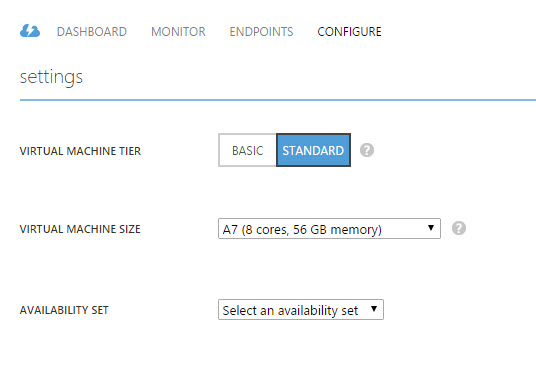
Figure 5. The Endpoint’s information The Configure section is very important to define the Tier. The basic Tier includes Memory from 768 MB to 14 GB and the Standard Tier from 768MB to 112 GB. The Virtual Machine Size is closely related to the Tier. For more information about review the link Tier and virtual machine size. The availability Set is to configure high availability using groups of virtual machines. That way, the chances to have all the machines down is very low. You need 2 or more virtual machines in a group named availability set for this feature. If one of the VMs is down, the others will replace the one failing. For more information about availability set, please check this link
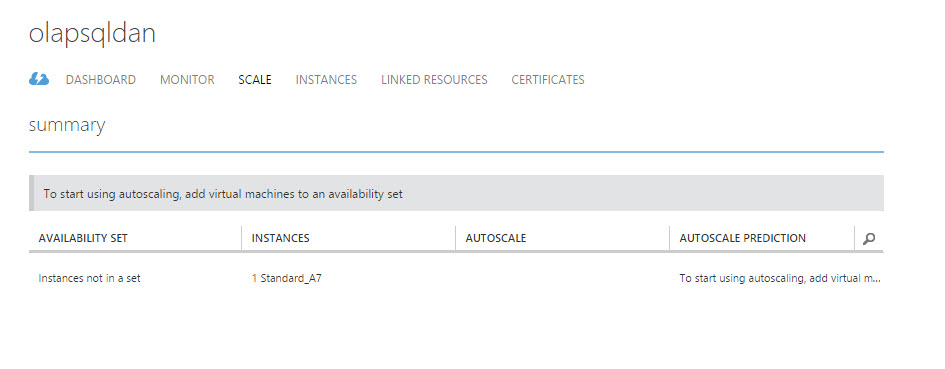
Figure 6. The setting of the Azure VMs The scale section is used to configure the instances in the availability set. For example, if the CPU used is too high, we can use more instances to attend the users demand. With the SCALE section, we can see the instances used and the autoscale options. In Azure, there are 2 main ways to SCALE:
- One if the CPU is too high.
- The number of messages in the Queue.
You can specify parameters to scale your VMs
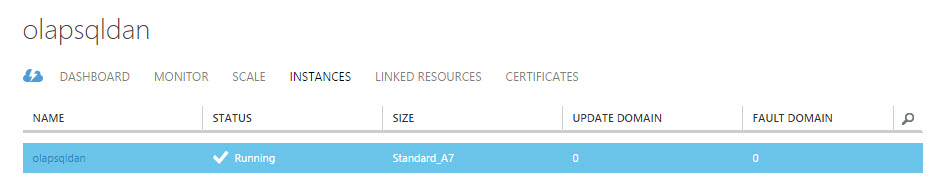
Figure 7. The instances used to autoscale In the instances section, you can see the name, the status of the machine the size. In the instances section, you can see the name, the status of the machine the size.
In an availability set, you can have several machines running and you can verify here which ones are up and which ones down
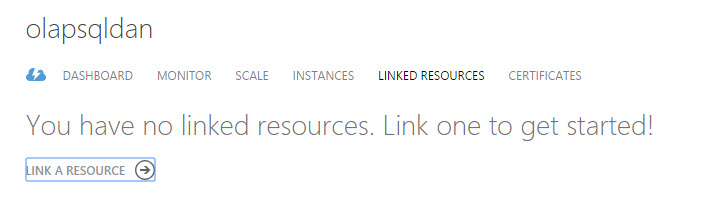
Figure 8. The instances used The linked resources allow you to link resources such as a SQL Database with a service. When you link a resource, it is easier to monitor the service and the resource together
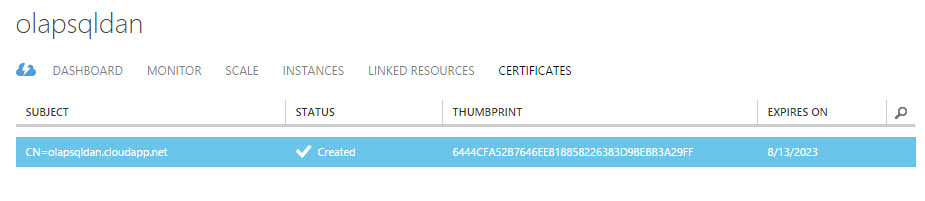
Figure 9. Linked resources in Azure The certificates shows the certificate used in the Virtual Machine, the status, subject used, expiration date. The certificate allows to have a secure connection to the VM machine. The expiration date is very important to verify if the certification is out-of-date
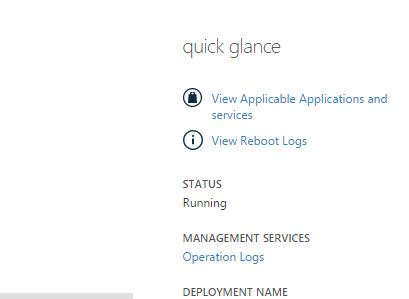
Figure 10. The azure certificates used. In the dashboard section you can see the Applications and services that can be used according to your subscription options, Reboot logs and Operations logs
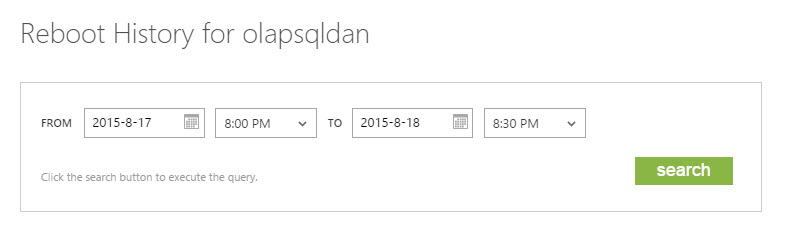
Figure 11. Some dashboard options You can for example, filter by date and time when the VM reboot. You can use ranges of dates and times to filter the information. The search option allows to search the entries of the criteria specified
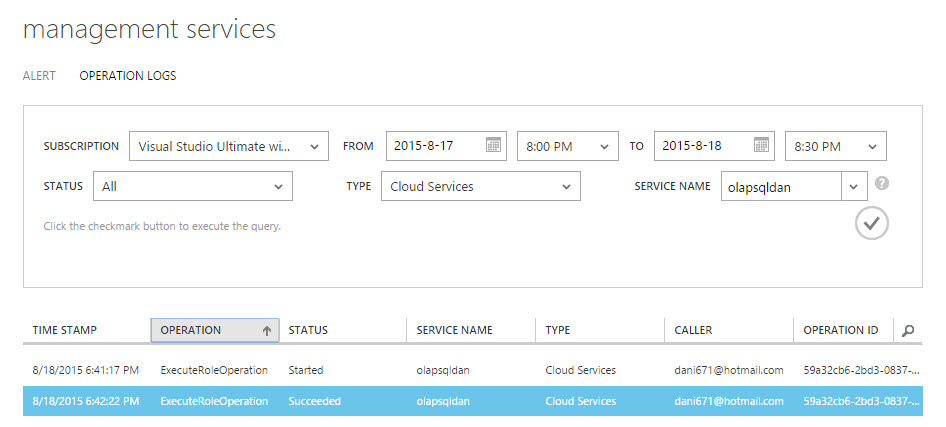
Figure 12. The reboot history of the Azure VMs The operation logs allows you to see the operations done on the Virtual Machine. You can filter the information by subscription, date, time, status, type and service name.
For example, you can check when the service started including the date and time, who did the operation. The log also includes an ID to identify the operation done. You also have the status of the service with the operation done
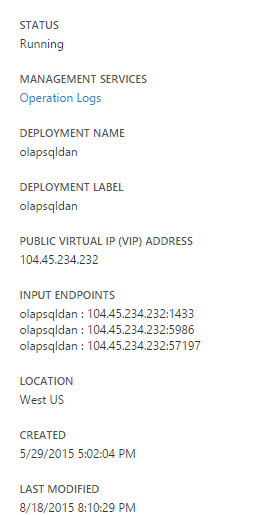
Figure 13. The operation log of the Azure VMs Besides the Logs, you can see the status, the Virtual IP Address, the endpoints used, the location of the VM, The date it was created and the last modification date. The input EndPoints use the IP address followed by the Port. You can install your Azure machine in several locations like USA, Brazil and Japan
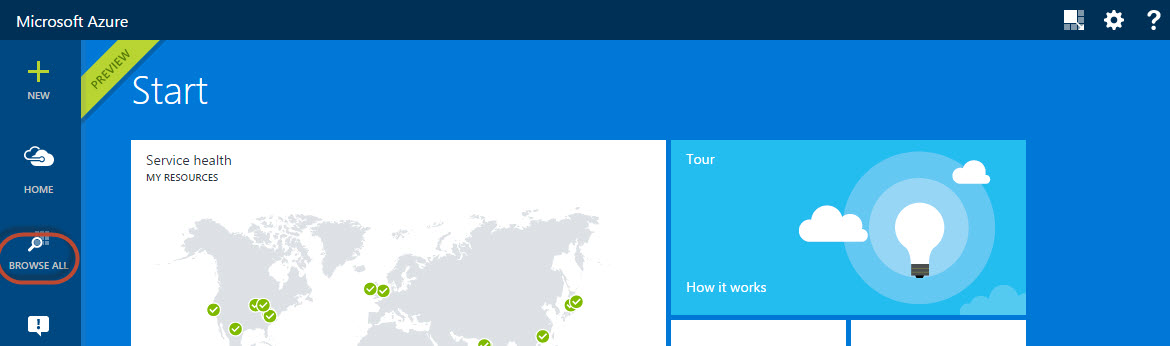
Figure 14. The VM information The current portal is easy to use, but now there is a new console called the Preview Portal which will be the new Portal in the Future. You can access to the preview portal with this link
If you click on the BROWSE ALL, you will be able to see all the resources
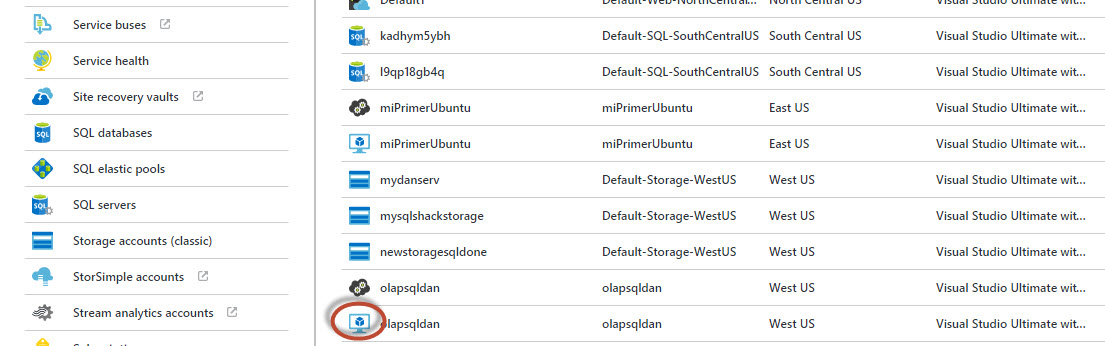
Figure 15. The new Azure Portal Let’s click in one of the virtual machines
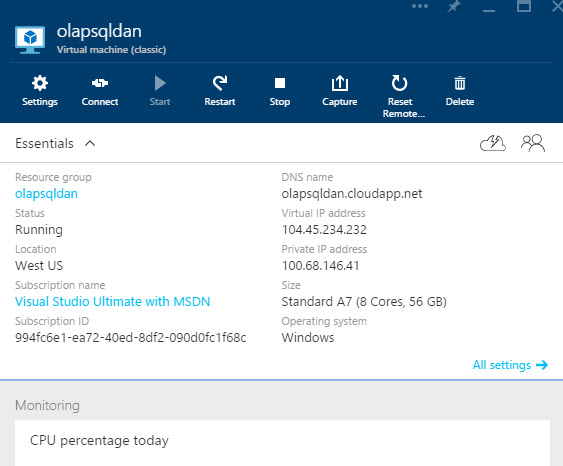
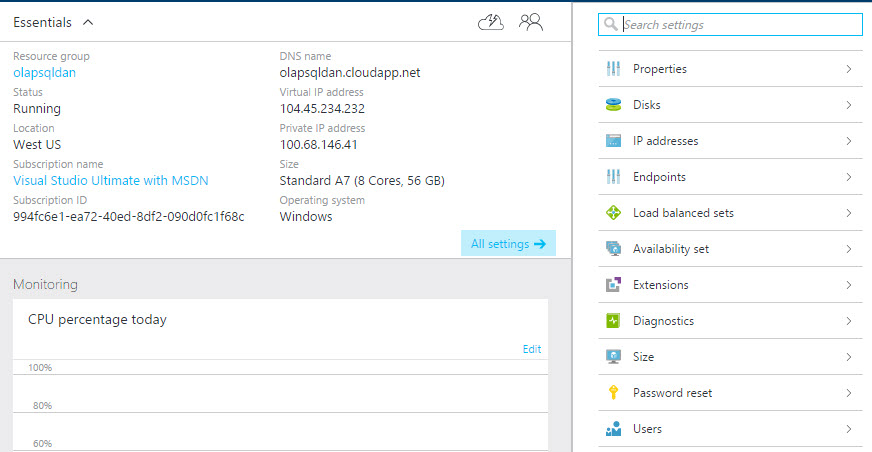
Figure 16. A view of all the resources in the Azure Preview Portal The interface allows configuring settings, to connect to the Virtual Machine, to restart the VM, delete the machine, reset and capture the VM image in order to create new VMs based on that image. You can also reset the remote access. You can also see the subscription information, the status of the VM, the IPs used (private and virtual). You can see the size and subscription ID. The operative system and the size of the VM (explained in step 5) are also displayed
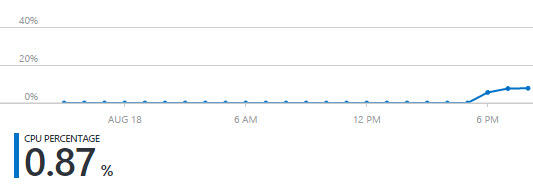
Figure 17. The options available in the new Azure Portal You can also check the Performance of the VM like the CPU % explained in detail in the step 3 of this article
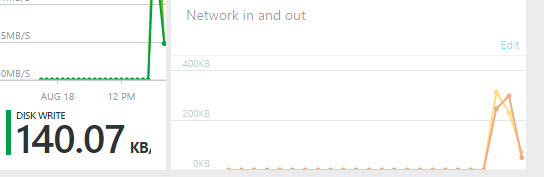
Figure 18. The CPU Percentage of the machines You can also see the disk writes and the network input and output. For more information about these counters, check the step 3
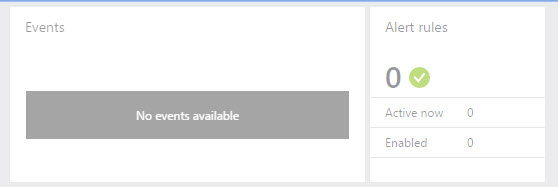
Figure 19. The disk and network performance It is also possible to see the system events and Alert rules of the VM in Azure. In the new Portal it is possible to configure alerts if the Counters exceed a specified threshold. For example, you can configure the CPU % to send an alert if it exceeds 80%. The Alerts and event will be displayed here. You will be able to see also if the alert rules are active, the number of alerts and if they are enabled
Figure 20. The events and alerts If you press the all settings option, you will be able to see the Properties, Disks, IP addresses, Endpoints and other options available. As you can see the information is more complete now. You can easily check Properties, disks, Endpoints, Load balanced configurations, Extensions used by the Azure, Diagnostics and the size of the VM. You also have the option to reset the password or create new users
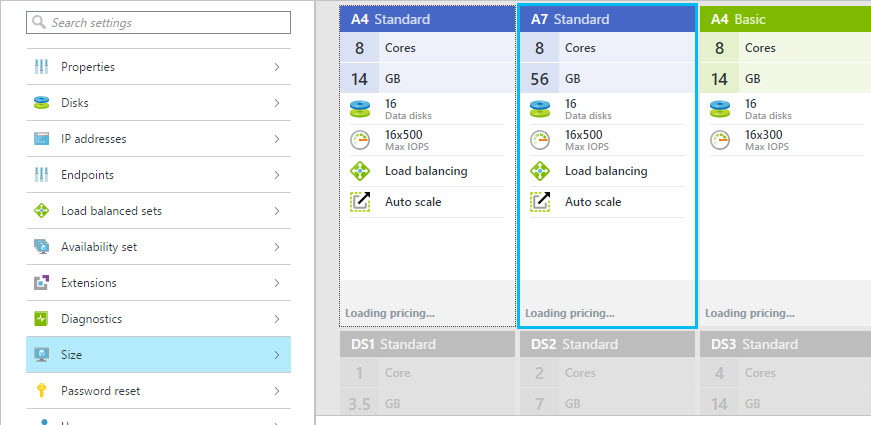
Figure 21. The Settings available For example, the size shows the number of disks, the memory in GB, the number of cores and disks per Size of VM and prices. You can see the characteristics of the A4, A7 Standard and the A4 Basic
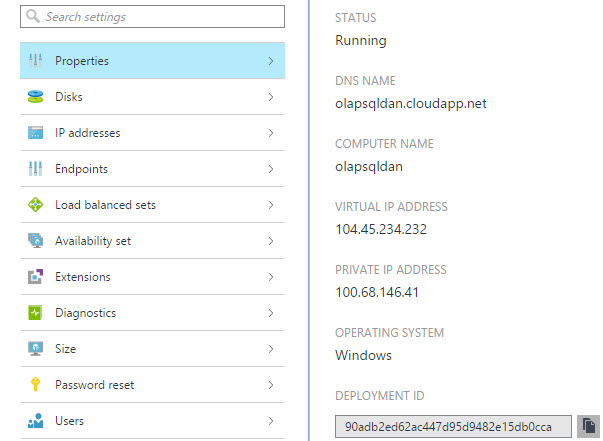
Figure 22. The different options and sizes of the VMs in Azure The Properties shows the status of the VM, DNS and computer name, IP, operative system. You have access to the virtual and the private IP address
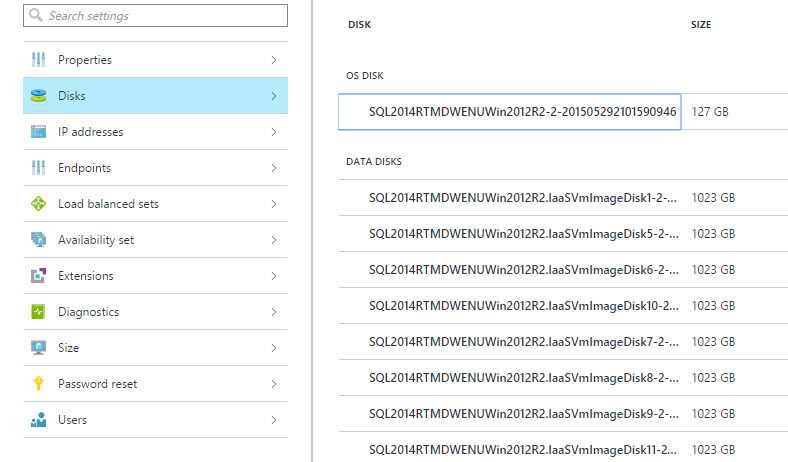
Figure 23. The properties of the VM It is also possible to see the disk information and the size of the disks. In this sample, the virtual machine has 16 disks
Figure 24. The disk information of the VMs
Conclusion
In this chapter, we taught how to see the logs in Azure, how to get the properties, check the resources, how to monitor the performance of the machines using the current Microsoft Azure Portal and using the Preview Portal which be used in the future. We noted that the new portal has a more intuitive access to options and it is easier to use and access.

He has worked for the government, oil companies, web sites, magazines and universities around the world. Daniel also regularly speaks at SQL Servers conferences and blogs. He writes SQL Server training materials for certification exams.
He also helps with translating SQLShack articles to Spanish
View all posts by Daniel Calbimonte
- PostgreSQL tutorial to create a user - November 12, 2023
- PostgreSQL Tutorial for beginners - April 6, 2023
- PSQL stored procedures overview and examples - February 14, 2023