
Background
When we’re architecting or troubleshooting issues in an environment, understanding how the log is set up and its history helps us identify if improving it will carry significant impacts overall. We have some built in tools that we can use, such as DBCC LOGINFO and DBCC SQLPERF and in this tip we look at how we can use them when we’re debugging issues, designing our logs for scale, or monitoring our current setup. We also look at some ways we can retain the information these provide so that we can use this for historic measurements and benchmarking, as well as using them for potentially alerting.
Discussion
DBCC LOGINFO
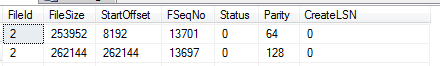
When looking at DBCC LOGINFO to get an overview of the log structure, let’s look at a couple of key items:
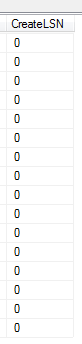
The amount of the result, which is the VLF count.
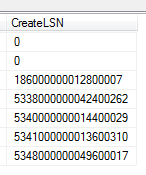
The CreateLSN from an architecture point helps me quickly identify when a log has been inappropriately designed relative to the database need, as these values may be in small chunks relative to the size, or they may be individual – meaning that VLFs were created in small amounts as the database grew. For instance, assuming that both of the below databases were expecting large growth over the next year, I know the second image was well planned for this, while the first was not because large growth will often come in large batches and a log must either grow to handle these volumes or be pre-scaled:

Log one
Log two Multiple log files don’t assist, though I’ve seen this from time to time for the intent of scaling. Log operations occur sequentially, so adding more log files doesn’t help scale transactions. If we need to re-architect a log design, such as create a new log file and empty the old file for moving the file itself, be careful about naming convention; some tools are built to automatically use a standard naming convention and this might disrupt them.
For VLF monitoring, we can execute the below code to save the count
DBCC SQLPERF(LOGSPACE)
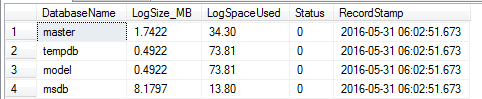
We can monitor log growth and use in many ways; one simple and effective way is to use the SQLPERF command that Microsoft provides. In the below code, I create a table that saves this information and insert the values into the table from the most recent DBCC SQLPERF:
|
1 2 3 4 5 6 7 8 9 10 11 12 13 14 15 16 17 18 |
CREATE TABLE tblLogMon( DatabaseName VARCHAR(250), LogSize_MB DECIMAL(22,4), LogSpaceUsed DECIMAL(5,2), Status TINYINT, ---- Added column to track time RecordStamp DATETIME DEFAULT GETDATE() ) INSERT INTO tblLogMon (DatabaseName,LogSize_MB,LogSpaceUsed,Status) EXEC ('DBCC SQLPERF(LOGSPACE)') SELECT * FROM tblLogMon |
The added RecordStamp column makes it useful to track the time, as this can be useful to highlight when a log fills as evidence that the drive may need to be grown (see later in this tip). For an example, suppose that I wanted to track the growth of a log for a database CryptoCurrencyMeasure where the log used was greater than my concern threshold of 75%, I could query the table:
|
1 2 3 4 5 6 7 8 |
SELECT * FROM tblLogMon WHERE DatabaseName = 'CrytoCurrencyMeasure' ---- If my threshold concern is 75.00 AND LogSpaceUsed > 75.00 ORDER BY RecordStamp DESC |
This example is one way to make a stronger case if the design does not match the log needs. In addition, this can help show why a separate drive for the log is needed if we see significant movements in each measuring time period, even after a transaction log backup. The actual insert statement from SQLPERF should be at a measuring window that matches your environment, such as every fifteen minutes to an hour.
Some Useful Tips and Questions
From the start, does your log reflect what you expect your database to look like one year from now? I’ve listened to many individuals explain that “while we knew the database would grow, we didn’t expect large transactions, so log growth wasn’t expected” even though a larger data set may have larger transactions because a transaction runs against larger data sets. For a simple example of this, consider that a delete transaction against a portion of a table won’t have as much of an effect on a smaller table, while possibly having a large effect on a larger table (relative to the filter).
Does your log have its own drive? The most obvious benefit of this is a reduction in contention. It also gives us the ability to track and measure the performance of the one drive without interpreting the data we have that’s mixed with other possibilities, like transactions in tempdb.
Have you benchmarked the performance of the log drive relative to the environment? This question is especially important in high volume, OLTP environments. If we expect our logs to receive a high volume of transactions, we’ll want to make sure that the hardware to support them is optimized to handle the load.
What type of write transactions do you tend to receive in your environment and are these the most efficient way of how they’re run? For an example, do your developers tend to remove all records from a table using a delete over truncate because they don’t know that a truncate is available to them, or because they are removing a subset of the full data set each time? Do on-the-fly changes to tables that involve heavy write operations, such as setting a default to column when millions/billions/trillions records already exist, occur (in this case, it may not feel like a heavy write operation to the developer, but it can be)?
One key point for large environment is that it’s often difficult to obtain more space or more resources even if those items will reduce problems – and this isn’t only limited to log space or log drives. DBAs and developers might be frustrated that their requests have been pushed back and I’ve witnessed situations where it was “expected” that the DBAs and developers would wake up overnight and fix the problem, along with other problems. In these situations, I highly recommend keeping a history of the following:
What log changes need to be made to the environment with problems.
Why you think these changes need to be made – and show historic information when stating the why as it strengthens your case. In the above code, I show one way of tracking information so that you can provide your case for why the log files may need to be grown. This doesn’t only include metrics, but a history of the problems you and others have solved related to the issue and the times (like overnight, etc).
The consequences of not making the changes.
Who you sent the documentation to will help you track who received the information in case of mix-ups, or people moving from their department or environment.
Final Thoughts
These commands help us monitor and track information related to our logs, especially how they’re being used, growing, their size, etc. Depending on what we find, we may want to pre-scale more growth, teach our developers to batch more frequently, expand or build a drive solely for the log, change the drive for the log to handle the volume, or other techniques that will improve our environment’s performance. With a history of this information, we can make a stronger case to our environment, especially when working with other teams.

He has spent a decade working in FinTech, along with a few years in BioTech and Energy Tech.He hosts the West Texas SQL Server Users' Group, as well as teaches courses and writes articles on SQL Server, ETL, and PowerShell.
In his free time, he is a contributor to the decentralized financial industry.
View all posts by Timothy Smith
- Data Masking or Altering Behavioral Information - June 26, 2020
- Security Testing with extreme data volume ranges - June 19, 2020
- SQL Server performance tuning – RESOURCE_SEMAPHORE waits - June 16, 2020