

SQL Server 2017 and SQL Server 2019 supports both the Linux operating system. As part of performance troubleshooting or monitoring resources in Windows system, we need to check certain things like disk space, CPU or Memory consumption, check running processes, uptime etc. We can get the information, on a windows based SQL server, from the task manager.
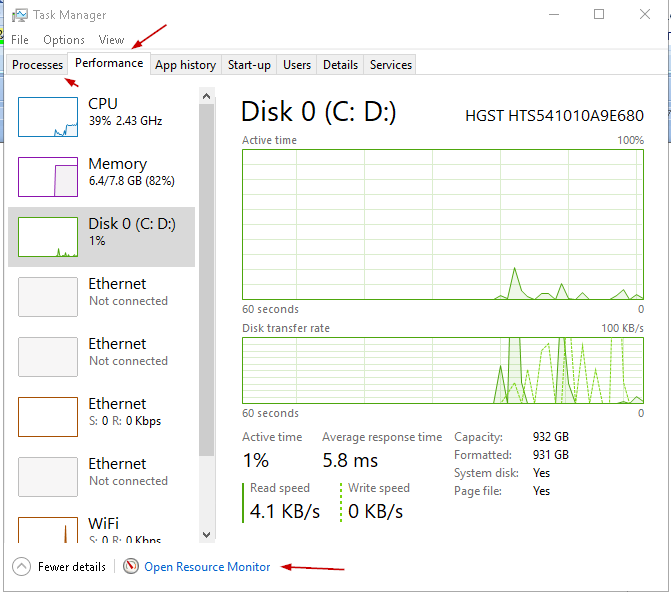
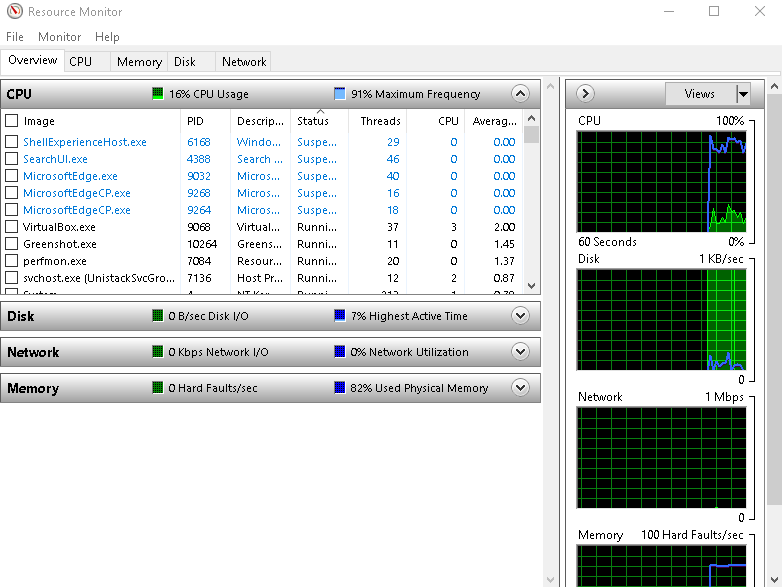
We can get more detail in the window system using the ‘Resource Monitor’ as shown here:
Now, since SQL Server runs on Linux as well, we must know the respective commands on this OS and interpret the data to get useful information. In Linux, we need to use command line tools to get the data. We need to read the data from the command output. It is different from the windows environment where we used to do most of the work in GUI mode.
In this article, we will explore ‘top’ command in Linux.
‘top’ command in Linux
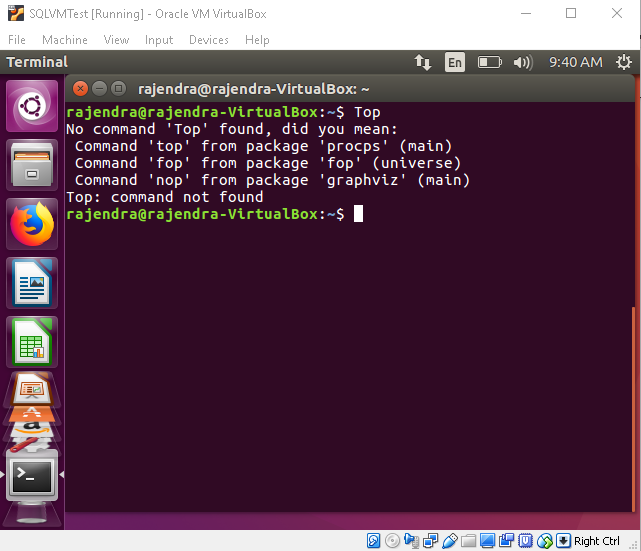
We get the information about the CPU and memory utilization by the ‘top’ command in Linux. It is case sensitive command so we need to use the command ‘top’ instead of ‘Top’.
If we run the command ‘Top’ we get the error message ‘Top: command not found’
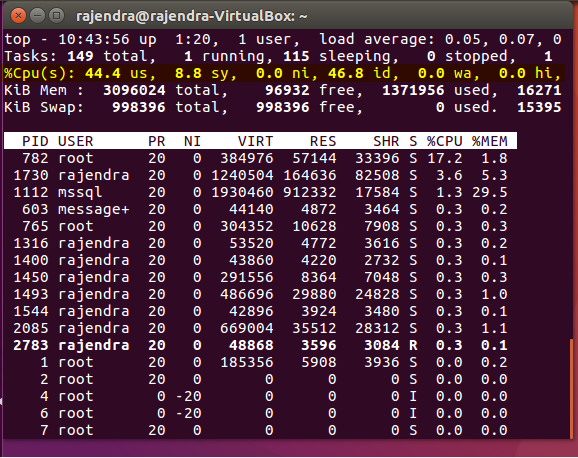
Run the command ‘top’ in the terminal and you get the output as per the screenshot:
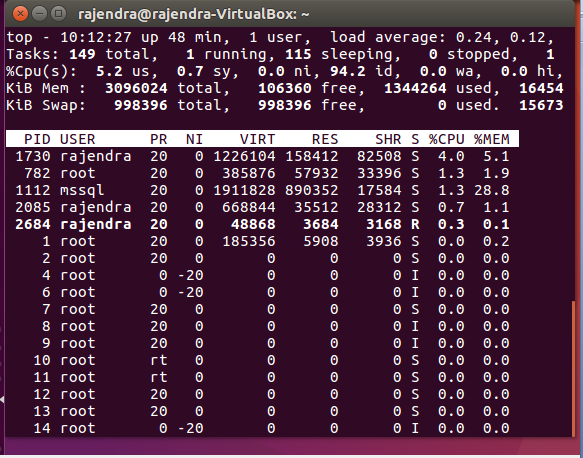
We need to understand this output in order to get useful information.
- Summary Section: In this section, we get an overview of the uptime, CPU, Memory, swap file etc
- Detail Section: in this section, we get detail information about each process, tasks running
You can view both the sections in the below image
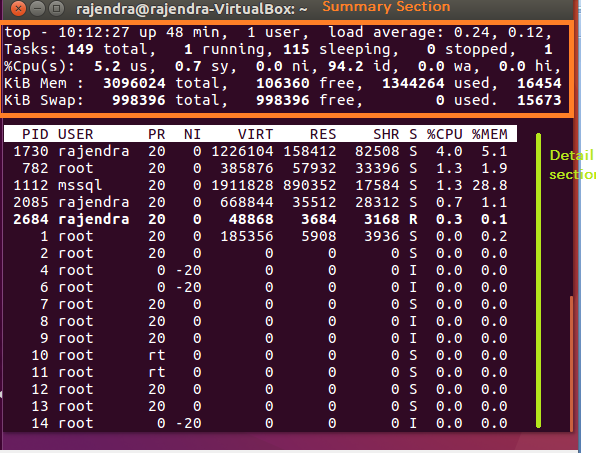
We will understand the result on a row basis. Overall output can be divided into two sections.
First Row summary
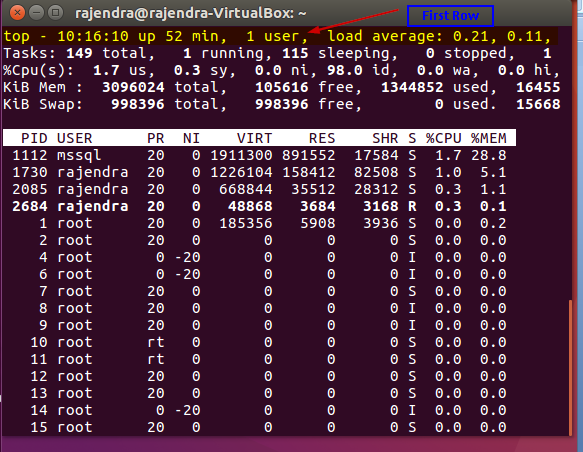
In the first row, we get the below information:
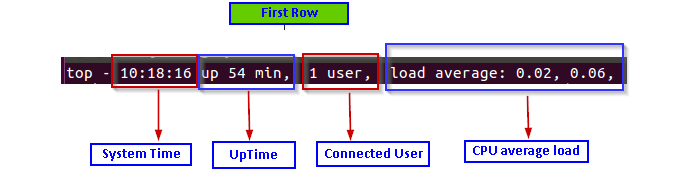
- Current system time (10:18:16)
- Uptime of the system (up 54 min)
- Count of logged in users (1 user)
- Average CPU load (load average: 0.02, 0.06) – 0.02 in last minute and 0.06 in last five minutes
Second Row summary
In the second row, we get information about the number of process running along with their current state
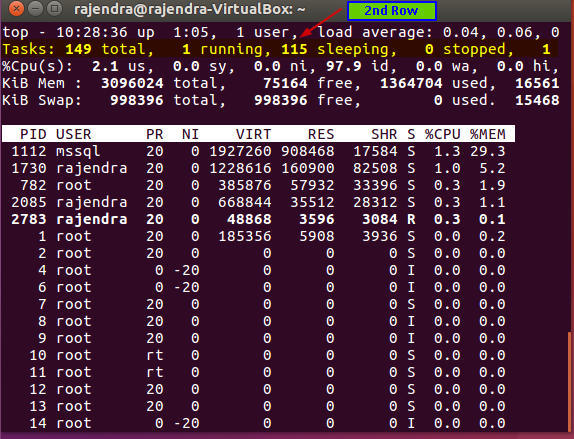
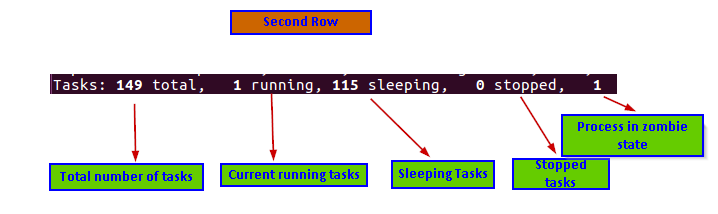
The second row gives below information:
- Total number of tasks
- A number of currently running tasks
- A total number of tasks in a sleeping state
- Total number of stopped tasks
- A total number of processes in a zombie state
Note: A “Zombie” state means that process has completed execution but it still exists in the process table. We might understand this as a child-parent process. The child process is completed and waiting for the parent task to process it. This child process will be in a zombie state.
Third Row summary
In the third row, we get information about the CPU utilization on the server.
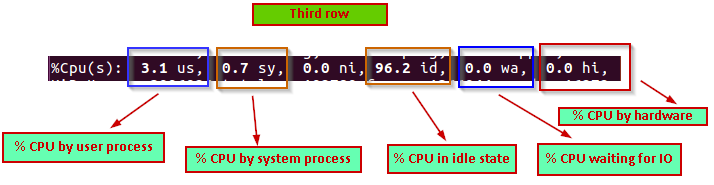
In the third row, we can see the following information:
- 3.1 us % CPU used by the user processes
- 0.7 sy % CPU used by the system processes
- 96.2 id % CPU by in idle state
- 0.0 wa % CPU waiting for IO
- 0.0 hi % CPU time by hardware interrupts
Fourth row summary
In the fourth row, we get the memory utilization in the server.
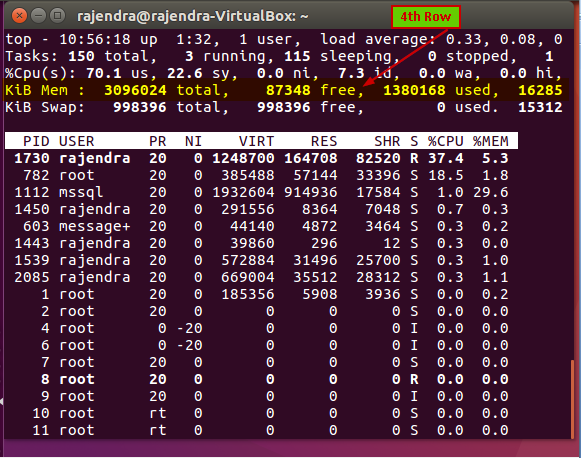
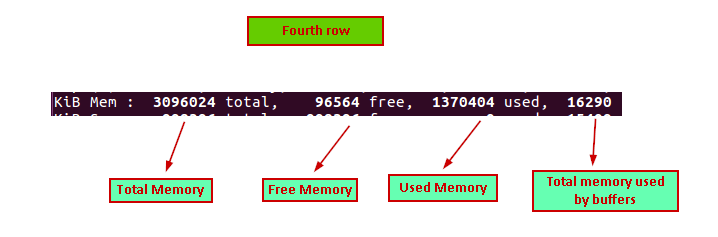
We can see the memory utilization information as:
- 3096024 total: Total system memory in KB
- 96564 free: Available memory in KB
- 1370404 used: Used memory in KB
- 16290: Memory used by the buffer cache in KB
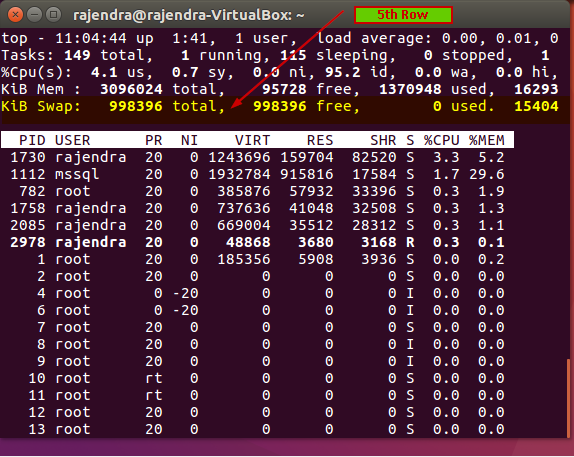
Fifth Row summary
In the fifth row, we get information about the swap memory utilization. We can consider swap memory as the page file in the windows system.
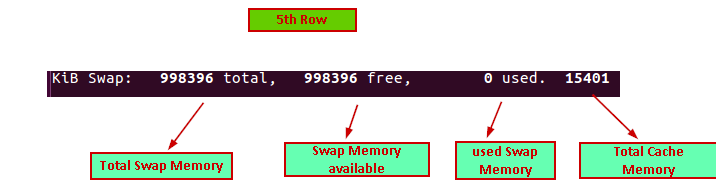
Below is the information in the 5th row:
- 998396 total: Total swap memory in KB
- 988396 free: Available swap memory in KB
- 0 used: Currently used swap memory in KB
- 15401: Total Cache memory
Sixth Row summary
In the sixth row, we get a user process table:
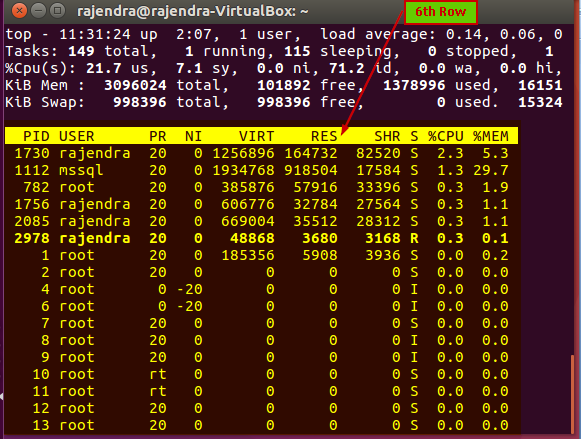
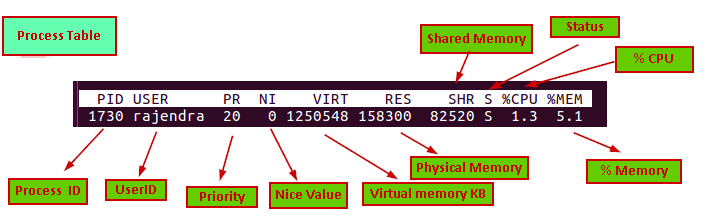
Let us understand the columns in the process table:
- PID: this is the process id of the running process
- User: It is the user id for which the process is running
- PR: it is the process priority. We can see value ‘rt’ in this column as well. RT means the process is running real-time
- Ni: It is the nice value of the process running. The negative value on this column shows high priority. Nice value range is -20 to 19 in which -20 is the highest and 19 lowest value
- VIRT: It is the virtual memory in KB used the process
- RES: it is the physical memory in KB used by that particular process
- SHR: it is the shared memory used by the process in KB
- S: it defines process status(S- Sleeping, R- running, I- idle, Z-Zombie)
- %CPU:% CPU used by the process
- %MEM: % memory used by the process
Now let us do understand how we can format the data sections as per our requirement to understand it more quickly.
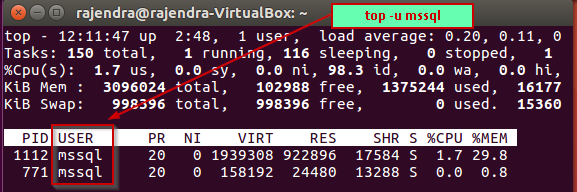
- Filter result based on the user id: We can filter out the result specific to user id with the ‘u’ option. For example, if we want to filter out the top command results for the ‘mssql’ user, we can run below command
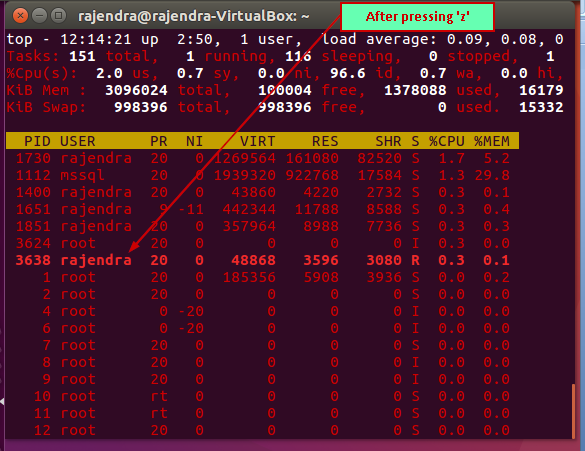
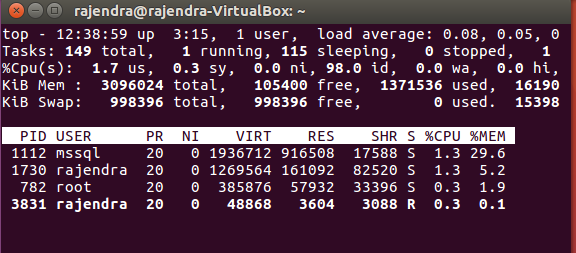
Highlight Running Process in Top: If we want to highlight current running process in bold letters, we can do by pressing ‘z‘ in running top command results. It changes the output as shown here. The current active session will be in the bold letter

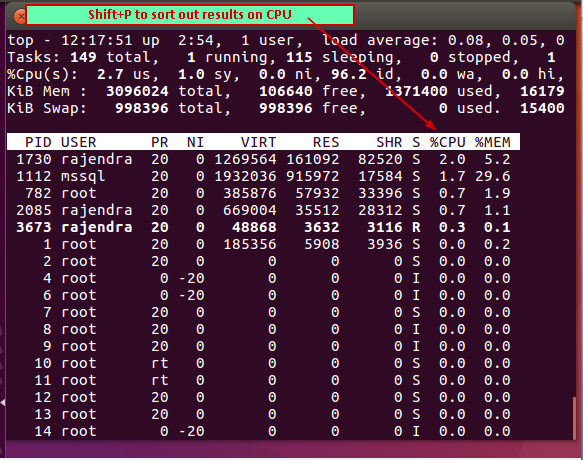
- Sort by CPU: Suppose we want to sort out the results based on the CPU time. We need to press (Shift+ P) to sort out the results on CPU time
- Refresh Display: By default, top command results refresh the information every 3 seconds. If we want to refresh data before 3 seconds, we can press click on the terminal and press ‘Enter’
Alternatively, if we want to change the refresh interval from 3 seconds, press ‘d’ and enter the delay value in seconds.
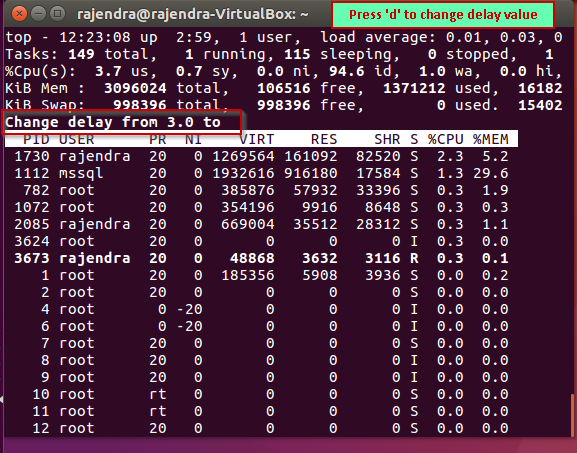
For example, I want to change the refresh interval from 3 seconds to 5 seconds, so enter value ‘5’ and press ‘Enter’ to save and apply this refresh interval setting.
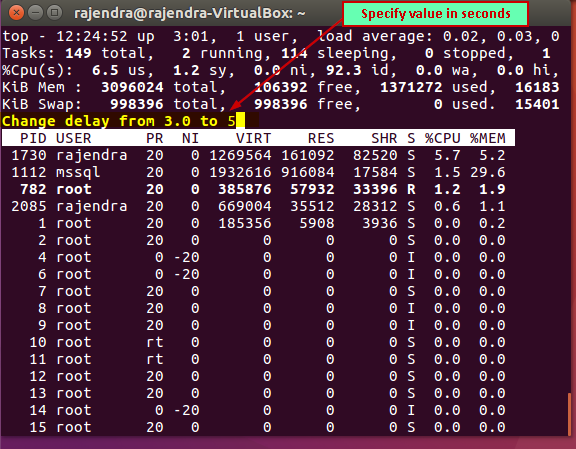
Press ‘Enter’ to save this new delay value. Now the data will be refreshed every 5 seconds.
Display Mode
In the top results, we can see the summary and the task data appears in the single screen. This is the default behavior. We can change the display to represent the field group. We can have maximum four-display field group.
Below are the field group windows:
- Def: here, results are sorted by %CPU
- Job: here, results are sorted by PID
- Mem: here, results are sorted by %MEM
- User: here, results are sorted by User field
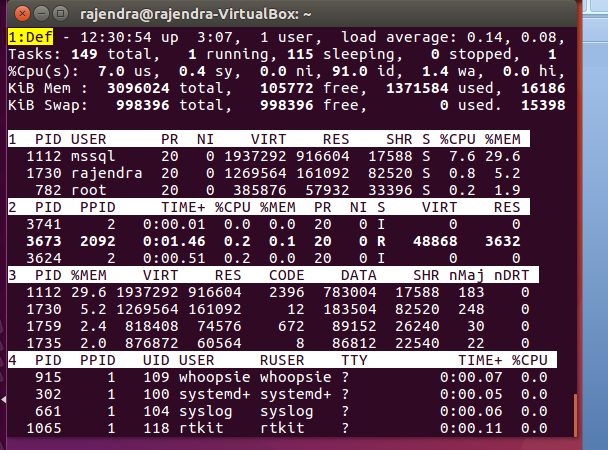
Press ‘A’ to switch to field group display mode. The output changes as shown below. Initially, it shows the field group 1 ‘Def’
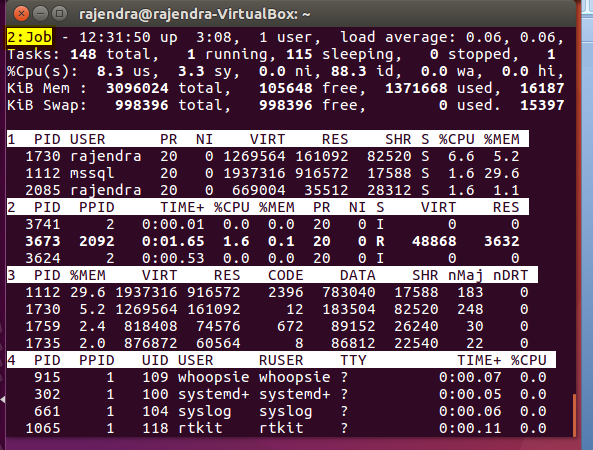
Press ‘a’ to move to next field group. Below you can see it switch to ‘job’
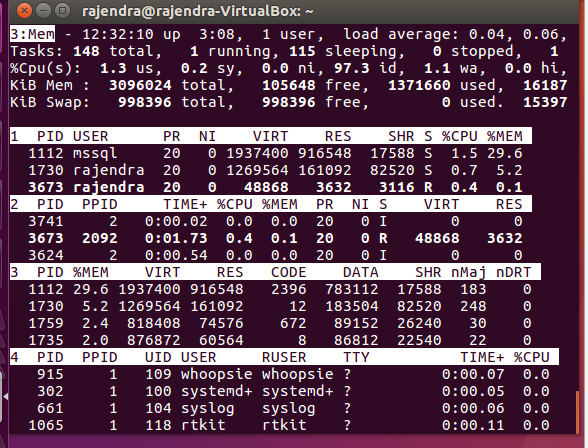
Again press ‘a’ and it switches to ‘Mem’
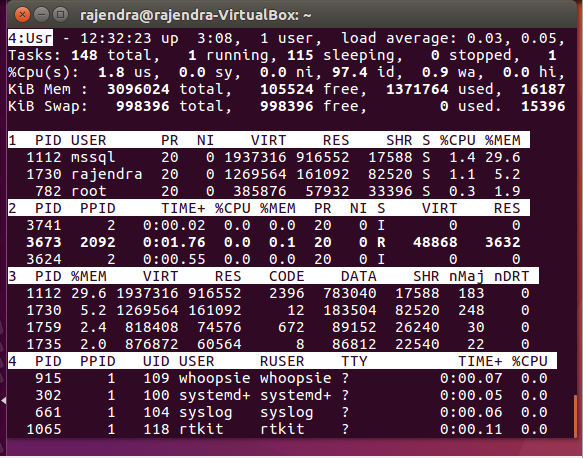
Last field group is ‘Usr’ as shown here:
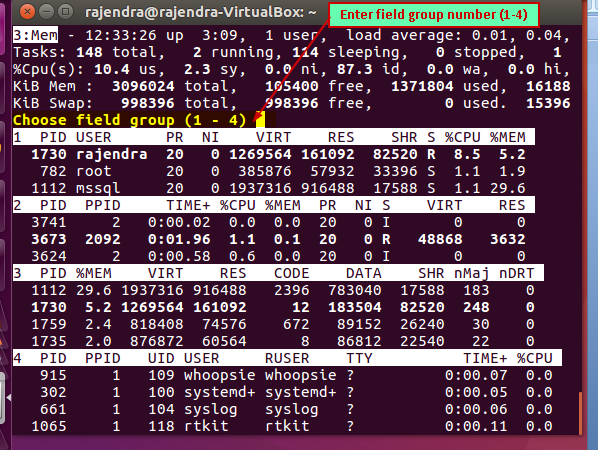
If we want to switch to a particular group, press ‘g’ and enter the field group name.
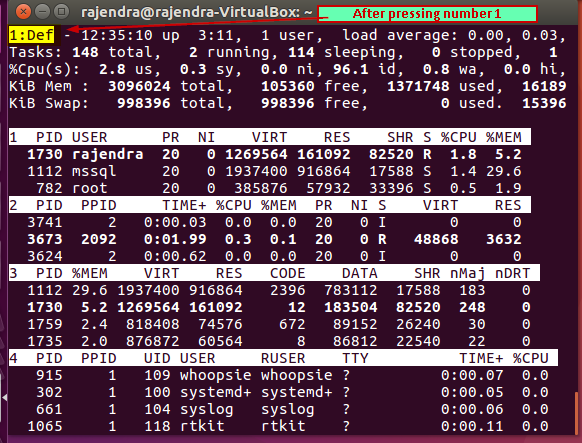
Once you enter the field group number, it immediately switches to that group. For example, in the below screenshot, I pressed ‘1’.
Remove idle tasks
If we do not want to see idle tasks in the output, press ‘i’ and it does not idle tasks.
Sorted columns
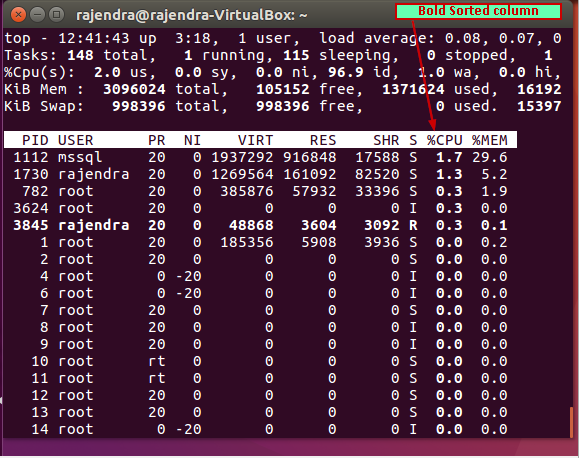
There might be cases where we forget on which filed we sorted out the results. Therefore, you can press ‘x’ and it will highlight the current sort column from the output. In below image, you can see ‘%CPU’ is showing up in bold characters. It means, our result is sorted out on this field. Similarly ‘y’ to highlight the row of running tasks.
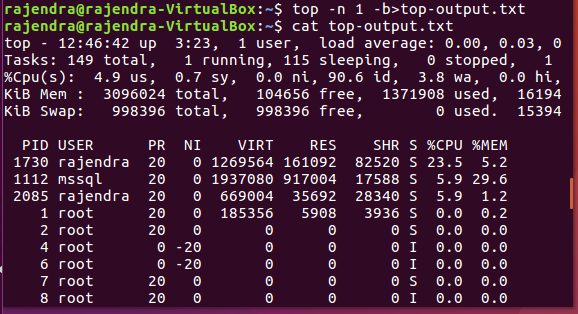
Save results into a text file
If we want to export the ‘top’ command output, we can do it into the text file with below command.
top -n 1 -b > top-output.txt
Viewing file contents
In Linux, you can view the file content using the ‘cat’ command as shown in below screenshot:
Conclusion
In this article, we explored the ‘top’ command, its usages and various formatting options. This will help you to troubleshoot performance issues in Linux environment.
Table of contents
| Helpful Linux commands for SQL Server DBAs – top |
| Helpful Linux commands for SQL Server DBAs – iotop and iostat |

I am the author of the book "DP-300 Administering Relational Database on Microsoft Azure". I published more than 650 technical articles on MSSQLTips, SQLShack, Quest, CodingSight, and SeveralNines.
I am the creator of one of the biggest free online collections of articles on a single topic, with his 50-part series on SQL Server Always On Availability Groups.
Based on my contribution to the SQL Server community, I have been recognized as the prestigious Best Author of the Year continuously in 2019, 2020, and 2021 (2nd Rank) at SQLShack and the MSSQLTIPS champions award in 2020.
Personal Blog: https://www.dbblogger.com
I am always interested in new challenges so if you need consulting help, reach me at rajendra.gupta16@gmail.com
View all posts by Rajendra Gupta
- Understanding PostgreSQL SUBSTRING function - September 21, 2024
- How to install PostgreSQL on Ubuntu - July 13, 2023
- How to use the CROSSTAB function in PostgreSQL - February 17, 2023